O R I G I N A L P A P E R
Open Access
Application of response surface
methodology for prediction and modeling
of surface roughness in ball end milling of
OFHC copper
Asiful H. Seikh
1*, Biplab Baran Mandal
2, Amit Sarkar
3, Muneer Baig
4, Nabeel Alharthi
1,5and Bandar Alzahrani
6Abstract
This study was conducted to investigate the synergistic effects of cutting parameters on surface roughness in ball end milling of oxygen-free high conductivity (OFHC) copper and to determine a statistical model that can suitably correlate the experimental results. Firstly, an experimental plan based on a full factorial rotatable central composite design with variable parameters, the cutting feed rate or feed per tooth, axial depth of cut, radial depth of cut, and the cutting speed, was developed. The range for each variable was varied through five different levels. Secondly, a mathematical model was formulated based on the response surface methodology (RSM) for roughness components (RaandRzmicron). The predicted values from the model were found to be close to the actual experimental values. Finally, for checking the adequacy of the models, analysis of variance (ANOVA) was used to examine the dependence of the process parameters and their interactions. The developed model would assist in selecting the cutting variables for optimization of ball end milling process for a particular material. Based on the results from this study, it is concluded that the step over or radial depth of cut have a higher contribution (45.81%) and thus has a significant influence on the surface roughness of the milled OFHC copper.
Keywords:OFHC copper, End milling, RSM, ANOVA, Surface roughness
Introduction
Oxygen-free high conductivity (OFHC) Cu is a pure form of Cu with 99.99% Cu and is widely used in electrical applications such as cryogenic shunts, X-ray storage ring, and various other industries for different applications (Mahto and Kumar, 2008; Yang and Chen, 2001; Zhang, Chen, and Kirby,2007).
Presently, the demand for good quality of finished OFHC Cu material (like a mirror finish surface) is increas-ing at a brisk pace for its use in various sectors, like manu-facturing, electrical, electronics, nuclear, and medical science (Mahto and Kumar, 2008; Yang and Chen, 2001; Zhang et al. 2007). To achieve a good quality of surface finished products, the selection of proper process parame-ters are important and essential (Yang and Chen, 2001).
Among the several metal cutting operations, end milling has been a vital, common, and widely used process for machining parts in numerous applications including aero-space, automotive, and several manufacturing industries (Mahto and Kumar,2008; Zhang et al.2007).
It is well known that the surface roughness is an impor-tant parameter in the machining process (Makadia and Nanavati, 2013). Usually, the product quality is measured by its surface roughness. Minimizing the surface rough-ness results in a product with good surface finish of the final machined part. Thus, researchers have directed their attention toward developing models and quantifying the relationship between roughness and its parameters. The determination of this relationship is for the advancement in manufacturing machines, materials technology, and the availability of modeling techniques. The different methods include that confined in this approach response surface method (RSM), factorial designs, and Taguchi methods (Lin,1994). Recently, these are the most popular methods
© The Author(s). 2019Open AccessThis article is distributed under the terms of the Creative Commons Attribution 4.0 International License (http://creativecommons.org/licenses/by/4.0/), which permits unrestricted use, distribution, and reproduction in any medium, provided you give appropriate credit to the original author(s) and the source, provide a link to the Creative Commons license, and indicate if changes were made.
* Correspondence:[email protected]
1Centre of Excellence for Research in Engineering Materials, King Saud
University, P.O. Box - 800, Riyadh 11421, Saudi Arabia
used by researchers that tend to reduce the effort of a machinist and minimize the machining time and cost which was not possible by the old experimental approach that includes single factor at a time or “trial-and-error” approach (Lin,1994). Among the various approaches used to predict the surface roughness, the present article demands a brief review of roughness modeling using RSM. Alauddin et al. (Alauddin, El Baradie, and Hashmi, 1996) presented their work on optimizing the surface finish of Inconel 718 in end milling. They used uncoated carbide inserts under dry operating conditions. The RSM was used to develop a first- and second-order models, and based on the results, it was concluded that with the increase in feed surface roughness, increases cutting speed but increasing speed results in a decrease in the surface roughness. Suresh et al. (Suresh, Rao, and Deshmukh, 2002) proposed a model dependent on the machining parameters for measuring the surface rough-ness of material and later optimized the parameters using a generic algorithm. Routara et al. (Routara, Bandyopadhyay, and Sahoo,2009) proposed a roughness model for end milling of three different materials: Al 6061-T4, AISI 1040 steel, and medium-leaded brass UNS C34000. The study included five roughness para-meters, and for each behavior, a second-order response surface equation was developed. Benadros et al. (Benardos and Vosniakos, 2002) presented a review for surface roughness prediction in the machining process. The
different approaches reviewed were based on machining, experimental design and investigation, and artificial intelligence. Colak et al. (Colak, Kurbanoglu, and Kayacan, 2007) optimized roughness parameters using a generic algorithm for generating end milled surface. A linear equation was proposed for the estimation of the surface roughness that was in terms of parameters such as cutting speed, feed, and depth of cut. Lakshmi et al. (Lakshmi and Subbaiah,2012) used RSM for modeling and optimization of the end milling process parameters. Average surface roughness for the EN24 grade steel stands for CNC verti-cal machining center. In addition, the second-order model was developed based on the feed, depth of cut, and the speed of cutting. It was shown that the predicted value from the model was in close agreement with the experi-mental values for Ra. Jeyakumar et al. (Jeyakumar and Marimuthu, 2013) used RSM to predict the tool wear, cutting force, and surface roughness of Al6061/SiC composite in end milling operation. The developed model was further used to investigate the synergistic effect of machining parameters on the tool wear. Ozcelik et al. (Ozcelik and Bayramoglu,2006) developed a statis-tical model to predict the surface roughness in high-speed flat end milling of AISI 1040 steel. The experiments were performed under wet cutting conditions using step over, spindle speed, feed rate, and depth of cut. It was found that R2adj increases from 87.9 to 94% by adding total machining time as a new variable. Mansour and Abdalla Fig. 1Experimental setup for measurement of surface roughness using Mitutoyo Surftest SJ-301
Table 1Chemical composition of OFHC Cu (wt%)
Cu O Pb S Sb Te Fe Cd Ni Ag
(Mansour and Abdalla, 2002) studied the roughness (Ra) in end milling of EN 32 steel using RSM. Wang et al. (Wang and Chang,2004) studied the effect of micro-end--milling cutting conditions on the roughness of a brass sur-face using RSM. Reddy and Rao (Reddy and Rao, 2005) developed a mathematical model using RSM to calcu-late surface roughness during end milling of medium carbon steel.
Based on the literature presented above, it reflects that there are mainly four machining parameters that effect on the surface roughness of end milled parts. Thus, in the present study, two roughness parameters viz. rough-ness average (Ra) and mean roughness depth (Rz) was Table 2Parameters and their levels in ball nose milling
Parameter Symbol (units) Levels
−2 −1 0 1 2
Cutting speed Vc(m/min) 80 85 90 95 100
Cutting feed rate fz(mm/ tooth) 0.01 0.04 0.07 0.10 0.13
Axial depth of cut ap(mm) 0.1 0.2 0.3 0.4 0.5
Radial depth of cut ae(mm) 0.05 0.07 0.09 0.11 0.13
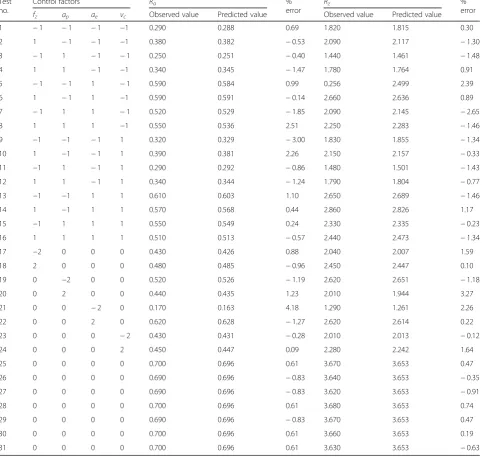
Table 3Experimental design-CCD matrix in coded form and measured value of responses
Test no.
Control factors Ra %
error
Rz %
error
fz ap ae vc Observed value Predicted value Observed value Predicted value
considered as responses for generating stata istical pre-dictive model in terms of machining parameters.
Experimental procedure
The machine used for milling tests is ‘MIKRON VCP710’CNC machining center having the control sys-tem Heidenhain TNC430 MHS with a vertical milling head. The maximum spindle speed and work feed rate of the machine is 18,000 rpm and 15 m/min respectively. Visicam 15 for drawing and tool path generation is used.
The experimental setup used in this study is shown in Fig. 1. The cutting tool used in the present work was a solid carbide ball nose end mill cutter. The tool has a cut-ter diamecut-ter of 8 mm; overall length, 63 mm; fluted length, 45 mm; helix angle, 30o; hardness is less than 48 HRC number of flutes, 2. It was produced by“Sandvik” Coro-mill Plura (CoroMill Plura solid carbide end Coro-mills tool handbook “Sandvik Coromont,” n.d.). Surface roughness was measured using Surftest SJ-301. The Surftest SJ-301 is set to a cut-off length (λc) of 0.8 mm, maximum traverse speed of 0.5 mm/s, and an evaluation length of 4 mm. Fig. 2Normal probability plot of residuals forRa
Stylus material is a diamond having a tip radius of 5 μm. The roughness tester is shown in Fig. 1. Surface roughness was measured in the transverse direction on the workpiece.
Workpiece material
The present study was performed on the OFHC Cu. The chemical composition of the OFHC copper used is shown
in Table1. The dimension of the specimen was 145 mm × 90 mm × 38 mm.
Experimental design
The RSM technique is based on the statistical and mathematical (least-square fitting method) approach for modeling and analysis of the problems where the response is influenced by several parametric variables. The RSM can be considered as a systematic approach to find Fig. 4Normal probability plot of residuals forRz
Table 4Analysis of variance for mean roughness depthRa(µm) (reduced quadratic model)
Source DF Sum of squares Adj. mean square Fvalue pvalue Cont. % Remarks
Regression 12 0.7068 0.05890 1068.48 0.000 Significant
Linear 4 0.3425 0.08564 1553.50 0.000
fz 1 0.0051 0.00510 92.59 0.000 0.72 Significant
ap 1 0.0126 0.01260 228.64 0.000 1.78 Significant
ae 1 0.3243 0.32434 5883.60 0.000 45.81 Significant
Vc 1 0.0005 0.00050 9.15 0.007 0.07 Significant
Square 4 0.3539 0.08850 1605.34 0.000
fz×fz 1 0.1032 0.10320 1872.09 0.000 14.58
ap×ap 1 0.0828 0.08284 1502.82 0.000 11.69
ae×ae 1 0.1612 0.16117 2923.69 0.000 22.77
Vc×Vc 1 0.1165 0.11649 2113.11 0.000 16.46
Interaction 4 0.0103 0.00257 46.00 0.000
fz×ae 1 0.0076 0.00766 138.89 0.000 1.07
fz×Vc 1 0.0018 0.00181 32.77 0.000 0.25
ap×ae 1 0.0003 0.00031 5.56 0.030 0.04
ae×Vc 1 0.0005 0.00051 9.18 0.007 0.07
Error 18 0.0009 0.00005
Lack-of-fit 12 0.0008 0.00068 2.39 0.146 Not significant
Pure error 6 0.0002 0.00003
Total 30 0.7078
R2 0.9986
R2
adj: 0.9977
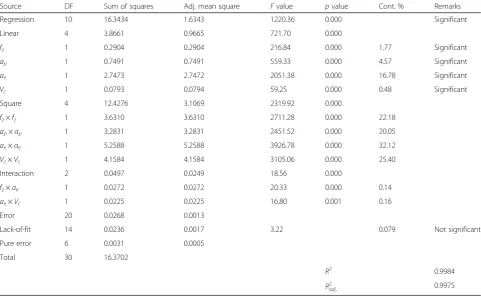
Table 5Analysis of variance for mean roughness depthRz(μm) (reduced quadratic model)
Source DF Sum of squares Adj. mean square Fvalue pvalue Cont. % Remarks Regression 10 16.3434 1.6343 1220.36 0.000 Significant Linear 4 3.8661 0.9665 721.70 0.000
fz 1 0.2904 0.2904 216.84 0.000 1.77 Significant ap 1 0.7491 0.7491 559.33 0.000 4.57 Significant ae 1 2.7473 2.7472 2051.38 0.000 16.78 Significant Vc 1 0.0793 0.0794 59.25 0.000 0.48 Significant
Square 4 12.4276 3.1069 2319.92 0.000
fz×fz 1 3.6310 3.6310 2711.28 0.000 22.18 ap×ap 1 3.2831 3.2831 2451.52 0.000 20.05 ae×ae 1 5.2588 5.2588 3926.78 0.000 32.12 Vc×Vc 1 4.1584 4.1584 3105.06 0.000 25.40
Interaction 2 0.0497 0.0249 18.56 0.000
fz×ae 1 0.0272 0.0272 20.33 0.000 0.14 ae×Vc 1 0.0225 0.0225 16.80 0.001 0.16
Error 20 0.0268 0.0013
Lack-of-fit 14 0.0236 0.0017 3.22 0.079 Not significant Pure error 6 0.0031 0.0005
Total 30 16.3702
R2 0.9984
he relationship between various machining criteria and process parameters (Montgomery, 2005).
The design of the experiment was performed on Minitab 17 software package. Minitab is designed for analysis of data obtained from the following steps:
1. Choose the number of process parameters taken for the experiment.
2. Select the appropriate model to be used.
3. ANOVA for analysis to check the adequacy of the model.
4. Use proper elimination process stepwise, backward or forward elimination.
5. Inspect the diagnostic plots to validate the model statistically.
6. Steps (2) and (3) helps in identifying if the model is appropriate followed by generating model graphs (contour and 3D graphs) for interpretation.
In RSM, the initial step is to find an approximation for the functional relationship between the response (y) and controllable variables {x1,x2, …,xn}. This relationship in terms of input parameters is written as (Montgomery, 2005):
y¼ðx1;x2;……;xnÞ þε ð1Þ
When the response function is non-linear or, there exist a curvature in the system, then a higher degree must be used, such as the second-order model;
y¼a0þXk ajXjþ
Xk ajjX2
jþ
Xk−1Xk
aijXiXjþε
j¼1 j¼1 i j
ð2Þ
Where,i= 1, 2,…,k−1 andj= 1, 2,…,kwithi<j, a0 free term or constant term of the regression equation, the coefficientsa1,a2, . . ,akand a11,a22, . . ,akkare the linear and the quadratic terms respectively; while a12, a13, . . , ak−1 are the interaction terms. X’s represents input parameters (f, ap, ae, and Vc). The output surface roughness components (Ra and Rz) are also called the response factors, andεrepresents the noise or error ob-served in the response (y) (Montgomery, 2005). The RSM fit a model used to apply the least-square tech-nique. However, the calculated coefficients should be tested for statistical significance. The data required to develop the computation was collected from the design of experiments based on rotatable central composite design (RCCD) (Box and Hunter, 1957) and by varying each numeric factor over five levels coded as−2,−1, 0, 1, and +2. The coded values were calculated using the following relationship in Eq. (3):
Xi¼
2 2ð X−ðXmaxþXminÞÞ
Xmax−Xmin ð
3Þ
Where Xi is the required coded value of a variableX, X is any value of the variable fromXmintoXmax, Xminis the lower limit of the variable. The intermediate values are coded as −1, 0, and 1. The selected parameters with their level are shown in Table 2. The experimental design consists of 31 runs as with the experimental results are outlined in Table3.
Table 6Results of ANOVA analysis
Response Lack-of-fit DF
Pure error
Fratio Whether model is adequate or not Model Standard
Ra 12 6 2.39 4.00 Adequate Rz 14 6 3.22 3.96 Adequate
Results and discussion
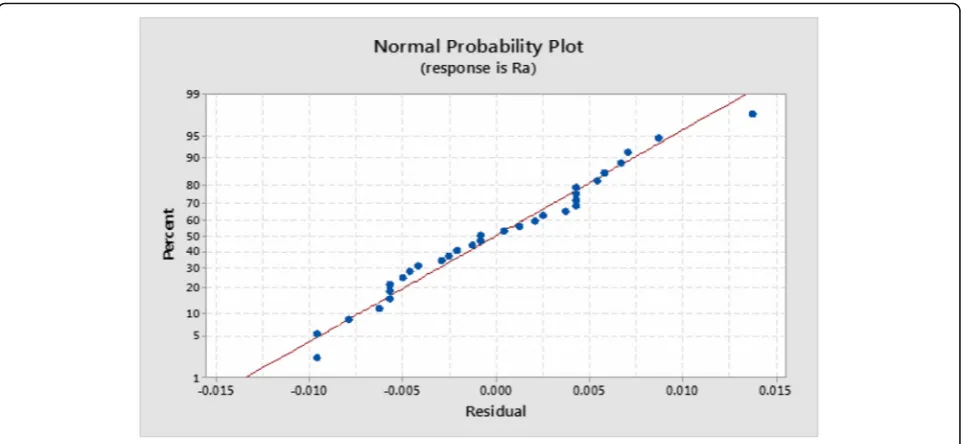
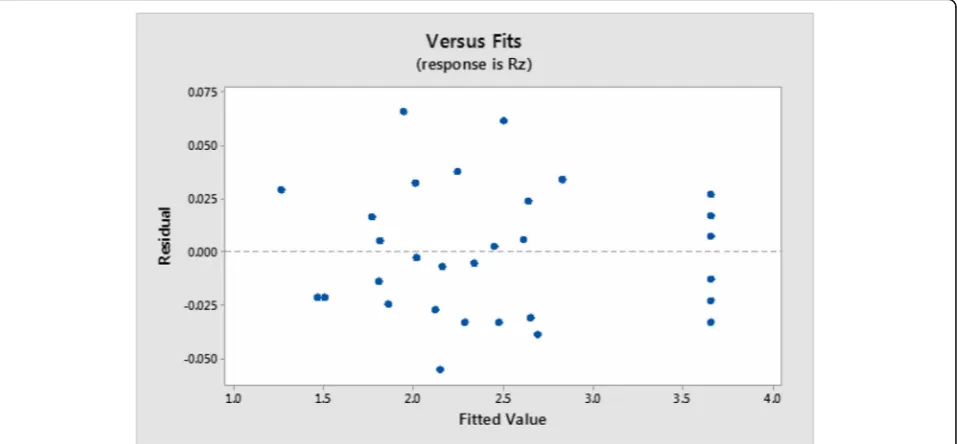
Table 3 presents experimental results of the responses (Ra and Rz), also the predicted values obtained from rethe gression equation and percentage error. The surface roughness (Ra) and mean roughness depth (Rz) values are obtained in the range of (0.17–0.70μm) and (1.29–3.680μm) respectively. Figures 2, 3, 4, and 5 present the normal probability plots of residuals and plot of residuals vs. predicted response for both roughness components (Ra,Rz).
Statistical analysis
The ANOVA for the surface roughness components Ra andRzare obtained from Minitab 17 statistical software. These components were used to analyze the influence of
cutting speed, feed per tooth, axial depth of cut, and radial depth of cut on the experimental results. Tables4 and 5 show the ANOVA result of roughness compo-nents Ra andRzrespectively. The results from ANOVA and the Fratio were used to check the adequacy of the models as well as to show the significance of the indivi-dual model coefficients.
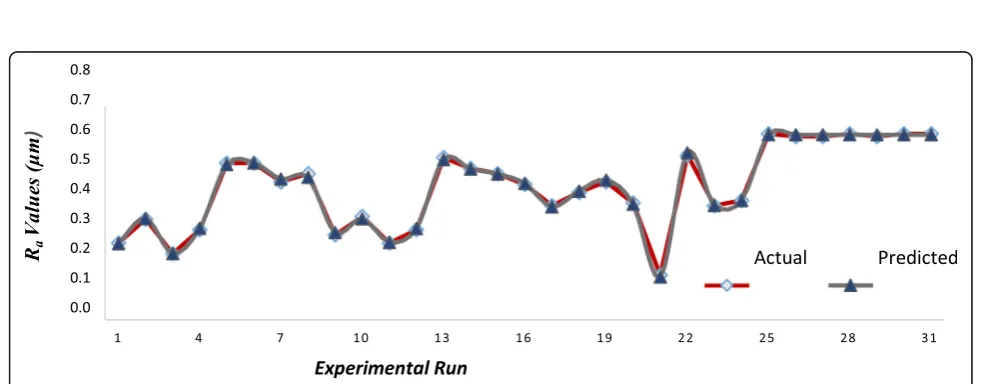
Table 4 shows ANOVA for roughness average (Ra). From this table, it can be seen that all the linear, square terms are significant, and the two-way interaction effect of cutting feed rate and radial depth of cut (fz×ae), cutting feed rate and cutting speed (fz×Vc), axial depth of cut and radial depth of cut (ap×ae), step over, and cutting speed (ae×Vc) are regarded as significant terms. Except two-level inter foraction, the effects of fzap and Fig. 7The comparison between measured and predicted value for the roughness value (Rz)
apVc are becoming insignificant as their p value is greater than 0.05, thus are not included in the final quadratic model. Table 4 shows that coefficient of correlationR2is 99.86% which approaches to unity; this indicates a close correlation between the experimental and the predicted values as shown in Fig.2. A check on the plots in Figs.2and4reveals that the scatter of resi-duals are very close to the straight line implying the normal distribution of errors. Moreover, the scattered data in Figs. 3 and 5 revealed that there is no obvious pattern and formed unusual structure. This shows a good relation between residual and fit values.
The comparison ofFratio for lack-of-fit and standard values are presented in Table 4 corresponding to their degrees of freedom. The standard percentage point of F
distribution for 95% confidence level is shown in Table6. This shows the F value (2.39) for lack-of-fit is smaller than the standard value indicating that the proposed model is adequate. The analysis of results shows that the effect of feed per tooth (fz) has a significant influence on the surface roughness with a 45.81% contribution to the model because surface finish increases as step over decreases. Axial depth of cut is the next dominant factor with a contribution of 1.78%. Cutting speed (Vc) with 0.07% contribution has the lowest effect on the surface roughness in ball end milling of OFHC Cu material.
Similarly, Table 5 shows the ANOVA table for the mean roughness depth (Rz). It is found that the radial depth of cut or step over (ae) is the significant factor affecting Rz. Its contribution is 16.78%. F= 3.22 < 3.96
(F0.05,14,6= 3.96) for lack-of-fit DF is given in Table6and shows that lack-of-fit is insignificant thus model forRzis also adequate. The next largest factor influencing (Rz) is axial depth of cut (ae) with a contribution of 4.57%. The cutting speed (Vc) with 0.48% contribution has a poor weak significant effect. The two-way interaction terms
fz×ap, fz×Vc, ap×ae, and apVc are not significant as theirpvalue being less than 0.05.
Regression equation
The relationship between the factors and the perfor-mance measures are modeled by quadratic regression. The regression equations for both the roughness compo-nents are formed by performing a backward elimination process. This procedure automatically reduces the terms that are not significant.
The roughness average Ra model is given below in Eq. (4).
R¼0:695þ0:0145fz−0:0229apþ0:116aeþ0:0045Vc−0:06f2z−0:053a 2 p −0:075a2
e−0:0638V2c−0:021fza−0:0106fzVc−0:0043apae−0:0056aeVc
ð4Þ
The mean roughness depth (Rz) is given by Eq. (5) with a determination coefficient (R2) of 82.14%.
Rz= 3.652 + 0.11fz−0.176ap+ 0.338ae+ 0.057Vc−
0.356fz2−0.338ap2−0.428ae2−0.381Vc2−0.041fz+ 0.037aeVc
regression Eqs. (4) and (5) corresponding to different combinations of machining parameters are reported in Table 3. Figures 6 and 7 show the comparison of pre-dicted values and the corresponding experimental values. It is observed that the predicted values are in close agreement with the experimental calculations.
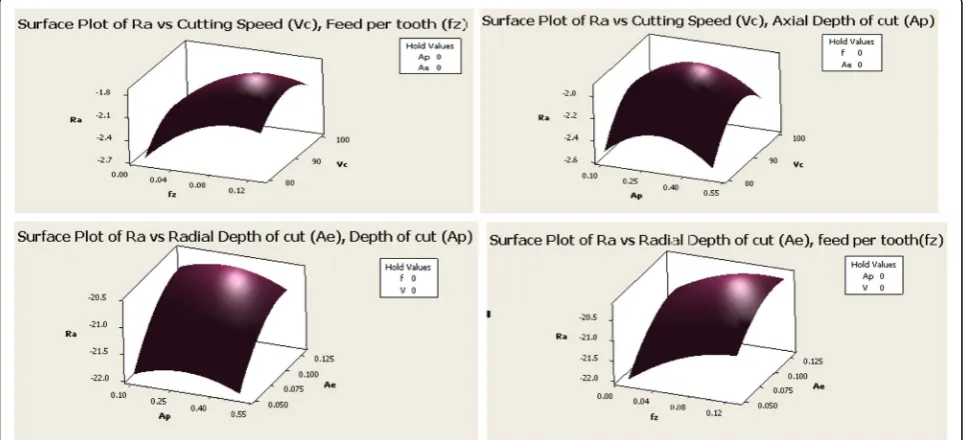
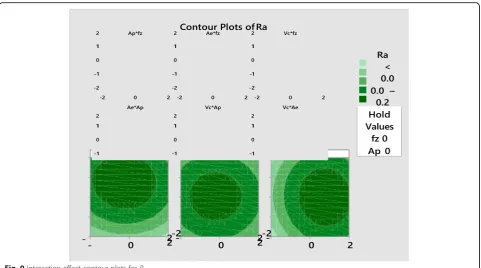
3D surface and contour plots
The 3D surface graphs and contours for the surface roughness components (Raand Rz) are shown in Figs.8 and 9. All the surface graphs have a curvilinear profile corresponding to the quadratic model fitted. This means all plot of interactions for surface roughness have a significant effect.
From the surface plot, it is depicted that with a setting of low radial depth of cut and near to higher level of axial depth of cut, cutting feed rate, and cutting speed, a good surface finish can be obtained.
Confirmation test
Figures 6 and 7 illustrate the variation between mea-sured values and predicted responses. It can be seen that the results of the comparison are in close agreement with each other and can predict the values of surface roughness components (Ra and Rz) accurately with a 95% confidence interval.
Conclusion
The present study successfully demonstrated the effect of cutting speed, depth of cut, feed per tooth, and step over on surface roughness in end milling of OFHC copper using a solid carbide ball nose end milling cutter. The following conclusions were derived from the study:
1. Surface roughness analysis using RSM was successfully carried out. It was concluded that the systematic approach in central composite design is beneficial as it saves a number of experimentations required.
2. Using the principles of response surface
methodology, a functional relationship between the surface roughness and the cutting parameters is established.
3. Quadratic model is fitted for both the roughness components (RaandRz).
4. ANOVA tests result confirmed that models are adequate and can be adapted to mill OFHC Cu for achieving the desired surface finish. Comparison between actual and predicted values confirmed that the fitted quadratic model shows a good relational behavior. Lack-of-fit was insignificant.
5. The surface roughness model suggests that the radial depth of cut provides primary contribution (45.81%) and influences most significantly on the
surface roughness. Axial depth of cut provided a secondary contribution to the model followed by cutting feed rate and cutting speed.
6. The obtained contours and surface plots will help on selecting the optimum cutting parameters in order to achieve higher surface finish.
Acknowledgements
The authors thank Manufacturing Technology Group (MTG) Lab of CISR-CMERI Durgapur, West Bengal, India, 713209 for providing experimental setup and all necessary equipment’s required during experimentation. The authors would like to extend their sincere appreciation to the Deanship of Scientific Research at King Saud University for its funding of this research through the Research Group Project No. RG-1439-029.
Funding
This research received no external funding.
Declarations
The authors declare that on acceptance of the manuscripts for publication the data used for the work will be available to all concerned. The will be interesting for both scientific and industrial purpose especially to all Cu industries.
Authors’contributions
BBM contributed to conceptualization and validation. BBM and AS helped in the data creation, investigation and methodology, and project administration and resources. BBM, AS, and AHS helped in the formal analysis. AHS and NA acquired the funding. BA, AHS, and NA supervised the study. BBM, AS, AHS, BA, MB, and NA helped in writing—original draft. BA, MB, AHS, and NA contributed to writing—review and editing. All authors read and approved the final manuscript.
Competing interests
The authors declare that they have no competing interests.
Publisher’s Note
Springer Nature remains neutral with regard to jurisdictional claims in published maps and institutional affiliations.
Author details
1Centre of Excellence for Research in Engineering Materials, King Saud
University, P.O. Box - 800, Riyadh 11421, Saudi Arabia.2Department of
Mechanical Engineering, ISM, Dhanbad, Jharkhand 826004, India.
3Department of Metallurgical Engineering, Jadavpur University, Kolkata, India. 4Engineering Management Department, College of Engineering, Prince
Sultan University, Riyadh, Saudi Arabia.5Mechanical Engineering Department,
College of Engineering, King Saud University, P.O. Box - 800, Riyadh 11421, Saudi Arabia.6Mechanical Engineering Department, Prince Sattam Bin
Abdulaziz University, Al Kharj, Saudi Arabia.
Received: 6 January 2019 Accepted: 7 March 2019
References
Alauddin, M., El Baradie, M. A., & Hashmi, M. S. J. (1996). Optimization of surface finish in end milling of Inconel 718.Journal of Materials Processing Technology, 56, 54–65.
Benardos, P. G., & Vosniakos, G. C. (2002). Prediction of surface roughness in CNC face milling using neural networks and Taguchi’s design of experiments.
Robotics and Computer Integrated Manufacturing, 18, 343–354.
Box, G. E., & Hunter, J. S. (1957).Multifactor experimental designs, Ann Math Stat
(pp. 28–195).
Colak, O., Kurbanoglu, C., & Kayacan, M. C. (2007). Milling surface roughness prediction using evolutionary programming methods.Materials and Design, 28, 657–666.
Jeyakumar, S., Marimuthu, K., & RamachandranT. (2013). Prediction of cutting force, tool wear and surface roughness of Al6061/SiC composite for end milling operation using RSM.Journal of Mechanical Science and Technology, 27(9), 2813–2822.
Lakshmi, V. V. K., & Subbaiah, V. K. (2012). Modelling and optimization of process parameters during end milling of hardened steel.International Journal of Engineering Research and Applications, 2, 674–679.
Lin, S. C. (1994).Computer numerical control—From programming to networking. Albany: Delmar.
Mahto, D., & Kumar, A. (2008). Optimization of process parameters in vertical CNC mill machines using Taguchi’s Design of Experiments.Ariser, 4(2), 61–75. Makadia, J. A., & Nanavati, J. I. (2013). Optimization of machining parameters for
turning operations based on response surface methodology.Elsevier Measurement, 46, 1521–1529.
Mansour, A., & Abdalla, H. (2002). Surface roughness model for end milling: A semi- free cutting carbon case hardening steel (EN32) in dry condition.
Journal of Materials Processing Technology, 124, 183–191.
Montgomery, D. C. (2005).Design and analysis of experiments. New York: Wiley. Ozcelik, B., & Bayramoglu, M. (2006). The statistical modelling of surface
roughness in high-speed flat end milling.International Journal of Machine Tools and Manufacture, 46, 1395–1402.
Reddy, N. S. K., & Rao, P. V. (2005). Selection of optimum tool geometry and cutting conditions using surface roughness prediction model for end milling.
International Journal of Advanced Manufacturing Technology, 26, 1202–1210. Routara, B. C., Bandyopadhyay, A., & Sahoo, P. (2009). Roughness modeling and optimization in CNC end milling using response surface method: Effect of work-piece material variation.International Journal of Advanced Manufacturing Technology, 40, 1166–1180.
Suresh, P. V. S., Rao, P. V., & Deshmukh, S. G. (2002). A genetic algorithmic approach for optimization of surface roughness prediction model.
International Journal of Machine Tools and Manufacture, 42, 675–680. Wang, M. Y., & Chang, H. Y. (2004). Experimental study of surface roughness in
slot end milling AL2014-T6.International Journal of Machine Tools and Manufacture, 44, 51–57.
Yang, L. J., & Chen, C. J. (2001). A systematic approach for identifying optimum surface roughness performance in end-milling operations.Journal of Industrial Technology, 17(2), 1–8.