O R I G I N A L P A P E R
Open Access
Taguchi-fuzzy multi-response optimization
in fly cutting process and applying in the
actual hobbing process
Minh Tuan Ngo
1*, Vi Hoang
1and Sinh Vinh Hoang
2Abstract
Background:Applying nanofluid made by adding alumina nanoparticles to industrial oil may reduce the cutting force, friction, and cutting temperature and, from that, improve the tool life in the hobbing process. However, it is difficult to set up the experiment for the actual gear hobbing process, because measuring the cutting force and temperature in the hobbing process is very complicated and expensive. Therefore, a fly hobbing test on the horizontal milling machine was performed to simulate the actual hobbing process. Methods: In this research, the fuzzy theory was combined with the Taguchi method in order to optimize multi-responses of the fly hobbing process as the total cutting force, the force ratioFz/Fy, the cutting temperature, and the surface roughness.
Results: The optimal condition—A1B1C3 (the cutting speed 38 mpm\, the nanoparticle size 20 nm, and concentration 0.5%)—was determined by analyzing the performance index (FRTS) of the fuzzy model.
Furthermore, this condition was applied to the actual hobbing process in the FUTU1 Company and compared with the actual conditions of this company and other conditions using the nanolubricant with 0.3% Al2O3, 20 nm. The results show that it can reduce a maximum 39.3% of the flank wear and 59.4% of the crater wear on the hob when using the optimal conditions.
Conclusions: The study indicates that the optimal condition determined by using Taguchi-Fuzzy method can be applied in the FUTU1 company with the high efficiency.
Keywords: Gear hobbing, Optimization, Fuzzy, Fly cutting, Cutting fluid, Nanofluid
Background
The hobbing processes with complex kinematic motions cause the high friction coefficient, great cutting force, and high temperature. Those properties lead to hob wear, the main cause in reducing the quality of the hobbed gear, so using the suitable cutting fluid is very important. In recent years, nanolubricant, mixing the normal lubricant with nanoparticles, gradually became a new trend study for metal cutting enhancement. Espe-cially, the Al2O3 nanoparticles have many properties such as heat resistance, spherical shape, and a high spe-cific temperature, consistent with adding to the
industrial oils, so it is suitable for the machining process (Sharma et al, 2015). Malkin and Sridharan (2009) indi-cated that the new cutting fluids mixing the Al2O3 pow-der with water were used to reduce the grinding forces and the cutting temperature and improve the surface roughness. Vasu and Reddy (2011) indicated that the using of the cutting fluids added Al2O3 nanoparticles which can decrease the tool wear, temperature, and sur-face roughness in machining 600 aluminum alloys. And the influences of nanofluids on surface roughness and tool wear in the hobbing process concluded that using nanofluids with Al2O3nanoparticles resulted in decreas-ing surface roughness values (Ra, Rz) and tool wears in the manufactured spur gears, researched by Khalilpour-azary and Meshkat (2014). But, the effect of Al2O3 nano-particle size and concentration that added to the cutting
* Correspondence:[email protected]
1Faculty of Mechanical Engineering, Thai Nguyen University of Technology, Thai Nguyen, Vietnam
Full list of author information is available at the end of the article
fluids in gear hobbing on the fundamental parameters of the hobbing process has not been published yet.
Further, the experiments in the hobbing process are too expensive as the cost of the hob tools or a gear hob-bing machine is very high, and it is very difficult to measure the cutting force and temperature during the machining process. A fly hobbing experiment was de-signed to simulate the actual hobbing process by many authors as Rech (2006), Umezaki et al. (2012), and Stein et al. (2012). The present paper experimentally investi-gates applying new nanofluids to reduce the hob wear by reducing the cutting force, friction, and cutting temperature in the fly hobbing process. A fuzzy model based on the Taguchi experiment design has been used to optimize the multi-responses of the fly hobbing process. Using Minitab 16, the signal-to-noise (S/N) ra-tios for different outputs of the fuzzy model (the total cutting force, the force ratio Fz/Fy, the cutting temperature, and the surface roughness) were calculated by the Taguchi method. Then, theS/Nratios are used to determine a resultant index (the FRTS index) for esti-mating the fly hobbing process by using fuzzy logic the-ory. These FRTS values were used for multi-response optimization and gave the optimum parameter level for the fly hobbing process. Furthermore, the optimum pa-rameters were applied for the actual hobbing process and compared with the initial parameters.
Methods
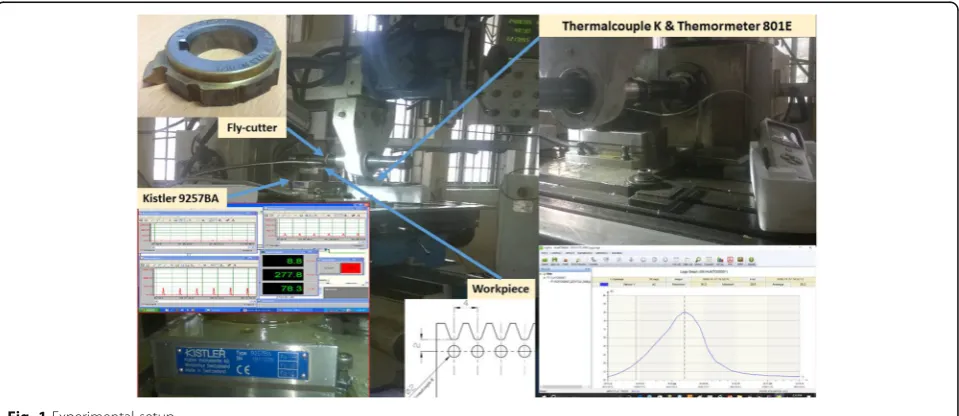
Experimental setup
A fly hobbing test was performed on milling machining with a single tool coated with the TiN film and the same profile as a hob tooth used in a gear manufacture line at
the Machinery Spare Parts No.1 Joint Stock (FUTU1) Company (see Fig. 1). The cutting conditions of the fly cutting process such as cutting depth and feed rate are set as becoming the same conditions with the hob tooth carrying the biggest load on the real hobbing process used in FUTU1, shown in Table1.
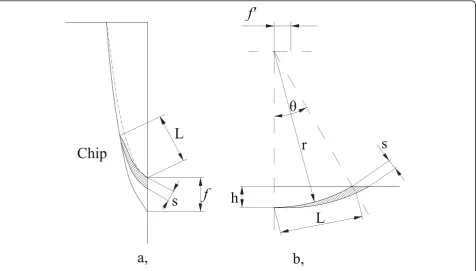
Figure2a shows the shape of chips produced by the tips of hob teeth while Fig.2b shows the state of cutting in slot milling. The maximum chip thickness (s) and chip length (L) are calculated from the characteristics of the hobbing process by using equations by Hoffmeister 1970. The fly cutting process is performed with the cutting depthhand feedf′to give chips the same size as those produced by a hob tooth. The cutting depth hand feed f′can be calcu-lated by the formals h = r.(1−cosθ); f′= S/sinθ, and θ =L/r. So, the characteristics of the fly hobbing process are calculated and also showed in Table2.
The workpiece made of chromium molybdenum steel (SCM420) was fixed on a KISTLER dynamometer. The KISTLER dynamometer mounted on the worktable of the milling machine allowed three dynamic forces to be measured. The total cutting force R is calculated from two measured forcesFyandFz, as Fig.3. Moreover, San Juan et al. (2010) found the formal calculation for the friction coefficient based on the thickness chip achieves its maximum value:
μ¼NF ¼ tan θ−arctan FZ
Fy
ð1Þ
where: μ is the friction coefficient value and θ is the angle calculated based on the thickness chip achiev-ing its maximum value as Fig. 2b.
According to Eq. (1), the friction coefficient can be represented by the ration force Fz/Fy; the friction coefficient value decreases when the ratio force FZ/ Fy increases. So, the ratio force FZ/Fy was one of the output parameters of the analysis experiment.
The thermocouple type k was inserted into the workpiece in order to determine the temperature of the workpiece by using the thermometer 801E HUATO, shown in Fig. 1. The ISO VG46 industrial oil was popularly used for the gear-cutting processes in the FUTU1 Company due to its economic char-acteristics. The Al2O3 nanoparticles made by the US Research Nanomaterials have a high sintering temperature, heat resistance, and coefficient of heat transfer and spherical structure. According to Khalilpourazary, nanopowders were mixed with the industrial oils following the weight ratio of 0. 1% ÷ 0.5% in order to produce the nanolubricant. To compare and evaluate the cooling-lubrication ef-fectiveness of the nanofluid, Al2O3 nanoparticles with the size of 20, 80, and 135 nm, and the con-centration of 0.1, 0.3, and 0.5% were selected ac-cording to the economical requirement.
Design of Taguchi experiments
The Taguchi design was chosen to research the ef-fects of some factors on the total cutting force, the force ratio Fz/Fy, the cutting temperature, and the surface roughness in the fly hobbing process. Table 3
shows the L18 orthogonal array chosen from Tagu-chi’s standard-orthogonal-array table. The Taguchi method popularly uses the S/N ratio to consider the influence of the survey parameters on the output parameters. The greater the value of the S/N ratio, the less the impact of the noise parameters. The S/ N ratio is determined as follows (Roy, 1990):
S=N¼−10Log10½MSD ð2Þ
where MSD is the mean square deviation for output parameters. The MSD values can be determined by three types of the S/N ratio characteristics: nominal the better, smaller the better, and greater the better. According to Eq. (1), the friction coefficient value decreases when the ratio force FZ/Fy increases. Thus, to reduce the friction coefficient, the greater the Table 1The parameters of the hobbing process (from FUTU1)
Tool Module (mm) Outside diameter (mm) Rake angle (°) Depth of cut (mm) Feed rate (mm) Spindle speed (mpm)
DTR-DIN-AA-TIN 1.75 60 0 4375 1.27 200–300
better quality characteristic for the ratio force FZ/Fy must be taken. With the total force, temperature and surface roughness, the smaller the better quality pa-rameters were chosen to calculate the S/N ratio.
The MSD for the greater the better quality char-acteristic can be calculated by (Montgomery, 2004):
MSD¼1
n
Xn
i¼1
1
x2
i ð
3Þ
The MSD for the smaller the better quality char-acteristic can be calculated by (Montgomery, 2004):
MSD¼1
n
Xn
i¼1x 2
i ð4Þ
where xi is the total cutting force and n is the num-ber of experiments.
The fuzzy logic optimization based on the Taguchi methodology
The theory of fuzzy logic is the mathematical model, suitable to solve uncertain and vague infor-mation. So, the fuzzy model can be used to
optimize multi-objects by converting the S/N ratios of the Taguchi experiment into a single index. How-ever, the S/N ratio values are calculated for the quality properties with different units by using the Taguchi model and converted to the non-unit values. And, “the greater the better” and “the smaller the better” categories are chosen to trans-form the S/N ratio values into a range between 0 and 1, while 0 means the worst performance and 1 the best. The normalized value for the smaller the better category can be determined by:
x
ið Þ ¼k
maxðxið Þk Þ−xið Þk
maxðxið Þk Þ−minðxið Þk Þ ð5Þ
The normalized value for the greater the better category can be calculated by:
x
ið Þ ¼k maxxið Þxk −minðxið Þk Þ ið Þk
ð Þ−minðxið Þk Þ ð6Þ
where xiðkÞ is the value after normalization for the kth response under ith experiment.
Table 2The dimensions of maximum chips produced during hobbing and the cutting condition required to produce the same chips in fly hobbing on the milling machine
Hobbing process Fly hobbing process on milling machine
Number of threads of hob Feed of hob (mm/rev) Length of chips (mm) Max thickness of chip (mm) Depth of cut (mm) Feed of table (mm/rev)
1 1.27 12.92 0.108 2.75 0.259
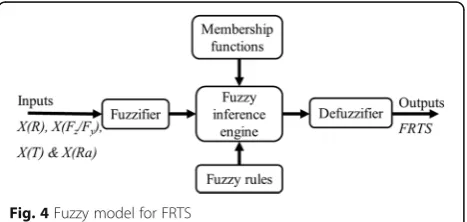
A fuzzy model was set up for the normalized values for the S/N ratios of the Taguchi experiment, shown in Fig. 4.
The fuzzy model consists of a fuzzifier, an inference engine, the membership functions, the fuzzy rules, and defuzzifier (Klir & Yuan,2005). In the study, the fuzzifier uses membership functions to fuzzily the normalized values of theS/Nratios, and the inference system com-pletes a fuzzy based on fuzzy rules to create the fuzzy index. The fuzzy rules are generated from the group IF&THEN rules of the parameter inputs.
The fuzzy rules can be shown as:
Rule i: If x1 is Ai1; x2 is Ai2; x3 is Ai3...; and xj is Aij
then yi is Ci;
i= 1; 2; ... ;N;
where N is the total number of fuzzy rules, xj (j= 1,2,….s) are the normalized values, yi are the fuzzy values, and Aij and Ci are fuzzy sets defined by membership functions μAij(xj) and μCi(yj), respect-ively. The Mamdani implication method is chosen to perform for the inference of a set of different rules; the collected output for the N rules is
μCið Þ ¼yi max mini μAi1ð Þx1 ;μAi2ð Þx2 ; ;μAis xj
ð7Þ
And then, the defuzzifier converts the fuzzy out-puts into the absolute values. The defuzzification method is used to find non-fuzzy value y0 (in this
paper, the non-fuzzy value is FRTS): yo ¼
P yi:μCiðyiÞ
P
μCiðyi:Þ
Results and discussion
Multi-objective optimization
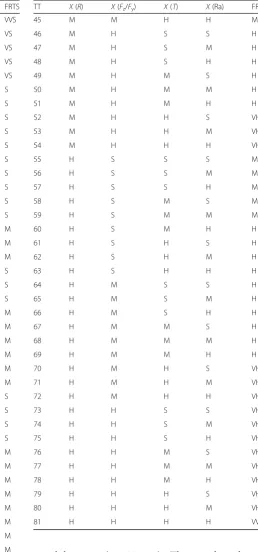
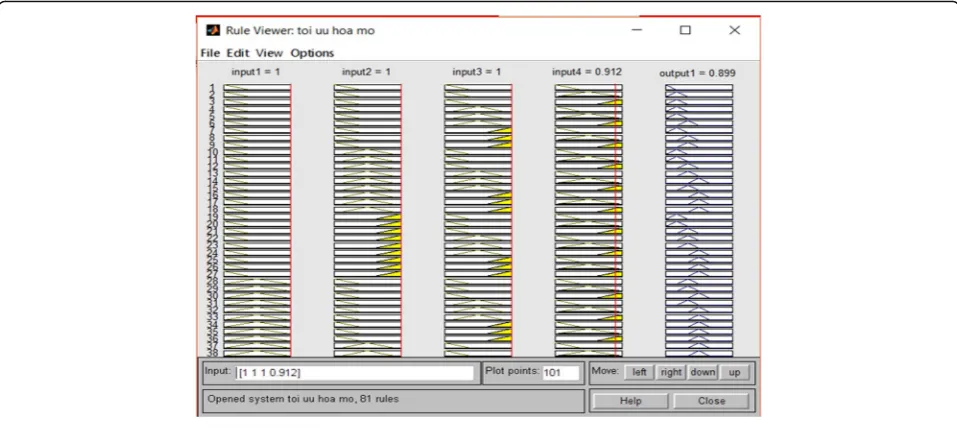
The S/N ratio is used to determine the optimal par-ameter settings. The values S/N for the total cut-ting forces, the ratio forces Fz/Fy, the cutting temperatures, and the surface roughness were cal-culated by Minitab 16, shown in Table 4. The nor-malized input parameters were calculated by the formulas (5) and (6), shown in Table 4. In this study, the fuzzy model has been designed by MATLAB 9, in order to optimize multi-responses for the fly hobbing process, illustrated in Fig. 5. There are three fuzzy sets for variables of input pa-rameters: small (S), medium (M) and high (H). The membership functions of the output variable are il-lustrated in Fig. 6. With four inputs and their three fuzzy sets, there are 34 (81) fuzzy rules used for this model. And there are seven fuzzy sets for vari-ables of FRTS: very very small (VVS), very small (VS), small (S), medium (M), high (H), very high (VH), and very very high (VVH). The fuzzy rules are determined and shown in Table 4. The final FRTS output values were calculated by the defuzzi-fication method applying the fuzzy rules in Table 5
with the Mamdani inference of MATLAB 9 soft-ware and shown in Fig. 7. The maximum value of FRTS has the highest ranking and the minimum value of FRTS has the lowest ranking as also shown in Table 6. The maximum average FRTS for mini-mum total cutting force, maximini-mum ratio force Fz/ Fy, minimum cutting temperature, and minimum surface roughness are obtained at a level 1 (38 mpm) of cutting speed, level 1 (20 nm) of nanoparticle size, and level 3 (0.5%) of nanoparticle concentration is A1B1C3.
Table 3Experimental design based on L18 orthogonal array
Exp. no. Cutting speedA(mpm) Nano. sizeB(nm) Nano. con.C(%)
1 38 20 0.1
2 38 20 0.3
3 38 20 0.5
4 38 80 0.1
5 38 80 0.3
6 38 80 0.5
7 38 135 0.1
8 38 135 0.3
9 38 135 0.5
10 50 20 0.1
11 50 20 0.3
12 50 20 0.5
13 50 80 0.1
14 50 80 0.3
15 50 80 0.5
16 50 135 0.1
17 50 135 0.3
18 50 135 0.5
The analysis of variance (ANOVA)
The ANOVA analysis results with 96.8% confidence intervals were used to determine the impact of the coefficient on the multiple responses (FRTS) and shown in Table 7. The values of critical F ratio were determined and shown in Table 7. The result indi-cates that control parameters B (nanoparticle size) and C (nanoparticle concentration) are the greatest effect parameters to the FRTS values (Table 8).
Applying the optimal conditions on the actual hobbing process
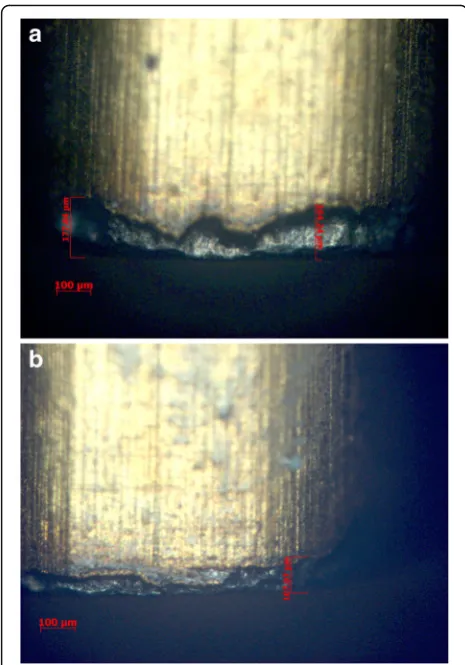
The flank wear of hob with optimal conditions and normal conditions were measured by the Zeiss op-tical microscope after the 500th gears were ma-chined, shown in Fig. 8. Figure 8a shows the flank wear of the hob under the normal conditions using the normal oils (177.84 μm), and the result shows that the TiN coating was cracked and stripped; the great mechanism wears of the HSS material were detected. Figure 8b shows the flank wear of the hob
under the optimal conditions using the
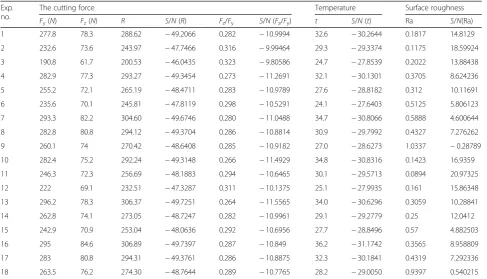
Table 4TheS/Nratio and normalized values for input parameters
Exp. no.
The cutting force Temperature Surface roughness
Fy(N) Fz(N) R S/N(R) Fz/Fy S/N(Fz/Fy) t S/N(t) Ra S/N(Ra)
1 277.8 78.3 288.62 −49.2066 0.282 −10.9994 32.6 −30.2644 0.1817 14.8129
2 232.6 73.6 243.97 −47.7466 0.316 −9.99464 29.3 −29.3374 0.1175 18.59924
3 190.8 61.7 200.53 −46.0435 0.323 −9.80586 24.7 −27.8539 0.2022 13.88438
4 282.9 77.3 293.27 −49.3454 0.273 −11.2691 32.1 −30.1301 0.3705 8.624236
5 255.2 72.1 265.19 −48.4711 0.283 −10.9789 27.6 −28.8182 0.312 10.11691
6 235.6 70.1 245.81 −47.8119 0.298 −10.5291 24.1 −27.6403 0.5125 5.806123
7 293.3 82.2 304.60 −49.6746 0.280 −11.0488 34.7 −30.8066 0.5888 4.600644
8 282.8 80.8 294.12 −49.3704 0.286 −10.8814 30.9 −29.7992 0.4327 7.276262
9 260.1 74 270.42 −48.6408 0.285 −10.9182 27.0 −28.6273 1.0337 −0.28789
10 282.4 75.2 292.24 −49.3148 0.266 −11.4929 34.8 −30.8316 0.1423 16.9359
11 246.3 72.3 256.69 −48.1883 0.294 −10.6465 30.1 −29.5713 0.0894 20.97325
12 222 69.1 232.51 −47.3287 0.311 −10.1375 25.1 −27.9935 0.161 15.86348
13 296.2 78.3 306.37 −49.7251 0.264 −11.5565 34.0 −30.6296 0.3059 10.28841
14 262.8 74.1 273.05 −48.7247 0.282 −10.9961 29.1 −29.2779 0.25 12.0412
15 242.9 70.9 253.04 −48.0636 0.292 −10.6956 27.7 −28.8496 0.57 4.882503
16 295 84.6 306.89 −49.7397 0.287 −10.849 36.2 −31.1742 0.3565 8.958809
17 283 80.8 294.31 −49.3761 0.286 −10.8875 32.3 −30.1841 0.4319 7.292336
18 263.5 76.2 274.30 −48.7644 0.289 −10.7765 28.2 −29.0050 0.9397 0.540215
nanolubricants (107.98 μm). This result indicated that the width of flank wear using the optimal con-ditions using nanofluids is smaller than that using the normal condition of the FUTU 1 Company. It clearly reveals that the width of flank wear reduces about 39.3% under the optimal condition with the nanolubricant compared to the normal conditions. Table 5Fuzzy rule table
TT X(R) X(Fz/Fy) X(T) X(Ra) FRTS
1 S S S S VVS
2 S S S M VS
3 S S S H VS
4 S S M S VS
5 S S M M VS
6 S S M H S
7 S S H S S
8 S S H M S
9 S S H H S
10 S M S S S
11 S M S M S
12 S M S H S
13 S M M S S
14 S M M M S
15 S M M H S
16 S M H S M
17 S M H M M
18 S M H H M
19 S H S S S
20 S H S M S
21 S H S H S
22 S H M S M
23 S H M M M
24 S H M H M
25 S H H S M
26 S H H M M
27 S H H H M
28 M S S S S
29 M S S M S
30 M S S H S
31 M S M S S
32 M S M M M
33 M S M H M
34 M S H S M
35 M S H M M
36 M S H H M
37 M M S S M
38 M M S M M
39 M M S H M
40 M M M S M
41 M M M M M
42 M M M H M
43 M M H S M
44 M M H M M
Table 5Fuzzy rule table(Continued)
TT X(R) X(Fz/Fy) X(T) X(Ra) FRTS
45 M M H H M
46 M H S S H
47 M H S M H
48 M H S H H
49 M H M S H
50 M H M M H
51 M H M H H
52 M H H S VH
53 M H H M VH
54 M H H H VH
55 H S S S M
56 H S S M M
57 H S S H M
58 H S M S M
59 H S M M M
60 H S M H H
61 H S H S H
62 H S H M H
63 H S H H H
64 H M S S H
65 H M S M H
66 H M S H H
67 H M M S H
68 H M M M H
69 H M M H H
70 H M H S VH
71 H M H M VH
72 H M H H VH
73 H H S S VH
74 H H S M VH
75 H H S H VH
76 H H M S VH
77 H H M M VH
78 H H M H VH
79 H H H S VH
80 H H H M VH
Fig. 7Calculating the final FRTS outputs on MATLAB 9
Table 6The fuzzy value FRTS
Exp. no. V(mpm) Size (nm) Nano con. (%) x(R) x(Fz/Fy) x(T) x(Ra) FRTS Ranks
1 38 20 0.1 0.144 0.318 0.257 0.710 0.348 11
2 38 20 0.3 0.539 0.892 0.520 0.888 0.657 3
3 38 20 0.5 1.000 1.000 0.940 0.667 0.837 1
4 38 80 0.1 0.107 0.164 0.295 0.419 0.285 13
5 38 80 0.3 0.343 0.330 0.667 0.489 0.418 6
6 38 80 0.5 0.522 0.587 1.000 0.287 0.5 4
7 38 135 0.1 0.018 0.290 0.104 0.230 0.269 14
8 38 135 0.3 0.100 0.386 0.389 0.356 0.365 10
9 38 135 0.5 0.297 0.365 0.721 0.000 0.406 7
10 50 20 0.1 0.115 0.036 0.097 0.810 0.224 15
11 50 20 0.3 0.420 0.520 0.454 1.000 0.5 4
12 50 20 0.5 0.652 0.811 0.900 0.760 0.714 2
13 50 80 0.1 0.004 0.000 0.154 0.497 0.177 16
14 50 80 0.3 0.275 0.320 0.537 0.580 0.384 8
15 50 80 0.5 0.453 0.492 0.658 0.243 0.5 4
16 50 135 0.1 0.000 0.404 0.000 0.435 0.336 12
17 50 135 0.3 0.098 0.382 0.280 0.357 0.366 9
18 50 135 0.5 0.264 0.446
Table 7Analysis of variance (ANOVA) for the FRTS
Source DF Seq SS Adj SS Adj MS F P
Cutting speed (A) 1 0.0112 0.0112 0.0112 12.13 0.025
Nanoparticle size (B) 2 0.125357 0.125357 0.062679 67.87 0.001
Nanoparticle concentration (C)
2 0.259467 0.259467 0.129734 140.47 0.000
A×B 2 0.020931 0.020931 0.010466 11.33 0.023
A×C 2 0.000827 0.000827 0.000413 0.45 0.668
B×C 4 0.071170 0.071170 0.017792 19.27 0.007
Error 4 0.003694 0.003694 0.000924 – –
Total 17 0.492647 – – – –
Table 8Response table for FRTS
Level Cutting speed (A) Nanoparticle size (B) Nanoparticle con. (C)
1 0.4539 0.5467 0.2732
2 0.4040 0.3773 0.4483
3 – 0.3628 0.5653
Delta 0.0499 0.1838 0.2922
After 500 gears were machined, the crater wear of the rake surface of hob was taken by the Zeiss op-tical microscope at three positions on the rake face (right, center, and left), shown in Figs. 9 and 10. The result revealed that a portion of the TiN coat-ing is removed from the rake face. Figure 9 shows the crater wear of hob (right 154.72 μm, center 163. 22 μm, and left 158.98 μm position on rake face) after machining 500 gears with the normal condi-tions using a normal lubricant (Fig. 10) and the crater wear on hob (right 66.28 μm, center 63. 38 μm, and left-53.88 μm position on rake face) after machining 500 gears with the optimal condi-tions using the nanolubricant. The result indicated that the width of the crater wear area under the nanolubricant is clearly smaller than that under the normal lubricant. Hence, some dents can be found on the rake surface under normal oils, while noth-ing on the rake face under nano oils.
Conclusions
A single fuzzy multi-response performance index (FRTS) was determined by using a fuzzy logic model based on the Taguchi methods to optimize multiple responses in the fly hobbing process. The research results show that the fly hobbing test can be used to study the gear hobbing process before applying in the actual hobbing process. The results also indi-cate that the nanoparticle concentrations and the nanoparticle size are the greatest effect factors to fuzzy multi-response performance index (FRTS) by using the fuzzy logic model based on the Taguchi method with the fly hobbing process. The optimum parameter values for different control parameters have been suggested as nanoparticle concentration 0.5%, nanoparticle size 20 nm, and cutting speed Fig. 8Flank wear of the hob withanormal conditions using normal
lubricant andboptimal conditions using nanolubricant (0.5% Al2O3, 20 nm)
38 nm. Applying the optimal conditions in the ac-tual hobbing process was investigated in the FUTU 1 Company and reduced 39.3% the flank wear and 59.4% the width of crater wear. This result initially indicated the efficiency of using nanoparticles in the gear hobbing process with the actual conditions of the FUTU1 Company in Vietnam.
Acknowledgements
The authors acknowledge the device support under Thai Nguyen University of Technology, Hanoi University of Science and Technology, and Machinery Spare Parts No.1 Joint Stock Company (FUTU1), Vietnam.
Authors’contributions
NT and HV set up the experiment model and performed the design of the Taguchi experiment. HS used MATLAB software to set up the fuzzy logic optimization model. NT, HV, and HS participated in the analysis and discussion of results. All authors read and approved the final manuscript.
Competing interests
The authors declare that they have no competing interests.
Publisher’s Note
Springer Nature remains neutral with regard to jurisdictional claims in published maps and institutional affiliations.
Author details
1Faculty of Mechanical Engineering, Thai Nguyen University of Technology, Thai Nguyen, Vietnam.2School of Mechanical Engineering, Hanoi University of Science and Technology, Hanoi, Vietnam.
Received: 21 July 2017 Accepted: 21 March 2018
References
21212Hoffmeister (1970).Über den Verschleiß am Wälzfräser. Aachen: Diss. RWTH. Khalilpourazary, S, & Meshkat, S. (2014). Investigation of the effects of alumina
nanoparticles on spur gear surface roughness and hob tool wear in hobbing process.International Journal of Advanced Manufacturing Technology,71, 1599–1610.
Klir, GJ, & Yuan, B (2005).Fuzzy sets and fuzzy logic (theory and applications), (Third ed., ). New Delhi: Prentice Hall of India.
Malkin, S and Sridharan (2009) Effect of minimum quantity lubrication (MQL) with nanofluids on grinding behavior and thermal distortion Trans. NAMRI/SME 37: 629–636.
Montgomery, DC (2004).Design and analysis of experiments, (5th ed., ). New York: John Wiley & Sons.
Rech, J. (2006). Influence of cutting edge preparation on the wear resistance in high speed dry gear hobbing.Wear,261, (5–6), 2114–2122.
Roy, R (1990).A primer on the Taguchi method, (p. 245). New York: Van Nostrand Reinhold.
San Juan, M, Martın, O, Santos, F. (2010). Experimental study of friction from cutting forces in orthogonal milling.International Journal of Machine Tools & Manufacture,50, 591–600.
Sharma, AK, Singh, RK, Dixit, AR, Tiwari, AK. (2015). Characterization and experimental investigation of Al2O3 nanoparticle based cutting fluid in turning of AISI 1040 steel under minimum quantity lubrication (MQL). Materials Today Proceedings,3, 1899–1906.
Stein, S, Lechthaler, M, Krassnitzer, S, Albrecht, K, Schindler, A, Arndt, M. (2012). Gear hobbing: a contribution to analogy testing and its wear mechanisms. Procedia CIRP,1, 220–225.
Umezaki, Y, Funaki, Y, Kurokawa, S, Ohnishi, O, Toshiro. (2012). Wear resistance of coating films on hob teeth (intermittent cutting tests with a flytool).Journal of Advanced Mechanical Design,6(2), 206–221.
Vasu, V, & Reddy, GPK. (2011). Effect of minimum quantity lubrication with Al2O3 nanoparticles on surface roughness, tool wear and temperature dissipation in machining Inconel 600 alloy.Proceedings of the Institution of Mechanical Engineers,225, 3–16.