R E S E A R C H
Open Access
Important differences and meaningful
changes for the Functional Assessment of
Cancer Therapy-Cognitive Function
(FACT-Cog)
M L Bell
1,2*, H M Dhillon
3, V J Bray
4and J L Vardy
5Abstract
Background:We estimated clinically important, group-level differences in self-reported cognitive function for the Functional Assessment of Cancer Therapy-Cognitive Function (FACT-Cog) instrument. We also investigated individual level change that could be considered meaningful for cancer survivors affected by cognitive impairment following chemotherapy, and that could be used for responder analyses. We used data from a multi-site randomized controlled trial in 242 participants that evaluated a web-based intervention for improving self-reported cognitive functioning in adult cancer survivors who reported cognitive impairment and who had adjuvant chemotherapy in the previous 6– 60 months. We used anchor and distribution methods to estimate a range of clinically important differences (CIDs) and investigated meaningful change thresholds (MCTs) for the FACT-Cog and the Perceived Cognitive Impairments (PCI) subscale, post-intervention and at six-month follow-up with empirical cumulative distribution functions. Our primary anchor was the patient reported cognitive function subscale of the European Organization for Research and Treatment of Cancer Quality of Life-Cognitive Functioning Scale (EORTC-CF).
Results:Most participants were female (95%) breast cancer survivors (89%). Correlation of changes in the FACT-Cog and the EORTC-CF were 0.55 post-intervention and 0.61 at follow-up. Anchor-based CID estimates for the FACT-Cog using our primary anchor were 11.3 points (post) and 8.8 (follow-up), which corresponds to a standardized effect size of 0.49 and 0.38; 8.6% and 6.6% of the total scale’s range. Anchor-based CID estimates for the FACT-Cog PCI subscale were 7.4 (post) and 4.6 points (follow-up), which corresponds to a standardized effect size of 0.50 and 0.31; 10.3% and 6.4% of the PCI range). Empirical cumulative distribution functions of change in FACT-Cog demonstrating possible MCTs showed that anchor change of none, minimally better and much better were well separated.
Conclusions:The CID and MCT estimates from this manuscript can help in the design, analysis and interpretation of self-reported cognitive function in cancer patients and survivors.
Keywords:Oncology, Cancer, Chemotherapy, Cognitive impairment, Quality of life, Minimal clinically important difference, FACT-Cog, Responder, Clinically important difference, Cumulative distribution function
* Correspondence:[email protected]
1Department of Epidemiology and Biostatistics, Mel and Enid Zuckerman
College of Public Health, University of Arizona, 1295 N Martin Ave, Tucson, AZ 85724, USA
2Psycho-Oncology Co-operative Research Group, School of Psychology,
University of Sydney, Sydney, NSW, Australia
Full list of author information is available at the end of the article
Background
Cognitive impairment related to cancer and cancer treatment is a major concern for many cancer survivors [1, 2]. Self-reported questionnaires and neuropsycho-logical tests are the two main methods used to assess cognitive function, although the majority of studies have found a poor association between the two [2]. The etiology of cancer-related cognitive impairment remains unknown and there is a lack of evidence to guide how best to treat it. Further research and randomized con-trolled trials (RCTs) assessing interventions for cogni-tive impairment are urgently required.
The design, analysis and interpretation of studies that use patient reported outcomes (PROs), such as self-reported cognitive function in cancer survivors, can be enhanced by the identification of important dif-ferences between groups. This has been known as the minimum important difference (MID), or more re-cently, the clinical important difference (CID) [3 ].Im-portant changes for individuals are called meaningful change thresholds (MCTs).
Historically, PRO researchers have referred to the MCT as the MID, however, with the 2009 FDA’s PRO Guidance for Industry’s shift from this terminology [4], and the recognition that the MID (which we will refer to henceforth as the CID) was being estimated not on differences between groups, but on changes within group, the thinking about CIDs and MCTs has evolved. Although the terminology is changing [3], there is con-siderable overlap in the methodology for investigating CIDs and MCTs, as described below.
CIDs (i.e., differences between groups, such as treat-ment arms in a clinical trial) are important in study de-sign in order to calculate power and sample size. MCTs are useful in interpretation of results for individuals and can be used to define a“responder” for responder analyses [4, 5]. MCTs are larger than CIDs because there is more uncertainty around individuals than groups (similar to why prediction intervals, where infer-ence is on individuals, are always wider than confidinfer-ence intervals, where inference is on groups). Best practice for discovering MCTs is still developing. For further re-view and emerging methods, see [3,5–8].
Both the MCT and the CID can vary with patient population and setting, and as Revicki et al., state, “Confidence in a specific MID value evolves over time and is confirmed by additional research evidence” [9]. Further, there is growing recognition that both MCT and CID may best be described as a range, rather than a single number [10]. There are two approaches for in-vestigating CIDs and MCTs. The primary approach is to link changes in the PRO to an anchor, which can be clinical (e.g., disease progression), or patient ratings of changes in health [9]. A second method, which can be
used to provide supporting evidence for anchor based estimates, are distribution based methods [9]. Distribu-tion based methods use the between-participant stand-ard deviation to characterize changes. Details of both approaches are given in theMethodssection.
One approach for investigating important changes in individuals, endorsed by the FDA, is to display the en-tire distribution of changes for individuals, the empirical cumulative distribution function (ECDF) [4,5,7,11]. This approach is congruent with the idea of not choosing a sin-gle value for an MCT. When investigating MCTs, the ECDFs should be stratified by categorized anchor values (e.g., much worse, minimum worse, same, minimum bet-ter, much better); when considering trial results, stratifica-tion should be by trial arm (e.g., intervenstratifica-tion, control). An effective intervention would have large separation between the curves.
Cheung and colleagues carried out a study to iden-tify the CID for a cognitive function assessment in-strument, the Functional Assessment of Cancer Therapy Cognitive Function (FACT-Cog), [12] using 220 breast cancer patients from Singapore whose cog-nitive functioning mostly declined [13]. To our know-ledge, this was the first assessment of CID for this instrument. Our team undertook a randomized con-trolled trial (RCT) using the FACT-Cog, where many participants reported improvement in cognitive func-tioning [14]. CIDs and MCTs can differ based on the direction of change (i.e., deterioration or improve-ment), thus it is important to estimate them in both settings [9, 15]. Furthermore, the authors did not score the questionnaire using the recommended ru-bric (described below). Thus, we identified an oppor-tunity to add to the body of knowledge surrounding this important patient reported outcome. Our trial and others we have designed, used the “Perceived Cognitive Impairments” (PCI) subscale from the FACT-Cog as its items appear to align well with our patients’ and study participants’ cognitive concerns. Thus, we aimed to estimate the FACT-Cog CID for the total score and the PCI subscale using data from 242 cancer survivors in an RCT set in Australia. We also aimed to investigate MCTs for this PRO in this population. Finally we aimed to show methods for in-vestigating both CIDs and MCTs to help distinguish the two concepts.
Methods
Questionnaire-Core 30 (EORTC-QLQ-C30-CF) as the primary anchor, and the Functional Assessment of Cancer Therapy-General (FACT-G), as a secondary anchor. These measures are described below.
Study setting
We carried out an RCT at 18 Australian sites evaluating an intervention for improving self-reported cognitive functioning in adult cancer survivors. Eligible partici-pants were at least 18 years old with any solid primary tumor (excluding malignancies of the central nervous system), who reported sustained cognitive symptoms after three or more cycles of adjuvant chemotherapy re-ceived in the previous 6–60 months [14].The interven-tion consisted of a 15-week home-based, web-based cognitive training program “Insight” versus usual care [16]. The primary outcome was the FACT-Cog per-ceived cognitive impairment subscale. Participants were measured at baseline (T1), post-intervention (T2), and 6 months post-intervention (T3). Primary trial results can be found elsewhere [14]. Ethical approval and con-sent were obtained for the original study.
Measures
FACT-Cog
The Functional Assessment of Cancer Therapy Cogni-tive Function version 3 (FACT-Cog) FACT-Cog is a 37-item member of the FACIT suite of questionnaires (Functional Assessment of Chronic Illness Therapy) [17]. The FACT-COG is made up of four subscales: perceived cognitive impairments (PCI; 18 items); per-ceived cognitive abilities (7 items); impact of perper-ceived cognitive impairment on QOL (4 items); and com-ments from others on cognitive function (4 items). The FACT-Cog has been found to be reliable and valid, and has been used in various cancer populations [12]. The FACIT’s recommended scoring method is to use 33 items and to score the four subscales separ-ately. (For scoring instructions, see www.FACIT.org.) We investigated CIDs and MCTs for the PCI subscale, as well as a total score, derived by summing the rec-ommended 33 items. The response options range from 0 to 4. Negative items were reverse scored for the total scores, so that higher values indicate better self-reported cognitive functioning. Cheung et al. used all 37 items, so we also computed a total score this way, in order to compare results. The possible ranges are 0–72, 0–132 and 0–148 for the PCI subscale, 33-and 37- item totals respectively.
EORTC-QLQ-C30
The European Organization for Research and Treatment of Cancer Quality of Life Questionnaire Core 30 (EORTC-QLQ-C30) is a widely used 30-item instrument for
assessing quality of life in cancer patients [18]. It has been shown to be reliable and valid [19]. We focused on the two items which make up the cognitive functioning scale, EORTC-CF:“Have you had difficulty in concentrating on things, like reading a newspaper or watching television?” and “Have you had difficulty remembering things?”. The EORTC-CF is scored by using a transformation from the 4-point Likert scale to a 0–100 point scale, with higher values indicating better cognitive func-tioning, and with possible values: 0, 16.67, 33.34, 50, 66.67, 83.33, 100 [18, 20].
FACT-G
The Functional Assessment of Cancer Therapy-General (FACT-G) is a reliable, valid, commonly-used question-naire for assessing health-related quality of life in can-cer populations. [21]. There are 27 items and four subscales: physical, social, emotional and functional well-being. The possible range is 0–108, with higher values corresponding to greater quality of life. We used this measure because its CID has been investigated in a variety of populations [17], but, since it does not dir-ectly assess cognitive functioning, we used it as a sec-ondary anchor.
Statistical methods
Descriptive statistics of demographics were computed. Means and standard deviations (SDs) were computed for each of the subscales and the total score, at each of the time points, by treatment arm. Cronbach’s alpha was calculated for the FACT-Cog items at each time point to assess internal consistency. Change from baseline was calculated by subtracting the base-line score from each of the post-basebase-line scores, so that positive values indicate improvement in cognitive functioning. All analyses used SAS version 9.4 (Cary, North Carolina).
Anchor based assessment of CIDs
more is much better, etc. The value for improvement (16.67) corresponds to an improvement by one category on one of the items on the EORTC-CF and a stable re-sponse on the other. The mean change in FACT-Cog was computed for each of these categories. The CID was estimated as the difference in scores for minimally better and no change [11], which follows recommenda-tions that using larger change may overestimate the CID [9], and follows the methods of Cheung et al. A change by one category is likely to be meaningful, as there are only four categories in the EORTC-CF. We did not investigate deterioration because so few partici-pants declined (n= 11 at T2,n= 7 at T3).
Standardized effect sizes (ES) were estimated by div-iding the CID estimate by the overall baseline standard deviation (SD). Similar methods were used for the sec-ondary anchor FACT-G, with categorizations of much worse (< −7 points), minimally worse (−7 to −4 points), no change (−3 to 3 points), minimally better (4–7 points) and much better (> 7 points). These values were arrived at by examining MID estimates of the FACT-G [17].
Distribution based assessment of the CID and the MCT
Distribution based methods for the CID and MCT have been recommended to support evidence gained from anchor-based methods [9,24]. Recommended CID esti-mates include calculating one half and one third the SD of the score. The standard error of measurement (SEM) has been considered as a lower bound for the MCT [5]. We used the SD at each time point. The SEM was cal-culated using SEM =σ√(1−ρT-RT), where ρT-RT= test -retest reliability [25]. We used the values ρT-RT= 0.74, obtained from a FACT-Cog validation study [26], in addition to the control group’s correlation between baseline and post-intervention ρT-RT= 0.70. (This was the value for both the FACT-Cog total score and the PCI subscale.) The control arm was used for estimating test-retest reliability because they would presumably experience less change than the intervention arm, thereby better approximating reliability. Both arms were used for all other estimation.
Anchor based investigation of the MCT
We graphed one minus the cumulative distribution function of the change from baseline in the FACT-Cog stratified by time (T2 and T3) and categories of the EORTC-CF anchor change of “no change”, “minimally better”, and “much better”, as defined above. Specific-ally, we graphed the proportion of participants, F(x) = 1 - CDF, whose change from baseline was greater than or equal to x. As described above this was not done for
deterioration, due to the small numbers. We plotted vertical lines at various thresholds to indicate possible MCTs, and showed the proportion of responders using these possible cutoffs in each of the three anchor cat-egories. These thresholds were averaged over T2 and T3 and were the rounded values of: 1) the standard error of measurement (for ρT-RT = 0.70) and 2) the dif-ference in the mean value of the change in FACT-Cog for those in the anchor category of “much better” and “same”. A reference line of no change was also shown.
Sensitivity analysis
As missing data in PROs can bias estimates, we per-formed sensitivity analyses [27–29]. Multiple imput-ation (MI) was undertaken and EORTC anchor based CID estimates for the FACT-Cog total score were computed. Imputation models included the FACT-Cog total score, the EORTC-CF score, previous cogni-tive problems (see Table 1), age, treatment arm, and other PROs (stress, health-related quality of life, and anxiety). Imputation was performed in “wide form”, with one record per subject (in contrast to “long form”, with a record per subject, per assessment time), so that within-subject correlation was main-tained. Twenty-five imputed datasets were created using the Markov Chain Monte Carlo method, as im-plemented in SAS version 9.4. CIDs were estimated for each of the 25 complete datasets [30] using an-chor and distribution methods as described above, and averaged, following Rubin’s rules [31].
Results
We report the results for the 33-item FACT-Cog total score in this manuscript. Results for the 37-item total score are given in the Appendix. Cronbach’s alpha at each time point was estimated as 0.89, 0.89, and 0.89 for the FACT-Cog at baseline, post-intervention and 6 months respectively; 0.94, 0.96, 0.96 for the FACT-Cog PCI subscale; 0.29, 0.73 and 0.69 for the EORTC-CF; and 0.60, 0.63, and 0.70 for the FACT-G.
Patient population
Total score CID estimation
The polyserial correlation between the categorized change in EORTC-CF and the change in the FACT-Cog was 0.55 for T2 and 0.61 for T3. Estimates were well over the benchmark of 0.3–0.37, indicating that the EORTC-CF was a reasonable anchor. The correlation between the categorized change in the secondary an-chor, the FACT-G, and the change in the FACT-Cog was 0.44 for T2 and 0.47for T3. While this correlation is reasonable, the lower value in comparison to the EORTC-CF indicates that more confidence should be placed on the primary anchor (in addition to the EORTC-CF measuring the same concept, cognition).
CID estimates for the 33-item total score were 11.3 and 8.8 for the primary anchor at T2 and T3 (Table3).
These values correspond to standardized effect sizes of approximately 0.5 and 0.4 SD, and 8.6 and 6.6% of the possible range of the scale. The average of these two values is 10.0 (standardized effect size 0.42, 7.6% of the total scale). CID estimates using the FACT-G were 9.9 (T2) and 6.1 (T3). SeeAppendix. Estimates using distri-bution criteria are shown in Table 4. Estimates range from 7.7 (1/3 SD at baseline) to 13.2 (1/2 SD at T2). Sensitivity analysis using multiply imputed data gave CID estimates of 10.8 at T2, and 8.1 at T3, which are similar to the primary results. Lower limits of the MCT using the SEM ranged from 11.8 to 14.4.
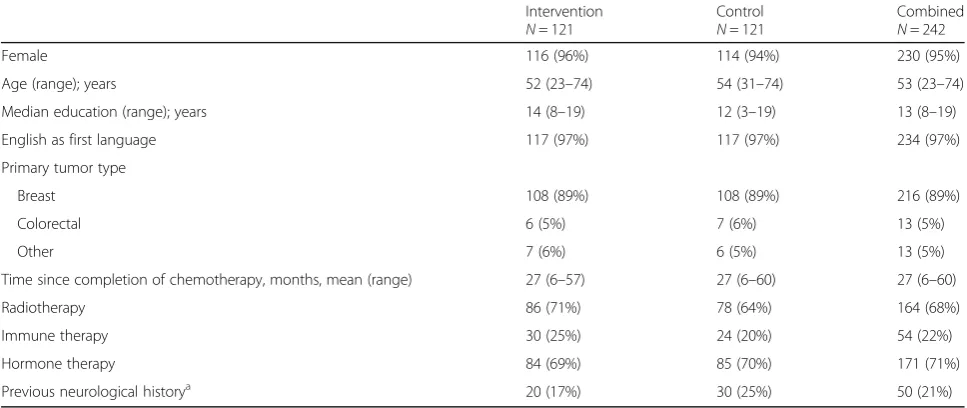
The CID estimates for the 37-item FACT-Cog total score were 12.0 and 10.4 using the primary anchor, at T2 and T3 respectively (standardized effect size = 0.46 Table 1Participant characteristics of a randomized controlled trial evaluating a web-based intervention for improving self-reported cognitive functioning in adult cancer survivors
Intervention N= 121
Control N= 121
Combined N= 242
Female 116 (96%) 114 (94%) 230 (95%)
Age (range); years 52 (23–74) 54 (31–74) 53 (23–74)
Median education (range); years 14 (8–19) 12 (3–19) 13 (8–19)
English as first language 117 (97%) 117 (97%) 234 (97%)
Primary tumor type
Breast 108 (89%) 108 (89%) 216 (89%)
Colorectal 6 (5%) 7 (6%) 13 (5%)
Other 7 (6%) 6 (5%) 13 (5%)
Time since completion of chemotherapy, months, mean (range) 27 (6–57) 27 (6–60) 27 (6–60)
Radiotherapy 86 (71%) 78 (64%) 164 (68%)
Immune therapy 30 (25%) 24 (20%) 54 (22%)
Hormone therapy 84 (69%) 85 (70%) 171 (71%)
Previous neurological historya
20 (17%) 30 (25%) 50 (21%)
a
Defined as: held back a grade in school; required remedial help at school; diagnosed with a learning disability; head injury with loss of consciousness with residual sequelae; history of seizures, dementia, coma, epilepsy, cardiac arrest requiring cardiopulmonary resuscitation, stroke; history of other neurological risk; or history of significant alcohol abuse
Table 2Means and SDs for each of the FACT-Cog subscales and total scores, at each of the time points, by treatment arm
Instrument/ Subscalea T1: Baseline T2: Post-intervention T3: Six-months
Intervention N= 121
Control N= 121
Intervention N= 94
Control N= 98
Intervention N= 95
Control N= 89
EORTC-CF 41.5 (8.8) 39.1 (16.9) 67.9 (22.8) 58.3(19.2) 68.6 (22.4) 60.4 (20.6)
FACT-G 76.5 (15.3) 77.1 (14.1) 83.5 (14.0) 82.1 (13.3) 84.2 (14.4) 80.2 (14.2)
FACT-Cog-PCI 38.6 (14.3) 41.9 (15.1) 23.2 (15.5) 33.5(16.1) 23.4 (14.6) 32.6 (16.5)
FACT-Cog-QoL 7.5 (4.2) 7.7 (4.4) 4.2 (4.3) 5.7 (4.2) 4.3 (4.3) 5.7 (4.3)
FACT-Cog-Oth 3.0 (3.6) 3.3 (3.7) 1.5 (2.0) 2.5 (2.79) 1.8 (3.1) 2.5 (2.8)
FACT-Cog-PCA 12.0 (5.0) 12.5 (5.6) 17.2 (5.8) 14.1 (5.5) 16.9 (6.0) 14.1 (5.5)
FACT-Cog-Total (33 items) 78.8 (22.5) 75.6 (23.7) 104.3 (25.1) 88.3 (25.2) 103.5 (25.0) 89.3(25.8)
FACT-Cog-Total (37 items) 85.6 (25.5) 81.5 (26.7) 114.2 (27.7) 95.6 (28.7) 113.4 (28.6) 97.0 (29.2)
a
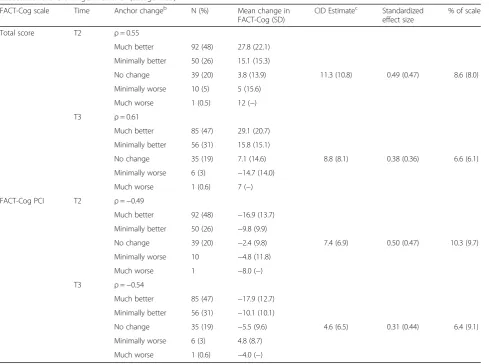
Table 3Anchor-based MCT estimates for improvement for the FACT-Cog total score (33 item) and FACT-Cog-PCI based on changes from baseline at post-intervention (T2) and six month follow-up (T3) using the primary anchor EORTC-CF. Results from sensitivity analysis shown in parenthesis in the last three columnsa. Correlations,ρ, are for the change in the FACT-Cog total score or PCI subscale and the change in anchor (categorized)
FACT-Cog scale Time Anchor changeb N (%) Mean change in
FACT-Cog (SD)
CID Estimatec Standardized
effect size
% of scale
Total score T2 ρ= 0.55
Much better 92 (48) 27.8 (22.1)
Minimally better 50 (26) 15.1 (15.3)
No change 39 (20) 3.8 (13.9) 11.3 (10.8) 0.49 (0.47) 8.6 (8.0)
Minimally worse 10 (5) 5 (15.6)
Much worse 1 (0.5) 12 (−)
T3 ρ= 0.61
Much better 85 (47) 29.1 (20.7)
Minimally better 56 (31) 15.8 (15.1)
No change 35 (19) 7.1 (14.6) 8.8 (8.1) 0.38 (0.36) 6.6 (6.1)
Minimally worse 6 (3) −14.7 (14.0)
Much worse 1 (0.6) 7 (−)
FACT-Cog PCI T2 ρ=−0.49
Much better 92 (48) −16.9 (13.7)
Minimally better 50 (26) −9.8 (9.9)
No change 39 (20) −2.4 (9.8) 7.4 (6.9) 0.50 (0.47) 10.3 (9.7)
Minimally worse 10 −4.8 (11.8)
Much worse 1 −8.0 (−)
T3 ρ=−0.54
Much better 85 (47) −17.9 (12.7)
Minimally better 56 (31) −10.1 (10.1)
No change 35 (19) −5.5 (9.6) 4.6 (6.5) 0.31 (0.44) 6.4 (9.1)
Minimally worse 6 (3) 4.8 (8.7)
Much worse 1 (0.6) −4.0 (−)
a
Sensitivity analysis using 25 multiple imputed datasets
b
Change in EORTC-CF <−16.67 (much worse),−16.67 (minimally worse), 0 (no change), 16.67(minimally better), and > 16.67 (much better)
c
|Anchor min better–anchor no change| in mean change in FACT-Cog
Table 4Distribution-based CID (SD multiples) and MCT lower limit (SEM) estimates for the FACT-Cog total score and perceived cognitive impairments subscale
N SD One-third SD One-half SD 1 SEM,ρT-RT= 0.74 1 SEM,ρT-RT = 0.70
FACT-Cog score (33 items)
T1: Baseline 242 23.13 7.7 11.6 11.8 12.7
T2: Post-intervention 192 26.31 8.8 13.2 13.4 14.4
T3: Six-month follow-up 184 26.29 8.8 13.1 13.4 14.4
Mean 25.24 8.4 12.6 12.9 13.8
FACT-Cog PCI
T1: Baseline 242 14.77 4.9 7.7 7.5 8.1
T2: Post-intervention 192 16.61 5.5 8.8 8.4 9.1
T3: Six-month follow-up 184 16.17 5.4 8.8 8.2 8.9
Mean 15.85 5.3 7.9 8.1 8.7
and 0.40; 9.1 and 7.0% of the possible range of the total score). Using distribution methods (SD multi-ples), CID estimates ranged from 8.7 to 15.0. See Appendix.
Perceived cognitive impairments subscale CID
Change over time for the PCI subscale score correlated well with the change in categorized EORTC-CF; the correlations were .0–.49 and−0.54, indicating that the anchor was reasonable. Similar to the total score, the magnitude of the correlation with the change in the secondary anchor, FACT-G, was lower, at −0.34 and−0.38. Primary anchor based CID estimates for the PCI subscale were 7.4 (T2) and 4.6 (T3), (0.5 and 0.3 SD, 10.3 and 6.4% of the subscale). Sensitivity estimates were similar. Distribu-tion based estimates ranged from 4.9 to 8.8. See Tables 3 and 4.
Investigation into MCTs
Figure 1 shows the empirical CDF curves for the change in FACT-Cog stratified by time and the
EORTC-CF anchor changes of none, minimally better and much better. These curves show a range of pos-sible MCTs (vertical lines) that could be used for de-fining responders, as well as no change for reference. These thresholds were rounded averages over T2 and T3 and were: 14 = standard error of measurement (for
ρT-RT= 0.70); and 23 = the difference in the mean value of the change in FACT-Cog for those in the anchor category of “much better” and “same”. The curves be-tween categories are well-separated, and the curves within categories are similar. The table within the graph shows the percentage of participants who chan-ged by at least a given amountFor example, changes of at least 14 points were experienced by 23% (T2) and 25% (T3) of participants in the “same” anchor cat-egory; 38% (T2) and 48% (T3) in the “min better” cat-egory; and 68% (T2) and 73% (T3) in the “much better”category.
Discussion
We estimated clinically important differences in the 33-item FACT-Cog total score and the perceived
cognitive impairments subscale using data from 242 cancer survivors, in an RCT that evaluated a web-based cognitive training program. Estimates for the total score ranged from 6.1 to 13.2 points. The mean of the T2 and T3 anchor-based estimate using our primary anchor, the EORTC-CF, was 10.0 points, corresponding to a standardized effect size of 0.42, which is 7.6% of the total scale. CID estimates for the FACT-Cog PCI subscale ranged from 3.1 to 8.8. The mean of the T2 and T3 anchor-based estimate using our primary anchor was 5.9 points, corresponding to a standardized effect size of 0.40, which is 8.4% of the PCI subscale total.
The standardized effect sizes of our anchor based CID estimates ranged from about 0.21 to 0.47. This is consistent with many other estimated PRO CIDs [32], and corresponds to a small (0.2) to medium (0.5) ef-fect size [33]. We aimed to compare our estimates to Cheung et al. by following their methods and using the same anchor to increase comparability. They esti-mated the CID for deterioration in the 37-item total score at 9.6 points, with all estimates ranging from 6.9 to 10.6 points (4.7–7.2% of the total score). Our CID estimate for improvement in the 37-item score ranged from 8.7 to 15.0 (5.9–10.1% of the total score). Our study adds considerably to their findings, as only 13% of their participants reported improve-ment, as compared to 46% in our study.
When designing studies, researchers should under-take power and sample size calculations that use a target difference that is both important and realistic [34]. In this paper we estimated CIDs, which address the issue of importance. Pilot studies, review of evi-dence and seeking the opinions of experts and stake-holders can give an idea about whether the specified difference is realistic [34].The range of estimates for the CID can also be used to perform sensitivity ana-lyses for their sample size calculations, as demon-strated in reference [35].
We also explored individual change thresholds using cumulative distribution functions. The largest MCT can-didate, 23 points change, separated the anchor change categories well and was consistent between time points. The value of 14 was not as consistent between time points and did not show as much separation between categories. However, any choice of MCT to define a re-sponder must consider false positives (more likely with lower MCT) and false negatives (more likely with a higher MCT).
The CID estimates were consistently smaller for T3 (six-month follow-up) as compared to T2 (post-inter-vention, approximately 15 weeks), which can also be seen in the CDF curves. There is no clear reason for this. The response rate was similar between the two time
points. Researchers should consider what the most ap-propriate CID is for their study based on their primary outcome and its timing.
Study limitations
A limitation of this study was that due to the nature of the intervention the original RCT was not blinded, and this may have affected patients’ self–reported assess-ments of their cognition [36]. Also, a clinical anchor that is simple and easy to interpret would be ideal [5], but this was not possible as there were no clinical assess-ments in this internet-based study. We believe that while the 2-item EORTC-CF score is not immediately inter-pretable, the mapping of the possible change scores was reasonable, has been used before [13] and had correl-ation well above the benchmark for anchors. Further-more, we included a second anchor, the FACT-G, which is widely used and has been well studied with regard to important change estimation. The EORTC-CF had low internal consistency at baseline, with Cronbach’s alpha = 0.29, but it increased dramatically to 0.73 and 0.69 at the follow-up times when CIDs and MCTs are assessed. Low alpha values can occur when there are few items and/or when an item’s observed range is small, and no one at baseline responded that they had no difficulty re-membering things (item 2 of the EORTC-CF). The FACT-G also had relatively low Cronbach’s alpha, des-pite it having 27 items. This may be due to the hetero-geneity of the sample due to variation in time since chemotherapy, which ranged from 6 to 60 months. Our sample was comprised of mostly breast cancer survivors, it is possible that important differences and changes vary by cancer type and/or sex. A strength of this study cluded estimating the CID using several methods, in-cluding a sensitivity analysis using multiple imputation. A further strength is the high correlation between the primary anchor and the FACT-Cog.
It is useful to investigate both differences and changes for the same measure, so that readers can distinguish es-timation methods and uses for both. Important differ-ences for groups, can be used to design studies, by powering on the CID. ECDFs and MCTs are useful in interpretation of how interventions affect individuals.
Conclusions
Appendix
Table 5Anchor-based CID estimates for improvement for the FACT-Cog total score (33 item) and FACT-Cog-PCI based on changes from baseline at post-intervention (T2) and six month follow-up (T3) andsecondary anchor FACT-G. Correlations,ρ, are for the change in the FACT-Cog total score or PCI subscale and the categorized anchor changes
FACT-Cog scale Time, Anchor Anchor changea N (%) Mean change in
FACT-Cog (SD)
MCT Estimateb Standardized effect size
% of scale
Total score T2, FACT-G ρ= 0.44
Much better 73 (38) 28.7 (22.5)
Minimally better 27 (14) 18.5 (21.1) 9.9 (9.1) 0.43 (0.40) 7.5 (6.9)
No change 43 (22) 8.6 (12.4)
Minimally worse 26 (14) 6.9 (17.0)
Much worse 13 (7) 12.9 (17.2)
T3, FACT-G ρ= 0 0.47
Much better 57 (31) 30.7 (22.6)
Minimally better 35 (19) 21.2 (18.6) 6.1 (5.5) 0.42 (0.24) 4.7 (4.1)
No change 38 (21) 15.1 (14.5)
Minimally worse 22 (13) 10.8 (18.0)
Much worse 20 (12) 5.6 (20.4)
FACT-Cog PCI T2, FACT-G ρ=−0.34
Much better 73 (38) −16.5 (14.8)
Minimally better 27 (14) −11.0 (14.5)
No change 43 (22) −5.3 (10.6) 6.3 (4.4) 0.32 (0.30) 6.6 (6.1)
Minimally worse 26 (14) −10.5 (10.6)
Much worse 13 (7) −18.0 (14.3)
T3, FACT-G ρ=−0.38
Much better 57 (31) −18.0 (14.4)
Minimally better 35 (19) −13.5 (11.7)
No change 38 (21) −10.4 (9.1) 3.1 (3.1) 0.21 (0.21) 4.4 (4.4)
Minimally worse 22 (13) −8.3 (12.1)
Much worse 20 (12) −5.1 (12.0)
a
Change in FACT-G <−7 (much worse),−7 to−4 (minimally worse),−3 to 3 (no change), 4 to 7 (minimally better), and > 7 (much better)
b
|Anchor min better–anchor no change| in mean change in FACT-Cog
Table 6Anchor-based CID estimates based on changes from post-intervention and six month follow-up for the37-itemFACT-Cog total score
EORTC change N (%) Mean change in FACT-Cog (SD) CID Estimatea Standardized effect size (% of scale)
T2:ρ = 0.58
Much better 92 (48) 31.3 (25.2)
Minimally better 50 (26) 16.5 (16.7)
No change 39 (20) 4.5 (15.9) 12.0 0.46 (9.1)
Minimally worse 10 (5) 4.6 (18.1)
Much worse 1 (0.5) 15 (−)
T3:ρ= 0.63
Much better 85 (47) 33.0 (23.8)
Minimally better 56 (31) 17.9 (17.0)
No change 35 (19) 7.5 (16.2) 10.4 0.40 (7.0)
Minimally worse 6 (3) −16.7(16.1)
Much worse 1 (0.6) 10 (−)
a
Abbreviations
CI:Confidence interval; CID: Clinical important difference; EORTC-CF: European Organization for Research and Treatment of Cancer Quality of Life-Cognitive Functioning Scale; FACT-Cog: Functional Assessment of Cancer Therapy Cognitive Function; FACT-G: Functional Assessment of Cancer Therapy General; MCT: Meaningful change threshold; MID: Minimal important difference; PRO: Patient reported outcomes; RCT: Randomized controlled trial; SD: Standard deviation; SEM: Standard error of measurement
Funding
The original study was supported by the Cancer Council New South Wales and The Friends of the Mater Foundation grants. Dr. Vardy is supported by the National Breast Cancer Foundation, Australia. Dr. Bell is supported by the University of Arizona Cancer Center, through NCI grant P30CA023074.
Availability of data and materials
These data are proprietary and are unable to be shared.
Authors’contributions
MB conceived this sub-study, analyzed the data, and wrote the first draft of the manuscript. HD, VB, and JV carried out the original study, provided the data, and reviewed drafts. All authors read and approved the final manuscript.
Ethics approval and consent to participate
The original study received ethical approval and all participants consented to participate.
Consent for publication
Not applicable.
Competing interests
The authors declare that they have no competing interests.
Publisher’s Note
Springer Nature remains neutral with regard to jurisdictional claims in published maps and institutional affiliations.
Author details
1Department of Epidemiology and Biostatistics, Mel and Enid Zuckerman
College of Public Health, University of Arizona, 1295 N Martin Ave, Tucson, AZ 85724, USA.2Psycho-Oncology Co-operative Research Group, School of
Psychology, University of Sydney, Sydney, NSW, Australia.3Centre for Medical Psychology & Evidence-based Decision-making, School of Psychology, University of Sydney, Sydney, NSW, Australia.4Department of Medical Oncology, Liverpool Hospital and University of Sydney, Sydney, NSW, Australia.5Concord Cancer Centre and Sydney Medical School, University of Sydney, Sydney, NSW, Australia.
Received: 4 August 2017 Accepted: 21 September 2018
References
1. Vardy, J., Wefel, J. S., Ahles, T., et al. (2008). Cancer and cancer-therapy related cognitive dysfunction: An international perspective from the Venice cognitive workshop.Annals of Oncology, 19, 623–629.
2. Wefel, J. S., Vardy, J., Ahles, T., & Schagen, S. B. (2011). International cognition and Cancer task force recommendations to harmonise studies of cognitive function in patients with cancer.The Lancet Oncology, 12, 703–708. 3. Coon, C. D., & Cappelleri, J. C. (2016). Interpreting change in scores on
patient-reported outcome instruments.Therapeutic Innovation & Regulatory Science, 50, 22–29.
4. Administration FaD. (2009). Guidance for industry on patient-reported outcome measures: Use in medical product development to support labeling claims. InFederal Register(pp. 65132–65133).
5. McLeod, L. D., Coon, C. D., Martin, S. A., et al. (2011). Interpreting patient-reported outcome results: US FDA guidance and emerging methods.Expert Rev Pharmacoecon Outcomes Res, 11, 163–169.
6. Coon, C. D., & Cook, K. F. (2018). Moving from significance to real-world meaning: Methods for interpreting change in clinical outcome assessment scores.Quality of Life Research, 27, 33–40.
7. Wyrwich, K., Norquist, J., Lenderking, W., et al. (2013). Methods for interpreting change over time in patient-reported outcome measures. Quality of Life Research, 22, 475–483.
8. Cappelleri, J. C., & Bushmakin, A. G. (2014). Interpretation of patient-reported outcomes.Statistical Methods in Medical Research, 23, 460–483.
9. Revicki, D., Hays, R. D., Cella, D., & Sloan, J. (2008). Recommended methods for determining responsiveness and minimally important differences for patient-reported outcomes.Journal of Clinical Epidemiology, 61, 102–109. 10. Hays, R., & Woolley, J. (2000). The concept of clinically meaningful difference
in health-related quality-of-life research. How meaningful is it? Pharmacoeconomics, 18, 419–423.
11. McLeod, L. D., Cappelleri, J. C., & Hays, R. D. (2016). Best (but oft-forgotten) practices: expressing and interpreting associations and effect sizes in clinical outcome assessments.The American Journal of Clinical Nutrition, 103, 685–693. 12. Wagner, L. S. J., Butt, Z., Lai, J., & Cella, D. (2009). Measuring patient
self-reported cognitive function: Development of the functional assessment of Cancer therapy–cognitive function instrument.Journal of Supportive Oncology, 7, W32–W39.
13. Cheung, Y. T., Foo, Y. L., Shwe, M., et al. (2014). Minimal clinically important difference (MCID) for the functional assessment of cancer therapy: Cognitive function (FACT-cog) in breast cancer patients.J Clin Epidemiol, 67, 811–820. 14. Bray, V. J., Dhillon, H. M., Bell, M. L., et al. (2017). Evaluation of a web-based
cognitive rehabilitation program in Cancer survivors reporting cognitive symptoms after chemotherapy.Journal of Clinical Oncology, 35, 217–225. 15. Cella, D., Hahn, E. A., & Dineen, K. (2002). Meaningful change in
cancer-specific quality of life scores: Differences between improvement and worsening.Quality of Life Research, 11, 207–221.
16. BrainHQ.com: Brain training that works.http://www.brainhq.com/?lead_id= bing-search-text-home-Brand_(US_CAN_UK_AUS_SAF_NZ)&utm_source= bing&utm_medium=cpc&utm_campaign=
Brand%20(US%2FCAN%2FUK%2FAUS%2FSAF%2FNZ%2FIN)&utm_term= brainhq.com&utm_content=BrainHQ.
17. Webster, K., Cella, D., & Yost, K. (2003). The functional assessment of chronic illness therapy (FACIT) measurement system: Properties, applications, and interpretation.Health and Quality of Life Outcomes, 1, 79.
18. Aaronson, N. K., Ahmedzai, S., Bergman, B., et al. (1993). The European Organization for Research and Treatment of Cancer QLQ-C30: a quality-of-life instrument for use in international clinical trials in oncology.Journal of The National Cancer Institute, 85, 365–376.
19. Luckett, T., King, M. T., Butow, P. N., et al. (2011). Choosing between the EORTC QLQ-C30 and FACT-G for measuring health-related quality of life in cancer clinical research: Issues, evidence and recommendations.Annals of Oncology, 22, 2179–2190.
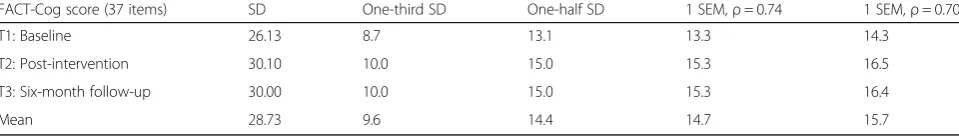
Table 7Distribution-based CID (SD multiples) and MCT lower limit (SEM) estimates for the 37-item FACT-Cog total score based on changes from post-intervention and six month follow-up
FACT-Cog score (37 items) SD One-third SD One-half SD 1 SEM,ρ= 0.74 1 SEM,ρ= 0.70
T1: Baseline 26.13 8.7 13.1 13.3 14.3
T2: Post-intervention 30.10 10.0 15.0 15.3 16.5
T3: Six-month follow-up 30.00 10.0 15.0 15.3 16.4
Mean 28.73 9.6 14.4 14.7 15.7
20. Fayers, P., Aaronson, N., Bjordal, K., et al. (2001).The EORTC QLQ-C30 scoring manual. European Organisation for Research and Treatment of Cancer: Brussels.
21. Cella, D. F., Tulsky, D. S., Gray, G., et al. (1993). The functional assessment of cancer therapy scale: Development and validation of the general measure. Journal of Clinical Oncology, 11, 570–579.
22. Revicki, D. A., Cella, D., Hays, R. D., et al. (2006). Responsiveness and minimal important differences for patient reported outcomes.Health and Quality of Life Outcomes, 4, 70.
23. Fayers, P. M., & Hays, R. D. (2014). Don’t middle your MIDs: regression to the mean shrinks estimates of minimally important differences.Quality of Life Research, 23, 1–4.
24. Yost, K. J., & Eton, D. T. (2005). Combining distribution- and anchor-based approaches to determine minimally important differences: the FACIT experience.Evaluation and the Health Professions, 28, 172–191. 25. Wyrwich, K. W., Tierney, W. M., & Wolinsky, F. D. (1999). Further evidence
supporting an SEM-based criterion for identifying meaningful intra-individual changes in health-related quality of life.Journal of Clinical Epidemiology, 52, 861–873.
26. Cheung, Y. T., Lim, S. R., Shwe, M., et al. (2013). Psychometric properties and measurement equivalence of the English and Chinese versions of the functional assessment of cancer therapy-cognitive in Asian patients with breast cancer.Value Health, 16, 1001–1013.
27. Bell, M. L., & Fairclough, D. L. (2014). Practical and statistical issues in missing data for longitudinal patient-reported outcomes.Statistical Methods in Medical Research, 23, 440–459.
28. Bell ML, Fairclough DL, King MT. Bias in area under the curve for longitudinal clinical trials with missing patient reported outcome data: summary measures versus summary statistics. 2014.
29. Bell, M. L., Fiero, M., Horton, N. J., & Hsu, C. H. (2014). Handling missing data in RCTs; a review of the top medical journals.BMC Medical Research Methodology, 14, 118.
30. Graham, J. W., Olchowski, A. E., & Gilreath, T. D. (2007). How many imputations are really needed? Some practical clarifications of multiple imputation theory.Prevention Science, 8, 206–213.
31. Rubin, D. B. (1987).Multiple imputation for nonresponse in surveys. New York: Wiley.
32. Norman, G. R., Sloan, J. A., & Wyrwich, K. W. (2004). The truly remarkable universality of half a standard deviation: Confirmation through another look. Expert Review of Pharmacoeconomics and Outcomes Research, 4, 581–585. 33. Cohen, J. (1988).Statistical power analysis for the behavioral sciences.
Hillsdale: Lawrence Earlbaum Associates.
34. Cook, J. A., Hislop, J., Altman, D. G., et al. (2015). Specifying the target difference in the primary outcome for a randomised controlled trial: guidance for researchers.Trials, 16, 1–7.
35. Bell, M. L., Whitehead, A. L., & Julious, S. A. (2018). Guidance for using pilot studies to inform the design of intervention trials with continuous outcomes.Clinical Epidemiology, 10, 153–157.