Vascular Health and Risk Management
O R I G I N A L R E S E A R C H
open access to scientific and medical research
Open Access Full Text Article
Dove
press
Blood flow interplays with elastin: collagen
and MMP: TIMP ratios to maintain healthy
vascular structure and function
Poulami Basu Utpal Sen Neetu Tyagi Suresh C Tyagi
Department of Physiology and Biophysics, University of Louisville School of Medicine, Louisville, Kentucky, USA
Correspondence: Suresh C Tyagi Department of Physiology and Biophysics, University of Louisville, School of Medicine, 500 South Preston Street, Louisville, KY-40202, USA
Tel +1 502 852 3381 Fax +1 502 852 6239 Email [email protected]
Abstract: Differential vascular remodeling is one of the major mechanisms of heterogeneity
in atherosclerosis. The structural and functional heterogeneity between arteries and veins determines the degree of vascular remodeling. Matrix metalloproteases (MMPs) and their tissue inhibitors (TIMPs) play key roles in vascular structural and functional remodeling. We hypothesized that the level of blood flow in different arteries and veins caused structural and functional heterogeneity that ultimately determined potential vascular remodeling. To test this hypothesis, in vivo blood flow and blood pressure in the aorta, carotid, femoral artery, and femoral vein was measured in male Sprague-Dawley rats (weight 380–400 gm). Arterial and venous pressures were measured by PE-50 catheter cannulation. Blood flow was mea-sured by a transonic ultrasound system. The aortic arch, femoral and carotid arteries, and abdominal vena cava were isolated to determine the expression of MMP-2, -9, -12, and -13 and TIMP-1, -3, and -4 by Western blot and in gelatin gel zymography. Masson trichrome and van Gieson stains were used to stain the histologic tissue sections. The results revealed that blood flow was higher in the aorta and carotid artery than the femoral artery and vein. MMP-9 and MMP-13 were higher in the carotid artery in comparison with the other blood vessels, while TIMP-3 showed higher expression in the aorta than the arteries. Further, the MMP-9 activity was significantly higher in the carotid artery than in the aorta and femoral artery. There was a higher degree of basement membrane collagen in the femoral artery and therefore a low elastin: collagen ratio, while in the carotid artery a higher level of elastin and, therefore, a high elastin: collagen ratio was found. The results suggested that medial thickness and elastin:collagen ratios had a threshold in blood flow in the range 0.6–2.5 mL/min, which increased robustly if blood flow increased to 2.7 mL/min. This pattern was inverted by the total MMP:TIMP ratio. We conclude that vascular remodeling is a function of rate of blood flow, which would in turn be determined by the amounts of MMPs and their inhibitors present. The study combined the endothelial and dynamic (blood flow/pressure) components that affect medial thickness and elastin: collagen ratios.
Keywords: vascular remodeling, atherosclerosis, passive stretch-tension relationship
Introduction
Collagen and elastin are two vital components of the blood vessel. Conduit arteries like the carotid and femoral artery and the aorta may undergo remodeling in response
to structural modifications in these proteins.1 Elastin comprises 90% of elastic arterial
fibers.2 Elastin enables many tissues in the body to resume their shape after stretching
or contracting. Many soluble tropoelastin proteins, the subunit of larger elastin aggregate, cross link to form elastin which is a large insoluble protein. Collagen is the most common protein in mammals (25% to 35% of whole body protein content).
Vascular Health and Risk Management downloaded from https://www.dovepress.com/ by 118.70.13.36 on 27-Aug-2020
For personal use only.
Number of times this article has been viewed
This article was published in the following Dove Press journal: Vascular Health and Risk Management
Basu et al Dovepress
It is a main protein of connective tissue. The tropocollagen or “collagen molecule” is a subunit of larger collagen aggregates. As the distance of the blood vessel from the heart increases, the number of vascular smooth muscle cells increase. However, the ratio of elastin and collagen tend
to decrease with increasing distance from the heart.3–6 In
comparison with collagen, elastin has a slow turnover ratio.7
Elastinolysis and collagenolysis play crucial roles in arterial
remodeling and diseases.8
One of the crucial underlying mechanisms for vascular remodeling is the function of matrix metalloproteinases
(MMPs) and tissue inhibitors of metalloproteinases (TIMPs).9–15
MMPs are zinc-dependent proteins that work as proteases and allow the degradation and restructuring of the extracellular
matrix collagens and elastin.16–24 Although MMP-2
(gelatinase-A, 72 kDa) and MMP-9 (gelatinase-B, 92 kDa) are found in the extracellular matrix of all vascular smooth muscle cells, MMP-2 is constitutive and MMP-9 is inducible. They work on substrates like collagen Type 4, elastin, and several other extracellular matrix (ECM) molecules. MMP-2 is mainly
localized in the thickened intima,1,25 and digests interstitial
collagen Types 1, 2, and 3.16,26 Both MMP-2 and MMP-9 show
structural similarity with fibronectin.27 MMP-2 is commonly
found and synthesized by many cells, especially by fibroblasts, keratinocytes, chondrocytes, endothelial cells, monocytes, and osteoblasts. MMP-9 can be activated by MMP-2 and is expressed in keratinocytes, monocytes, and pulmonary
alveo-lar macrophages.27 MMP-9 and -13 (collagenase-3) cleaves
interstitial collagens 1, 2, and 3 into its characteristic ¼ th and ¾ th fragments, and can also digest other ECM molecules and
soluble proteins.16 These two proteinases are mainly produced
during tumorogenesis and in some physiologic processes
associated with an accelerated change of the ECM.27
MMP-12 (macrophage metalloproteinase) is mainly synthesized by macrophages and works on substances like elastin Type 4
col-lagen, vitronectin, and fibronectin.27 Under normal conditions,
the activities of the MMPs are regulated by transcriptional
activation of pro-MMP precursor zymogens, by TIMPs,27 and
by the interaction with specific ECM components. Factors that regulate vessel remodeling, such as chronic changes in hemo-dynamics, vessel injury, inflammatory cytokines, and reactive
oxygen species are also known to regulate MMP activities.28
TIMP binds MMPs in a 1:1 stoichiometry, and plays a pivotal
role in balancing the action of MMPs.28 Four TIMPs have been
identified in vertebrates, and their expression is regulated
dur-ing development and tissue remodeldur-ing.29 The TIMP-MMP
complex is stable and irreversibly blocks the access of the substrate to the catalytic portion of the MMP. TIMPs also
function as growth factors in some cells.30 TIMP-1, a 23 kDa
mannose-rich glycoprotein is very stable. Glycosylation is not essential for the activity of this protein. TIMP-1 is sensitive to the serine proteases like trypsin, chymotrypsin, and elastase.
TIMP-1 inhibits MMP-13 and MMP-2.27 TIMP-3, a recently
discovered 30 kDa protein, inhibits activities of MMP-3, -7, -2, and -9. The structural homology of TIMP-3 with TIMP-1 and TIMP-2 is relatively weak. TIMP-4, a 23 kDa protein, works on MMP-9 and has a significant homology with
TIMP-2. Like TIMP-2, it can bind to pro-MMP-2.9,31 It is now
established that the MMPs are involved in hyperplasia of the intima and in weakening of atherosclerotic lesions leading
to their rupture.18,32
Although intimal thickening is a systemic process
involving most arteries,33 it was shown previously that
different arteries exhibit different risk factors for developing
atherosclerosis,26,34,35 but the causes behind this are still
unknown. The present study was undertaken to investigate the relationship between blood flow and blood pressure with vascular morphology, and MMP and TIMP expression in different blood vessels.
Materials and methods
Animals
Adult male Sprague-Dawley rats (380–400 gm) were obtained from Harlan Industries Inc., Indianapolis, and housed in the animal care facility of the University of Louisville. All animals were fed a regular rodent diet. At the end of the experiments, rats were deeply anesthetized with pentobarbital (Ovation Pharmaceutical Inc., Chicago, IL) and sacrificed to harvest the aortic arch, carotid artery, femoral artery, femoral vein, and vena cava. All animal procedures were in accordance with the National Institutes of Health guidelines for animal research and were approved by the Institutional Animal Care and Use Committee of the University of Louisville.
In vivo
blood pressure measurement
The rats were anesthetized by injection with 55 mg/kg pentobarbital. A small incision was made carefully in the throat area to isolate the carotid artery without damaging the nerve attached to the artery. The portion of the carotid artery proximal to the brain was tied with silk thread tightly, so that no blood could circulate towards the brain. Another silk thread was used to make a knot loosely at the part of the carotid artery proximal to the heart. A small incision was made between the two knots in the artery. Extreme care was taken to minimize damage to the endothelial layer of
Vascular Health and Risk Management downloaded from https://www.dovepress.com/ by 118.70.13.36 on 27-Aug-2020
Blood flow maintains healthy blood vessel structure
Dovepress
the vessels of interest. A similar procedure was followed to isolate the femoral artery and the femoral vein. In the case of the femoral vein, the distal part of the vein was tied loosely and the proximal part was tied tightly with the silk thread. A catheter was inserted into the artery towards the heart. The other end of the catheter was attached to the pressure
transducer. After catheterization, a heparin (100 µg/mL)
(USB Corporation, Cleveland, OH) flush was done. The same procedures were used for the catheterization of the femoral artery. In the femoral vein, the catheterization was done towards the distal part of the body. The distal part of the catheter was then attached to the PE-50 catheter cannulation instrument (Digi-Med, US) and blood pressure was measured. The equipment was calibrated using a stan-dard blood pressure meter in mmHg. The waveform of the blood pressure was recorded using DMSI-100 software.
In vivo blood flow measurement
A process similar to blood pressure measurement was used to measure the blood flow. A window was made in the throat area and in the joint of the proximal part of the hind leg and the torso to isolate the carotid artery and the femoral artery and vein, respectively, without damaging the nerves attached to the arteries. A transit time perivascular flow meter (Transonic System Inc, Ithaca, NY) was used to measure blood flow. A transonic flow probe 0.5PSB303 was used to measure blood flow from the carotid and femoral arteries and the femoral vein. The equipment was calibrated using a standard flow meter in mL/min. The waveform of the blood flow was recorded using DMSI-100 software.
Histologic tissue sectioning and staining
The carotid and femoral arteries and the aorta and vena cava were isolated from each animal. Extreme care was taken at the time of isolation to minimize tissue damage, especially any damage to the internal endothelial layer of the vascular wall. The tissues were cleaned in heparin and phosphate-buffered saline (PBS) to get rid of any unwanted blood and viscera. The tissues were then cut into 1–2 mm pieces. The tissue pieces were placed vertically in freezing media [Triangle Biomedical Sciences, Inc., Durham, NC] and frozen in liquid nitrogen. Immediately after this step, thefrozen blocks with the molds were placed in a -70°C freezer.
After one hour, the block was placed on a block holder which was then placed inside the microtome machine. A series of
8 µm sections were cut and put on glass slides. The slides were
then kept inside a -20°C freezer for storage. Before staining,
the slides were kept for one hour at room temperature. For
staining the tissue sections, a Masson trichrome staining kit, van Gieson’s staining kit and the hematoxylin and eosin frozen section staining kit (Richard Allen Scientific, Kalamazoo, MI) were used. Tissue sections were stained according to the protocols provided with the staining kits.
Western blotting technique
Samples of isolated carotid artery, femoral artery, and aortic arch and vena cava were taken from the anesthetized rats. RadioImmuno Precipitation Assay (RIPA, Thermo Scientific Inc., Rockford, IL) buffer was used for protein extraction. A bicinchoninic acid (BCA) assay was used for
protein estimation; 35 µg total protein was loaded in each
well of 8% sodium dodecyl sulphate polyacrylamide gel electrophoresis (SDS-PAGE) gels for detecting MMPs and in 12% SDS-PAGE gels for detecting TIMP expression. After overnight transfer at 100 milliamps, the membranes were blocked in 5% milk for one hour for TIMP detection or in 3% bovine serum albumin (BSA) for one hour in tris-buffered saline with Triton X100 (TBST) for MMP detection; 1:500 primary antibody concentrations were used for all protein detections. For MMP protein detection the antibodies were diluted with 3% BSA and for TIMP protein detection the antibodies were diluted with 5% milk in TBST. MMP-2 and MMP-9 antibodies were purchased from Abcam Antibodies, Cambridge, MA and MMP-13 and MMP-12 antibodies were purchased from Santa Cruz Biotechnology, Santa Cruz, CA. TIMP-1 was purchased from R and D Sys-tems, Minneapolis, MN. TIMP-3 was obtained from Affinity Bio Reagents, Golden, CO and TIMP-4 was purchased from Millipore, Billerica, CA. All the secondary antibodies were bought from Santa Cruz Biotechnology. Following overnight
incubation at 4°C with shaking, the membrane was washed
six times for 10 minutes each with TBST. HRP-conjugated mouse for MMP-2, TIMP-1 and rabbit secondary antibody for MMP-9, -12 and -13 and TIMP-4, 1:3000 dilutions in 5% milk or in 3% BSA in TBST were used. Membranes were kept in secondary antibody for two hours at room temperature with shaking. After incubation in secondary antibody, the membranes were washed in TBST six times for 10 minutes each. An ECL plus Western blotting detection system (GE Health Care, Little Chalfont, Buckinghamshire) was used. After stripping with membrane-stripping buffer (Boston BioProducts, Worcester, MA) membranes were
reprobed with β-actin (Sigma, St. Louis, MO) to verify
protein loading and to normalize reported data. β-actin
anti-body was used in 1:5000 concentrations. A mouse secondary antibody at 1:6000 dilution was used.
Vascular Health and Risk Management downloaded from https://www.dovepress.com/ by 118.70.13.36 on 27-Aug-2020
Basu et al Dovepress
Densitometric data analysis
Densitometric data were collected by scanning the Western blot bands depicting the proteins of interest and were
normalized by dividing the data with β-actin densitometric
data (U-Scanit Software). Graphs were plotted using the normalized data of interest.
In gel gelatin zymography
As described by Sen et al36 gelatin zymography was performed
using 1.5% gelatin. Aorta, femoral and carotid artery, and vena cava tissues from rats were used for this purpose. RIPA buffer was used for protein extraction. The BCA assay was used for
protein estimation; 56 µg of the protein was
electrophoreti-cally resolved for each sample in 8% SDS-PAGE containing 1.5% gelatin as the MMP substrate. Gels were washed in 2.5% TBST for 30 minutes to remove SDS, rinsed in water, and incubated for at least 24 hours in activation buffer (50 mmol/L
tris-HCl, 5 mmol/L CaCl2, and 0.02% NaN3, pH 7.5) at 37°C
in a water bath with gentle shaking. Gels were then transferred to staining solution (acetic acid:methanol:water; 10:50:40, respectively) containing 0.5% Coomassie blue for one hour at room temperature. MMP activity in the gel was detected in a dark blue background with white bands.
Measurement of elastin and collagen
intensity and blood vessel wall width
Blood vessels stained with Masson trichrome, van Gieson, or hematoxylin eosin stain were used. Pictures were taken by a camera attached to a Fluoview 1000 Olympus confocal microscope, and Qcapture software was used. All pictureswere taken at 10 × magnification and were saved in JPEG
format. In order to measure intensity of collagen and elastin staining of blood vessels, densitometric data were collected by using the same procedure as Western blot densitometry. Elastin:collagen ratio was calculated by dividing the densitometric data of elastin by the same data for collagen. Graphs were plotted using the data. Blood vessel widths were also measured by placing a scale on the photograph of hematoxylin eosin-stained vessels. Measurements were taken in centimeter scale, and were converted to a micron scale.
Passive stretch-tension relationship study
The aorta, carotid and femoral artery and the vena cava were isolated from the rat to measure the passive stretch–tension relationship. The blood vessels were placed in ice cold physiological salt solution (PSS, 118 mM NaCl, 4.7 mMKCl, 2.5 mM CaCl2, 1.2 mM KH2 PO4, 1.2 mM MgSO4,
12.5 mM NaHCO3 and 11.1 mM glucose, pH 7.4). The
solution was continuously aerated with 20% O2, 5% CO2,
and 75% N2. Fat tissues and connective tissues were removed
and the blood vessels were cut into 4 mm pieces for further study. The blood vessel rings were mounted with two tung-sten wires of the same diameter which were attached to the myobath and were placed in a 25 mL organ bath filled with
PSS at 37°C. The whole system was constantly aerated with
O2:CO2, 95%:5%, respectively. Rings were stretched
gradu-ally to obtain the optimal resting tensions, which were 2 g for the aorta, 0.2 g for the femoral artery, and 0.1 g for the vena cava, and were calibrated for a minimum of an hour. After calibration, the passive-stretch tension relationship was obtained by increasing the stretch 1mm at each time. The resulting increase in tension (gm) was recorded graphically by using the mp100 software.
Statistical analysis
Each experiment was carried out using 3–6 specimens in each group. ANOVA was used to determine significance between
groups; P 0.05 was considered significant. Values are
means ± standard error of measurement (SE).
Results
Blood pressure and blood flow
Mean arterial pressure (MAP) in the carotid artery was
139 ± 9 mmHg and average systolic and diastolic pressures
were 157 ± 6 mmHg and 119 ± 4 mmHg, respectively.
Average MAP in the femoral artery was 121 ± 6 mmHg.
Average systolic and diastolic pressures were 137 ± 7 mmHg
and 99 ± 5 mmHg, respectively. Average femoral vein mean
blood pressure was 43 ± 3 mmHg, and average systolic
and diastolic blood pressures were 53 ± 4 mmHg and
36 ± 6 mmHg, respectively. Average heart rate was measured
to be 300 ± 20 per minute in all rats. Although there was
a tendency towards an increase in carotid blood pressure and a decrease in femoral artery blood pressure, it was not statistically significant (Figure 1).
Average carotid artery blood flow was 2.5 ± 0.3 mL/min
compared with aortic blood flow (2.7 ± 0.2 mL/min).
Average blood flow in the femoral artery was 0.86 ±
0.1 mL/min, whereas average blood flow in the femoral vein
was 0.19 ± 0.02 mL/min. The blood flow was significantly
lower in the femoral artery and femoral vein than in the carotid artery (Figure 1B).
Vascular structure and function
The width of the blood vessel wall was measured by a digital
micrometer. Aortic medial thickness was 1.6 µm ± 0.1,
Vascular Health and Risk Management downloaded from https://www.dovepress.com/ by 118.70.13.36 on 27-Aug-2020
Blood flow maintains healthy blood vessel structure
Dovepress
carotid artery thickness was 0.95 µm ± 0.15, and femoral
artery thickness was 0.6 µm ± 0.03 (Figures 2A and B).
Blood flow and medial thickness of blood vessels showed a flow-structure relationship. Blood vessels with high blood flow consistently showed a higher medial thickness in com-parison with blood vessels with low blood flow. Interestingly, the results suggested that a large change in blood flow from femoral artery to carotid artery caused a small increase in medial thickness; however, a small increase in blood flow from carotid artery to aorta caused significantly higher medial thickness (Figure 2C), suggesting a threshold relationship in blood flow and medial thickness.
Elastin:collagen ratio
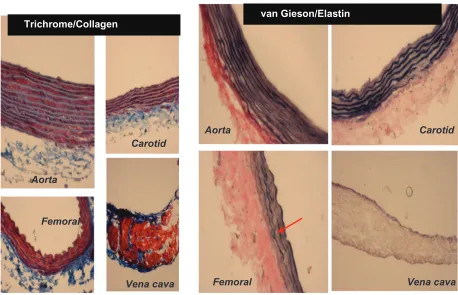
Because elastin and collagen are the primary determinants of vascular medial thickness, we measured the elastin and collagen ratio. Trichrome blue staining of the arteries and
veins revealed expression of collagen in the vein femoral
artery carotid artery aorta (Figure 3A). Conversely,
van Gieson staining showed higher levels of elastin in the aorta and carotid artery than in the femoral artery and in the
vena cava, as shown by the blackish-brown color staining (Figure 3A). Interestingly, the femoral artery showed an irregular and broken elastin structure (Figure 3A, arrow).
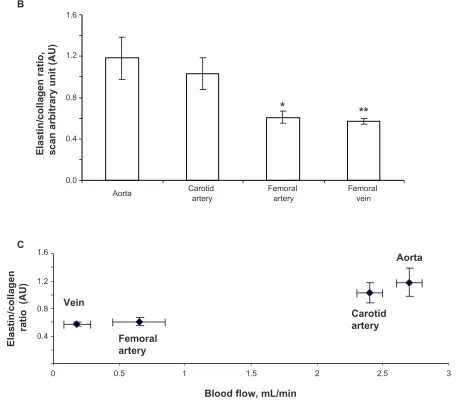
The elastin:collagen ratio in the aorta was 1.18 ± .02; in
the carotid artery the ratio was 1.03 ± 0.4, whereas in the
femoral artery and vena cava it was 0.61 ± 0.1 and 0.57 ±
0.1, respectively (Figure 3B). Blood vessels with high blood flow always showed a higher elastin:collagen ratio in comparison with blood vessels with low blood flow. Interestingly, the results suggested that a large change in blood flow from the femoral vein, artery to carotid artery caused a small increase in the elastin:collagen ratio. How-ever, a small increase in blood flow from carotid artery to aorta caused a significantly higher elastin:collagen ratio (Figure 3C), suggesting a threshold relationship in blood flow and elastin:collagen ratio (a hallmark of vascular structural remodeling).
MMPs
Because vascular remodeling implies changes in vascular structure (ie, elastin:collagen ratio) and MMP specifically
B
Systolic
Diastolic
Blood pressure
Blood flow
A
C
0.0 1.0 2.0 3.0
Carotid
artery Femoral artery Femoral vein
ml/min
**
*
Carotid artery
0 80 160
Sys Dia Sys Dia
Femoral artery
mm/Hg
Figure 1 Arterial blood pressure and blood flow. A)A typical femoral arterial wave showing systolic and diastolic peaks. A PE-50 catheter was inserted into femoral artery.
B) Bar graphs showed the systolic (sys) and diastolic (dia) blood pressure, measured in the carotid and femoral arteries. C) Bar graphs showed blood flow in different
vascular beds.
Notes: Datarepresents mean ± SE, n = 5. * and ** indicate P 0.05 versus carotid artery.
Vascular Health and Risk Management downloaded from https://www.dovepress.com/ by 118.70.13.36 on 27-Aug-2020
Basu et al Dovepress
H & E
van Gieson/Elastin
Trichome/Collagen
Figure 2A Different staining of femoral artery. Hematoxylin and eosin (H and E) staining was used to determine the general morphology of the blood vessels; the pinkish part represents the cytoplasm and the blue spots show the presence of nucleus in the artery wall. Masson trichrome staining was used for determination of collagen in tissue; the blue staining at the tunica adventitia represents the presence of collagen in the blood vessel; van Gieson staining was used to determine the presence of elastin in tissues; the blackish-brown staining in the tunica intima shows the presence of elastin in the artery.
Femoralartery 0.0
0.6 1.2 1.8
Aorta
Carotidartery
*
**
Media,
µ
m
×
10
−
2
Figure 2B Hematoxylin and eosin staining of different arteries. H and E staining of different arteries was done to determine the structural differences between the arteries. The aorta showed the highest medial thickness and the femoral artery showed lowest medial thickness when compared with the other two arteries. The bar graphs represent the differential medial thickness of the arteries.
Notes: Datarepresent mean ± SE, n = 5; * and ** indicates P 0.05 versus aorta.
Vascular Health and Risk Management downloaded from https://www.dovepress.com/ by 118.70.13.36 on 27-Aug-2020
Blood flow maintains healthy blood vessel structure
Dovepress
0 0.2 0.4 0.6 0.8 1.0 1.2 1.4 1.6 1.8
0.5 1 1.5 2 2.5 3
Blood flow, mL/min
Media thickness,
µ
m
×
10
−
2
Femoral artery
Carotid artery
Aorta
Figure 2C Correlation between medial thickness and blood flow. Aorta has highest medial thickness and highest blood flow compared with the other two vessels.
Note: Datarepresent ± SE, n = 5.
Carotid Trichrome/Collagen
Aorta
Femoral
Vena cava
Aorta Carotid
Femoral Vena cava
van Gieson/Elastin
Figure 3 A) Masson trichrome blue staining. The blue color represents collagen. The aorta and carotid artery showed minimum levels of collagen expression, whereas a higher level of collagen was present in the femoral artery and in the vena cava. Van Gieson staining was used to stain different blood vessels to determine the presence of elastin, which is represented by the blackish-brown color. The aorta and carotid artery showed higher levels of elastin in comparison with the femoral artery and the vena cava. The red arrow indicates the broken structure of the elastin tissue; the underlying cause of this could be the higher level of expression of the MMP-9 protein (an elastinase) in the femoral artery in comparison with the other blood vessels.
Vascular Health and Risk Management downloaded from https://www.dovepress.com/ by 118.70.13.36 on 27-Aug-2020
Basu et al Dovepress
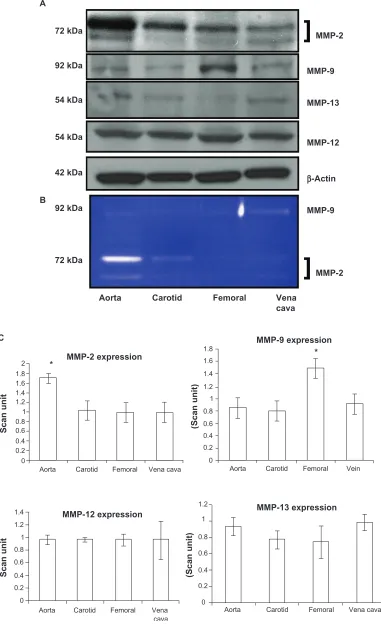
regulates vascular remodeling, we measured MMP levels. MMP-9 had a significantly higher expression in the femoral
artery (P = 0.01). Interestingly, this was correlated with
elastin fragments in the femoral artery (Figure 3A, arrow). MMP-12 had the same level of expression in all blood vessels without any significant change in expression. MMP-13 also did not show any differential expression
in the blood vessels (P = 0.07 and P = 0.14 indicated no
statistically significant difference between the groups in
MMP-12 and MMP-13, respectively, n = 4). MMP-2 showed
high expression in the aorta, whereas it showed a low expres-sion in the carotid and femoral arteries (Figure 4A and C) which was similar to the results found by zymography (Figure 4B). As revealed from the zymography study, MMP-2 activity was more pronounced in aorta tissue and
in the carotid artery, in both pro- (upper band) and active (lower band) forms, whereas MMP-2 activity in both forms was found to have a low level of expression in the femoral arterial and vena cava tissues.
TIMPs
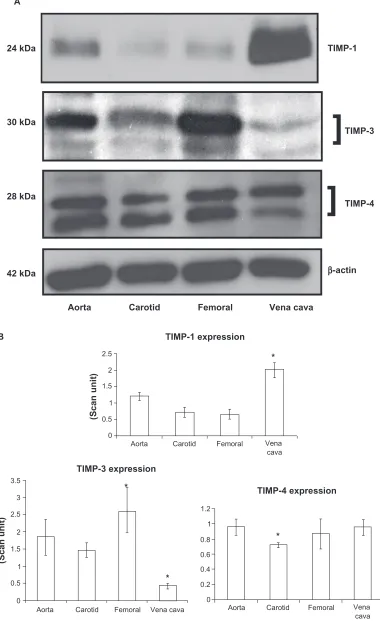
TIMP-3 was found to be significantly high in the femoral artery, while in the carotid artery and vein the protein was
found to have significantly lower expression (P = 0.03,
Figures 5A and B). TIMP-4 expressions in the carotid artery showed significantly lower expression compared with other
vessels (P = 0.03). Protein bands showed both glycosylated
(higher molecular weight protein band) and nonglycosylated (lower molecular weight protein band) forms of TIMP-3 and TIMP-4 (Figures 5A and 5B).
Elastin/collagen ratio, scan arbitrary unit (AU)
0.4 0.8 1.2 1.6
0 0.5 1 1.5 2 2.5 3
Elastin/collagen
ratio (AU)
Blood flow, mL/min 0.0
0.4 0.8 1.2 1.6
Aorta Femoral artery Femoral vein
*
**
B
C
Vein
Carotid artery Femoral
artery
Aorta
Carotid artery
Figure 3 B) Elastin:collagen ratio. C) Blood flow in relation to elastin:collagen ratio. Data show the femoral artery and vein has a low elastin:collagen ratio when compared with the other blood vessels, and the elastin:collagen ratio increases with increase in blood flow.
Notes: Datarepresent mean ± SE, n = 5; * and ** indicates P 0.05 versus aorta.
Vascular Health and Risk Management downloaded from https://www.dovepress.com/ by 118.70.13.36 on 27-Aug-2020
Blood flow maintains healthy blood vessel structure
Dovepress
MMP-2 MMP-2
MMP-9
MMP-12
β-Actin MMP-13
Vena cava 92 kDa
72 kDa
54 kDa
54 kDa
92 kDa
72 kDa
MMP-9 42 kDa
A
B
Aorta Carotid Femoral
MMP-2 expression
MMP-9 expression
MMP-12 expression C
MMP-13 expression
Scan unit
Scan unit
(Scan unit)
(Scan unit)
*
* 2
1.8 1.6 1.4 1.2 1 0.8 0.6 0.4 0.2 0
1.8 1.6 1.4 1.2 1 0.8 0.6 0.4 0.2 0 Aorta Carotid Femoral Vena cava
Aorta Carotid Femoral Vena cava
Aorta Carotid Femoral Vena cava Aorta Carotid Femoral Vein
1.4 1.2 1 0.8 0.6 0.4 0.2 0
1.2 1
0.8 0.6 0.4 0.2 0
Figure 4 Differential expression A) activity B) and C) bar graphs of scanned intensity values of MMPs in different vascular beds. Western blot was performed to detect the MMP protein. The MMP-2 protein is expressed in a higher level in the aorta, whereas the MMP-9 protein is expressed in higher levels in the femoral artery, and the MMP-12
and MMP-13 protein not show any significant difference when compared with the other blood vessels.
Notes: Datarepresent mean ± SE, n = 5; * indicates P 0.05 versus aorta or femoral artery, respectively.
Vascular Health and Risk Management downloaded from https://www.dovepress.com/ by 118.70.13.36 on 27-Aug-2020
Basu et al Dovepress
Relationship between blood
flow and MMP:TIMP ratio
Because the MMP:TIMP ratio dictates vascular structural (elastin:collagen) remodeling, we investigated the relationship between blood flow and total MMP:TIMP ratio. Vessels with high blood flow showed a higher MMP-2 expression in comparison with vessels with low blood flow and vice versa. The correlation between blood flow and elastin:collagen ratio or medial thickness was reversed in relation to total MMP: TIMP ratio. Vessels with high blood flow always showed a lower total MMP:TIMP ratio in comparison with vessels with low blood flow. Interestingly, the results suggested that a small change in blood flow from femoral vein to femoral artery caused a large decrease in the total MMP:TIMP ratio; however, a further increase in blood flow from carotid artery to aorta did not significantly change the total MMP:TIMP ratio (Figure 5C), suggesting a threshold relationship in blood flow and total MMP:TIMP ratio. A small change in flow caused a large change in total MMP:TIMP ratio (a regulator of remodeling).
Vascular structure and function
relationship
The vascular passive length-tension relationship was measured by stretching the vessels and measuring the tension generated. The results revealed that veins developed higher tension to stretch than did arteries (Figure 6). Interestingly, veins had lower levels of elastin but higher levels of collagen than did arteries. These results demonstrated unequivocally that the higher the elastin content in the tissue, the higher the compliance in that tissue.
Discussion
We tested whether the gradient of blood flow in different arteries and veins caused structural and functional heterogeneity as demonstrated by the structure of the blood vessels. The comparative medial thickness of the aorta, carotid artery, and femoral artery showed that the aorta had the highest medial thickness, whereas the femoral artery had the lowest medial thickness in the experimental group. Blood flow was highest in the aorta and lowest in the femoral artery and femoral vein, which indicated a proportional relationship between blood flow and medial thickness of the vessel wall. An increase in blood flow was observed with an increase in medial thickness of blood vessels.
The elastin:collagen ratio, measured by expression of elastin and collagen in the aorta, carotid artery, and femoral
artery and vein showed a high ratio in the carotid artery and aorta, whereas the ratio was significantly lower in the femoral artery and vein. Also, the blood flow and elastin: collagen ratio shows a reciprocal relationship. A small increase in blood flow from vein to femoral artery causes a small increase in the elastin:collagen ratio, whereas in a high blood flow vessel like the carotid artery and aorta, a small change in blood flow can cause a significant increase in the elastin:collagen ratio. These results indicate that arteries near to the heart have a high blood flow and more elastin compliance. Therefore, the ratio of elastin and collagen tend to decrease with increasing distance from the heart. This
result is in accordance with previously reported findings.4–6
It is possible that these arteries have adapted to high pulsatile blood pressure by increasing their medial thickness and the elastin level in the arteries, which ultimately gives the artery a high level of compliance and stability.
MMP-2 expression was significantly higher in the aorta in comparison with the other arteries and veins in our study, in both active and pro- forms. This findings are in
accor-dance with those of Watts et al26 because MMP-2 degrades
collagen 1, 2, and 3, this may be a possible cause of the significantly higher elastin:collagen ratio in the aorta in comparison with the veins. This may contribute towards the low susceptibility of the aorta to developing atherosclerosis in
comparison with the femoral artery.35 MMP-9 was expressed
in high levels in the femoral artery, in comparison with the other arteries and veins of interest. Previous reports showed
that MMP-9 degrades elastin37 which can be a leading cause
of the femoral artery having a low elastin:collagen ratio. The high MMP-9 expression and the low elastin:collagen ratio may contribute towards the femoral artery being highly
prone to atherosclerosis.35 Also, the breakdown of elastin
by MMP-9 may cause discontinuous elastin structure in the femoral artery (Figure 3A, arrow).
TIMP-3 expression was significantly higher in the femoral artery in comparison with the carotid artery. TIMP-4 was expressed at high levels in the aorta and in the vena
cava, and this protein is known to inhibit MMP-9.9 High
expression of TIMP-4 in the aorta and vena cava may con-tribute to the low level of expression of MMP-9 in these tissues, as found in our study. High expression of TIMP-4 may contribute to lower MMP-9 expression in these ves-sels, which ultimately results in upregulation of elastin and a high elastin:collagen ratio in the aorta. Although the vena cava also has a high level of TIMP-4 in comparison with the other vessels studied, the reason for the lower amount of elastin expression in the vena cava and the low elastin:
Vascular Health and Risk Management downloaded from https://www.dovepress.com/ by 118.70.13.36 on 27-Aug-2020
Blood flow maintains healthy blood vessel structure
Dovepress
TIMP-3 30 kDa
28 kDa 24 kDa
42 kDa A
TIMP-1
β-actin TIMP-4
Aorta Carotid Femoral Vena cava
TIMP-1 expression
TIMP-4 expression TIMP-3 expression
B
(Scan unit)
(Scan unit)
*
*
* *
1.2 1 0.8 0.6 0.4 0.2 0
Aorta Carotid Femoral Vena cava
Aorta Carotid Femoral Vena cava Aorta Carotid Femoral Vena cava
2.5 2 1.5 1 0.5 0
1.5 1 2 2.5 3.5 3
0.5 0
Figure 5 Differential expression of TIMPs in vascular beds. A) Western blot analysis. B) Bar graphs of scanned intensity values. The TIMP-1 protein was detected at higher levels in the vena cava, whereas TIMP-3 was found at lower levels compared with other vessels. TIMP-4 was detected at lower levels in the carotid artery. The bar diagram shows densitometric analyses of TIMP protein.
Notes: Datarepresent mean ± SE, n = 5; * indicates P 0.05 vs. aorta.
Vascular Health and Risk Management downloaded from https://www.dovepress.com/ by 118.70.13.36 on 27-Aug-2020
Basu et al Dovepress
collagen ratio is not clearly understood. Other factors may play a role in the downregulation of elastin expression in the vena cava.
Blood flow, when compared with the total vascular MMP:TIMP ratio, showed that the vein had the least blood flow and highest total MMP:TIMP ratio of the studied blood vessels. With a small increase in blood flow, the total MMP:TIMP ratio falls dramatically in the femoral artery, but with a significant increase in blood flow in the
carotid artery and aorta, in comparison with the vein and femoral artery, the total MMP/TIMP ratio does not change significantly.
In the passive stretch-tension relationship, the vena cava showed the maximum response to stretch, because this vessel has the minimum elastin content and maximum amount of collagen, whereas the aorta showed the minimum response to that, as this blood vessel has the maximum amount of elastin and minimum amount of collagen of the arteries studied.
Figure 5 C) Relationship between MMP:TIMP ratio and the blood flow. In order to get the MMP:TIMP ratio, averaged scanned data of MMPs in each of the blood vessels was calculated and divided by the averaged scanned units of TIMPs from the blood vessel. MMP:TIMP ratio was plotted in the y axis and the blood flow was plotted in the x axis. The vena cava has the highest MMP:TIMP ratio and the lowest blood flow in comparison with the other blood vessels.
MMP/TIMP, ratio
Aorta
Blood flow, mL/min
Carotid artery Femoral artery
Vein
2.5 3.0 2.0
0.5 1.0 1.5
0.4
0.0 0.8 1.2
Tension g/g
Stretch, mm
0 5 10 15 20 25 30 35
Aorta
Femoral artery Vein
0.01 0.21 0.41 0.61 0.81 1.01 1.21
Figure 6 Passive stretch-tension relationship between different vascular beds. A stretch-tension relationship was obtained by increasing the stretch 0.001 mm at a time. The resulting tension was plotted in the y axis, and the stretch was plotted in the x axis. The vena cava showed the maximum response to the stretch, because this blood vessel has the minimum elastin and maximum amount of collagen, whereas the aorta showed the minimum response to that, because this blood vessel has the maximum amount of elastin and minimum amount of collagen among the studied arteries.
Vascular Health and Risk Management downloaded from https://www.dovepress.com/ by 118.70.13.36 on 27-Aug-2020
Blood flow maintains healthy blood vessel structure
Dovepress
This result is consistent with the notion that the greater the elastin content, the greater the vascular compliance.
Conclusion
Different vascular beds have differential susceptibility to
developing disease, in particular atherosclerosis.38,39 The
elastin:collagen ratio and the matrix metalloproteases play a crucial role in vascular remodeling and in the development of atherosclerosis. We hypothesized that the gradient of blood flow in different arteries and veins results in structural and functional heterogeneity that ultimately leads to vascular remodeling. Our results show that blood flow, along with the elastin:collagen ratio and medial vessel thickness, play a key role in triggering vascular remodeling. High blood flow and a high elastin:collagen ratio are inversely correlated with vascular remodeling. The total MMP:TIMP ratio is significant in maintaining normal blood vessel structure. The importance of our findings in terms of cardiovascular health are multifactorial in the sense that flow-mediated changes in vascular structure may dictate whether the vessel is prone to developing atheroma faster than other vessels. In addition, the physiologic and clinical importance of the elastin:collagen ratio and MMPs in vascular remodeling and the process of atherosclerosis can be pinpointed to the structure and matrix metabolomic level, and will have therapeutic ramifications for structural vascular disease.
Acknowledgments
Part of this study was supported by NIH grants HL-71010, HL-74185, HL-88012, and NS-51568. The authors report no conflict of interest in this work.
References
1. Greenwald SE. Ageing of the conduit arteries. J Pathol. 2007;211(2): 157–172.
2. Milewicz DM, Urban Z, Boyd C. Genetic disorders of the elastic fiber system. Matrix Biol. 2000;19(6):471–480.
3. Davies PF. Flow-mediated endothelial mechanotransduction. Physiol Rev. 1995;75(3):519–560.
4. Apter JT. Correlation of visco-elastic properties with microscopic structure of large arteries. IV. Thermal responses of collagen, elastin, smooth muscle, and intact arteries. Circ Res. 1996;21(6):901–918. 5. Harkness ML, Harkness RD, McDonald DA. The collagen and elastin
content of the arterial wall in the dog. Proc R Soc Lond B Biol Sci. 1957;146(925):541–551.
6. Looker T, Berry CL. The growth and development of the rat aorta. II. Changes in nucleic acid and scleroprotein content. J Anat. 1972;113(Pt 1):17–34.
7. Rucklidge GJ, Milne G, McGaw BA, Milne E, Robins SP. Turnover rates of different collagen types measured by isotope ratio mass spectrometery. Biochim Biophys Acta. 1992;11:1156–1157.
8. Tyagi SC, Simon SR. Regulation of neutrophil elastase activity by elastin-derived peptide. J Biol Chem. 1993;268(22):16513–16518.
9. Kumar M, Tyagi N, Moshai KS, et al. Homocysteine decreases blood flow to the brain due to vascular resistance in carotid artery. Neurochem Int. 2008;53(6–8):214–219.
10. Garcia-Moll X. Inflammatory and anti-inflammatory markers in acute coronary syndromes. Ready for use in the clinical setting? Rev Esp Cardiol. 2005;58(6):615–617.
11. Libby P, Lee RT. Matrix matters. Circulation. 2000;102(16): 1874–1876.
12. Naghavi M, Falk E, Hecht HS, et al. From vulnerable plaque to vulnerable patient–Part III: Executive summary of the Screening for Heart Attack Prevention and Education (SHAPE) Task Force report. Am J Cardiol. 2006;98(2A):2H–15H.
13. Tardif JC, Heinonen T, Orloff D, Lippy P. Vascular biomarkers and surrogates in cardiovascular disease. Circulation. 2006;113(25): 2936–2942.
14. Hanaoka M, Droma Y, Ota M, Katsuyama Y, Kubo K. Polymorphisms of human vascular endothelial growth factor gene in high-altitude pulmonary oedema susceptible subjects. Respirology. 2009;14(1): 46–52.
15. Ota R, Kutihara C, Tsou TL, et al. Roles of matrix metalloproteinases in flow-induced outward vascular remodeling. J Cereb Blood Flow Metab. 2009.
16. Nagase HR, Visse R, Murphy G. Structure and function of matrix metalloproteinases and TIMPs. Cardiovasc Res. 2006;69(3): 562–573.
17. Janssens S, Lijnen HR. What has been learned about the cardiovascular effects of matrix metalloproteinases from mouse models? Cardiovasc Res. 2006;69(3):585–594.
18. Bobik A, Tkachuk V. Metalloproteinases and plasminogen activators in vessel remodeling. Curr Hypertens Rep. 2003;5(6):466–472. 19. Bouvet C, Gilbert LA, Girardot D, de Bois D, Moreau P. Different
involvement of extracellular matrix components in small and large arteries during chronic NO synthase inhibition. Hypertension. 2005;45(3):432–437.
20. Chun TH, Sabeh F, Ota I, et al. MT1-MMP-dependent neovessel formation within the confines of the three-dimensional extracellular matrix. J Cell Biol. 2004;167(4):757–767.
21. Galli A, Svegliati-Baroni G, Ceni E, et al. Oxidative stress stimulates proliferation and invasiveness of hepatic stellate cells via a MMP2-mediated mechanism. Hepatology. 2005;41(5):1074–1084.
22. Hayden MR, Sowers JR,Tyagi SC. The central role of vascular extracellular matrix and basement membrane remodeling in metabolic syndrome and type 2 diabetes: The matrix preloaded. Cardiovasc Diabetol. 2005;4(1):9.
23. He JZ, Ho JJ, Gingerich S, Courtman DW, Marsden PA, Ward ME. Induction of matrix metalloproteinase-2 enhances systemic arterial contraction after hypoxia. Am J Physiol Heart Circ Physiol. 2007;292(1):H684–H693.
24. Lehoux S, Lemarie CA, Esposito B, Lijnen HR, Tedgui A. Pressure-induced matrix metalloproteinase-9 contributes to early hypertensive remodeling. Circulation. 2004;109(8):1041–1047.
25. Li Z, Froelich J, Galis ZS, Lakatta EG. Increased expression of matrix metalloproteinase-2 in the thickened intima of aged rats. Hypertension. 1999;33(1):116–123.
26. Watts SW, Rondelli C, Thalaki K, et al. Morphological and biochemical characterization of remodeling in aorta and vena cava of DOCA-salt hypertensive rats. Am J Physiol Heart Circ Physiol. 2007;292(5): H2438–H2448.
27. Beaudeux JL, Giral P, Bruckert E, Foglietti MJ, Chapman MJ. Matrix metalloproteinases, inflammation and atherosclerosis: therapeutic perspectives. Clin Chem Lab Med. 2004;42(2):121–131.
28. Raffetto JD, Khalil RA. Matrix metalloproteinases and their inhibitors in vascular remodeling and vascular disease. Biochem Pharmacol. 2008;75(2):346–359.
29. Brew KD, Dinakarpandian D, Nagase H. Tissue inhibitors of metalloproteinases: Evolution, structure and function. Biochim Biophys Acta. 2000;1477(1–2):67–83.
Vascular Health and Risk Management downloaded from https://www.dovepress.com/ by 118.70.13.36 on 27-Aug-2020
Vascular Health and Risk Management
Publish your work in this journal
Submit your manuscript here: http://www.dovepress.com/vascular-health-and-risk-management-journal Vascular Health and Risk Management is an international,
peer-reviewed journal of therapeutics and risk management, focusing on concise rapid reporting of clinical studies on the processes involved in the maintenance of vascular health; the monitoring, prevention and treatment of vascular disease and its sequelae; and the involvement of
metabolic disorders, particularly diabetes. This journal is indexed on PubMed Central and MedLine. The manuscript management system is completely online and includes a very quick and fair peer-review system, which is all easy to use. Visit http://www.dovepress.com/ testimonials.php to read real quotes from published authors.
Basu et al Dovepress
Dove
press
30. Hayakawa T, Yamashita K, Ohuchi E, Shinagawa A. Cell growth-promoting activity of tissue inhibitor of metalloproteinases-2 (TIMP-2). J Cell Sci. 1994;107(Pt 9):2373–2379.
31. Van Hinsbergh VW. Arteriosclerosis. Impairment of cellular interactions in the arterial wall. Ann N Y Acad Sci. 1992;673:321–330.
32. Jones CB, Sane DC, Herrington DM. Matrix metalloproteinases: A review of their structure and role in acute coronary syndrome. Cardiovasc Res. 2003;59(4):812–823.
33. Ross R. Atherosclerosis is an inflammatory disease. Am Heart J. 1999;138(5 Pt 2):S419–S420.
34. Newby AC. Dual role of matrix metalloproteinases (matrixins) in intimal thickening and atherosclerotic plaque rupture. Physiol Rev. 2005;85(1):1–31.
35. Vink A, Schoneweld AH, Poppen M, de Kleijn DP, Borst C, Pasterkamp G. Morphometric and immunohistochemical character-ization of the intimal layer throughout the arterial system of elderly humans. J Anat. 2002;200(Pt 1):97–103.
36. Sen U, Basu P, Abe OA, et al. Hydrogen sulfide ameliorates hyperhomocysteinemia-associated chronic renal failure. Am J Physiol Renal Physiol. 2009;297(2):F410–F419.
37. Yasmin, McEniery CM, O’Shaughnessy KM, et al. Variation in the human matrix metalloproteinase-9 gene is associated with arterial stiffness in healthy individuals. Arterioscler Thromb Vasc Biol. 2006;26(8):1799–1805.
38. Langille BL, Bendeck MP, Keeley FW. Adaptations of carotid arteries of young and mature rabbits to reduced carotid blood flow. Am J Physiol. 1989;256(4 Pt 2):H931–H939.
39. Langille BL, O’Donnell F. Reductions in arterial diameter produced by chronic decreases in blood flow are endothelium-dependent. Science. 1986;231(4736):405–407.
Vascular Health and Risk Management downloaded from https://www.dovepress.com/ by 118.70.13.36 on 27-Aug-2020