THE EFFECTS OF SENSORY INPUTS AND HYPERVENTILATION ON POSTURAL STA B IU TY IN M AN
by
VASILDCI SAKELLARI GradDipPhys, TEI of Athens, 1992,
M.Sc (Ergonomics) University College London, 1993.
A thesis submitted for the Degree of Doctor of Philosophy, in the Faculty of Science, of the University of London
October 1996
MRC, Human Movement and Balance Unit, Institute of Neurology, London.
ProQuest Number: 10106716
All rights reserved
INFORMATION TO ALL USERS
The quality of this reproduction is dependent upon the quality of the copy submitted.
In the unlikely event that the author did not send a complete manuscript and there are missing pages, these will be noted. Also, if material had to be removed,
a note will indicate the deletion.
uest.
ProQuest 10106716
Published by ProQuest LLC(2016). Copyright of the Dissertation is held by the Author.
All rights reserved.
This work is protected against unauthorized copying under Title 17, United States Code. Microform Edition © ProQuest LLC.
ProQuest LLC
789 East Eisenhower Parkway P.O. Box 1346
ABSTRACT
The studies involved in this thesis were undertaken to investigate postural stability during auditory and visual stimuli and assess the effect of hyperventilation (HV) on postural mechanisms.
Recording techniques included a force platform and an electro-magnetic head motion recorder (for body sway measurements), transcutaneous carbon dioxide tension measurements, surface electromyography and electro-oculography. The research strategy involved establishing relationships between the physical characteristics (frequency, intensity, direction) of the stimuli used (eg visual, proprioceptive) and the physical characteristics of the sway pattern elicited (amplitude, velocity and direction).
HYPERVENTILATION EXPERIMENTS: Initially postural instability after voluntary HV was documented. The HV effects were more intense with eyes closed. HV preferentially increased low frequency oscillations, and this effect was present both in healthy and labyrinthine defective subjects.
Additional experiments were undertaken in order to clarify by which mechanisms HV can interfere with balance control. Neurophysiological studies showed that the electrically evoked sural nerve action potential increased its amplitude whereas the scalp somatosensory evoked potentials decreased during HV. In contrast, no significant effects of HV on short-latency vestibulo-spinal responses were detected (click-evoked vestibulo- colic EMG response). The hypothesis that the vestibulo-cerebellum might also be affected by HV was also investigated by recording ocular-motor functions mediated by this neural structure (vestibulo-ocular reflex suppression and smooth pursuit eye movements). Ocular performance, however, was unchanged by HV.
VISUAL MOTION EXPERIMENTS: The question investigated was if the main direction of a visually evoked postural response can be re-oriented as a function of eye-in-orbit and head-on-trunk position. The visual motion stimulus used consisted of a large disc rotating around the line of sight. Subjects viewed the rotating disc with various combinations of eye and neck deviations. It was found that the plane of motion of the visual stimulus with respect to the body modulated the direction of postural reactions. The findings indicate that signals of the eye-in-orbit and head-on-trunk position are used in the visual control of postural sway. It is argued that these signals are of proprioceptive origin.
ACKNOWLEDGEMENTS
I wish to express my sincere gratitude to the following people:
my supervisor, Adolfo Bronstein, for his inspired ideas, his assistance and for caring for the quality of this work;
Roger Soames, who supervised me during the first year of this degree and who kindly allowed me the use of his force plate;
Michael Gresty for taking good care of us all at the lab, his positive attitude and his encouragement; and all the members of Human Movement and Balance Unit, Institute of Neurology, for their stimulating friendship and for creating a scientific atmosphere;
Clive Wolsley, for his invaluable assistance and advice;
all my subjects, who uncomplainingly exerted themselves on my behalf;
my brother Kostas, Josephine, Claire, Katherine and Severin for their friendship and support during the hard course of this work; my parents Panagiotis and Eleni and my fiance George for being there for me;
Steve Jones, Stefano Coma, Edgar Brown, Caroline Hammon, Peter Burchill, Mary Faldon and David Buckwell for technical advice and assistance to the experimental work of this thesis; Peter Milligan and Angela Lee for statistical advice; the members of the Medical Engineering Department at the Great Ormond Street Hospital, Physiology Department and Music Laboratory at the King’s College and of the Human Performance Laboratory at the Royal Free Hospital; for having made their research facilities available to me.
DECLARATION
I declare that this thesis has been composed by myself and the papers cited were all consulted by me personally, except where it is otherwise stated.
The experimental work described in the ’Core Publication, Appendix D l ’ were all carried out and written by myself and supervised; by Dr RW Soames (first publication corresponds to Chapter 5) and Dr AM Bronstein (all the rest core publications, correspond to Chapter 2 and 3). The study described in Chapter 4 and is included in the ’Supplementary Publications’, Appendix D2 was carried out by myself and Mr CJ Wolsley, supervised by Dr AM Bronstein and written by Mr CJ Wolsley.
I declare that the work in this thesis, is original work and this thesis has been written solely by Vasiliki Sakellari.
signed:
Dr AM Bronstein, MD, PhD, consultant neurologist, MRC Human Movement and Balance Unit, National Hospital for Neurology and Neurosurgery.
Ethical Approval
TABLE OF CONTENTS
Page
TITLE P A G E ... 1
A B S T R A C T ... 2
ACKNOW LEDGEMENTS... 4
D ECLA RA TIO N ... 5
C O N T E N T S ... 6
LIST OF T A B L E S... 10
LIST OF F IG U R E S ... 13
ABBREVIATIONS ... 21
Chapter One: Introduction - Literature Review 1. General In tro d u ctio n ... 24
1.1 Hyperventilation and E quilibrium ... 26
1.2 Ocular, Cervical Proprioceptors and Equilibrium ... 29
1.3 Sound and E q u ilib riu m ... 30
1.4 General aims of the th e s is ... 32
1.5 Hypotheses ... 32
Chapter Two: Hyperventilation on Postural Stabilisation 2. General methodology - A pparatus... 34
2.1 Force p la tfo rm ... 34
2.1.1 Description of the platform m easurem ents... 34
2.1.2 Calibration of the platform ... 35
2.2 Transcutaneous recorder of partial carbon dioxide p r e s s u re ... 40
2.2.1 Carbon dioxide and hyperventilation... 41
2.3 Introduction ... 43
2.3.1 Pilot study ... 43
2.3.1.1 Introduction... 43
2.3.1.2 Materials and M e th o d s... 44
Co n ten ts
2.3.1.4 Discussion ... 49
2.3.2 Main study ... 50
2.3.2.1 Introduction ... 50
2.3.2.2 Materials and M ethods... 50
2.3.2.3 R e su lts... 52
2.3.2.4 Discussion ... 67
2.4 S u m m a ry ... 71
Chapter Three: Mechanisms o f the Hyperventilation Induced Instability 3. In tro d u ctio n ... 73
3.1 The effect of hyperventilation on vibration p ercep tio n ... 73
3.1.1 Introduction ... 73
3.1.2 M eth o d ... 74
3.1.2.1 Calibration of the neurothesiom eter... 75
3.1.3 R e s u lts ... 75
3.1.3.1 Repeatability of the s tu d y ... 78
3.1.4 Discussion ... 80
3.2 The effect of hyperventilation on somatosensory evoked potentials and sensory action potentials from the sural nerve... 81
3.2.1 Introduction ... 81
3.2.2 M eth o d ... 82
3.2.3 R e s u lts ... 86
3.2.4 Discussion ... 91
3.3 Myogenic potentials generated by a click-evoked vestibulocollic reflex after hyperventilation... 93
3.3.1 Introduction ... 93
3.3.2 M eth o d ... 93
3.3.3 R e s u lts ... 94
3.3.4 Discussion ... 97
Co n te n ts
3.4.1 Introduction ... 98
3.4.2 M e th o d ... 98
3.4.2.1 Pilot study to evaluate the reliability of the ocular recording techniques under the influence of hyperventilation... 98
3.4.2.2 Calibration of the rotatory c h a ir ... 101
3.4.2.3 Experimental c o n d itio n s... 102
3.4.2.4 A n a ly s is ... 102
3.4.3 R e s u lts ... 103
3.4.4 Discussion ... 109
3.5 Body sway and spontaneous nystagmus after HV in patients with unilateral vestibular le sio n s... 109
3.5.1 Introduction ... 109
3.5.2 M eth o d ... 110
3.5.3 R e s u lts ... I l l 3.5.4 Discussion ... 119
3.6 S u m m a ry ... 121
Chapter Four: Reorientation o f Visually Evoked Postural Responses by Different Eye-in-Orbit and Head-on-Trunk Angular Positions 4. In tro d u ctio n ... 124
4.1 Materials and M ethods... 126
4.2 R e su lts... 129
4.3 D is c u ss io n ... 134
4.4 S u m m a ry ... 137
Chapter Five: Auditory and Visual Interactions on Postural Stabilisation 5. In tro d u ctio n ... 139
5.1 Materials and M ethods... 139
5.1.1 Selection of subjects ... 139
5.1.2 Selection and presentation of sounds ... 140
Co n te n ts
5.2 R e su lts... 145
5.3 Discussion ... 151
5.4 S u m m a ry ... 154
Chapter Six: Overview 6. O v erv iew ... 156
1 REFERENCES ... 160
^A P P E N D IC E S... 182
APPENDDC A: (corresponds to Chapter 2) ... 183
Hyperventilation Coefficient under variable visual and proprioceptive information ... 184
Romberg Coefficient under variable visual and proprioceptive information. 185 Sway parameters after combined active movements and hyperventilation. . 186
Normalized elliptical sway area curves versus time... 187
Anterior-posterior deviation after different hyperventilation intervals 188 Sway increase in healthy and avestibular subjects... 189
Information to the su b jects... 190
APPENDIX B: (corresponds to Chapter 3) ... 191
Observations on video-oculographic data in patients with unilateral vestibular lesion before and after hyperventilation... 192
Sway parameters of 6 patients with complete unilateral loss, before and after hyperventilation ... 193
Regression of the voltameter versus the neurothesiometer indications . . . . 194
Regression of the estimated versus the actual chair v e lo c ity ... 195
Spontaneous nystagmus in patients with unilateral lesions before and after hyperventilation ... 196
APPENDIX C: (corresponds to Chapter 5) ... 197
Co n ten ts
Equal loudness contours for pure t o n e s ... 201
Information to subjects ... 202
APPENDIX D; Related Publications... 204
Core Publications ... 206
Supplementary P u b licatio n s... 224
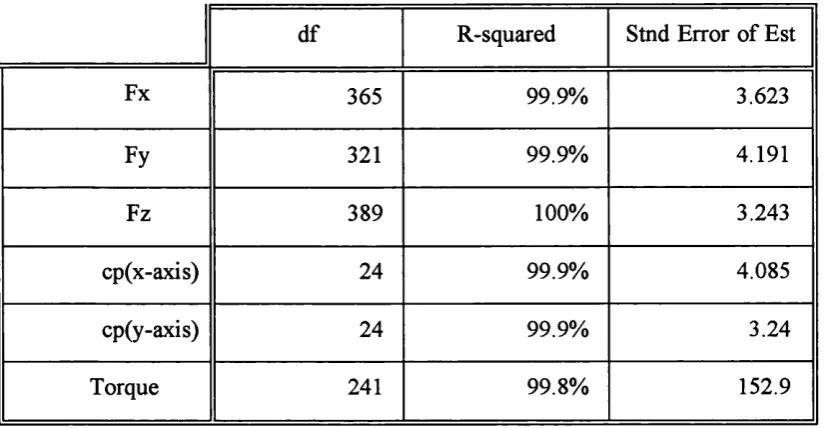
LIST OF TABLES Chapter Two: Hyperventilation on Postural Stabilisation Table 2.1: Summary of regression analysis for determination of the X, Y and Z force components, the location of the centre of applied pressure and the torque... 38
Table 2.2: Postural performances (averages and standard deviations) of 5 normal subjects before and after 30 and 60 sec of hyperventilation. Measurements of the mean lateral and anterior-posterior deviation and the total sway length and area travelled ... 48
Table 2.3: The mean Hyperventilation Coefficient values, their standard deviations and range calculated for the mean lateral and anterior-posterior deviation; the length of the sway path or the mean sway velocity and the sway area, in each experimental condition... 60
Chapter Three: Mechanisms o f the Hyperventilation Induced Instability Table 3.1: Average vibration thresholds and standard deviations... 77
Co n te n ts
Table 3.2: Means and standard deviations of the amplitudes and latencies of the peripheral compound action potentials and scalp somatosensory evoked potentials and the
correspondent partial transcutaneous carbon dioxide pressure for the 5 phases of the study, after stimulations
of the sural nerve... 90
Table 3.3: Means and standard deviations of the slow phase velocity and velocity gain during sinusoidal stimulation, for the vestibulo-ocular reflex, its visual suppression and the ocular smooth pursuit. Both electro-oculographic and
scleral infra-red recordings are presented... 108
Chapter Five: Auditory and Visual Interactions on Postural Stabilisation
Table 5.1: The significant p values obtained from a four-way
analysis of variance on the main effect of subject, vision, loudness, critical band frequency and their two and three
way interactions on different sway parameters... 146
Table 5.2: The effect of critical band frequency on the mean movement of the centre of pressure in the anterior- posterior direction. Groups containing critical bands with
similar effects at the 5% statistical level in this direction . 147
Appendix A
each.
Co n t e n t s . . . . 184
Table A2: The average Romberg Coefficient values, their standard deviations and range calculated for different sway parameters under variable visual and proprioceptive information. Data from 6 healthy subjects, 3 repetitions
each... 185
Table A3: Average values and standard deviations calculated for different sway parameters under the influence of
combined active movements and hyperventilation. Data
from 7 healthy subjects... 186
Appendix B
Table B l: Video-oculographic recordings, measurements the slow phase velocity of individual beats and direct video
observation; before hyperventilation (central gaze in light and dark) and after 60 sec hyperventilation (central gaze in dark). Data from 6 patients with complete unilateral
vestibular l o s s ... 192
Table B2: Summary of the sway performances of 6 patients with complete unilateral loss, without hyperventilation and after 30 and 60 sec hyperventilation. Mean values, standard deviation and range of
different sway parameters... 193
Appendix C
Table C l: Results of student t-tests between the audiometric results
from the right and left ear for each individual subject. . . 198
Co n tents
Table C2: Critical bands spanning the audible frequency range... 200
LIST OF FIGURES
Chapter Two: Hyperventilation on Postural Stabilisation
Figure 2.1: The experimental set up used to calibrate the platform
device... 37
Figure 2.2: Differences between the observed and actual values for the location of the centre of foot pressure plotted against their mean for the lateral and for the anterior-posterior
axis... 39
Figure 2.3 Example of raw data. Torque in the sagittal plane as a function of time; for the baseline (no hyperventilation),
after 30 and after 60 sec hyperventilation... 46
Figure 2.4: Mean deviation of the centre of pressure of individual subjects in the lateral and the anterior-posterior directions after hyperventilation intervals of 0, 30 and 60 sec.
Recordings of 45 sec with eyes open and closed... 47
Figure 2.5: (A) Raw X-Y plots of the centre of foot pressure path, plotted relative to its mean position, before and after 30 sec hyperventilation in a normal subject. (B) Mean and standard deviation of the maximal and mean deviation of the centre of foot pressure before and after 30 sec
hyperventilation. Averages from 12 subjects tested 3
Co n ten ts
Figure 2.6: Average increase and standard deviation of the mean anterior-posterior, lateral deviations, sway area and mean sway velocity after 30 sec hyperventilation. Data from 12
subjects tested 3 times each with their eyes closed... 54
Figure 2.7: Fourier spectra of the displacements of the centre of pressure in the anterior-posterior direction. Averages and standard deviations from 36 trials with eyes closed (12
subjects, 3 repetitions)... 56
Figure 2.8: Anterior-posterior sway with eyes closed after 30 sec of hyperventilation in comparison with the baseline trace. Average data and standard deviations from 36 trials (12
subjects, 3 repetitions)... 57
Figure 2.9: Percentage transcutaneous partial carbon dioxide pressure reduction after hyperventilation for 30, 60 and 90 sec and mean sway deviations in the anterior-posterior direction at the same time intervals (6 subjects tested 3 times each
with their eyes closed)... 59
Figure 2.10: Hyperventilation effect when standing on solid support or foam and having the eyes open and closed for the
anterior-posterior and lateral deviation, sway velocity and sway area. Asterisks indicate significant differences
between before and after hyperventilation... 62
Figure 2.11: Average increase and standard deviation of the mean anterior-posterior sway deviation after two active tasks; rising from a bench and after pitch head movements, without or preceded by hyperventilation. Seven subjects
tested with their eyes open and closed.
Co n t e n t s 64
Figure 2.12: The mean anterior-posterior deviation before and after hyperventilation. Averages from 9 avestibular and 9 healthy age matched normal subjects. Recordings were of
30 sec duration with the eyes closed... 66
Chapter Three: Mechanisms o f the Hyperventilation Induced Instability
Figure 3.1: Vibration thresholds of 5 normal subjects examined in the seated and semisupine position immediately after
hyperventilation of 0, 30, 60 and 90 sec... 76
Figure 3.2: Semisupine versus seated positions. Regressions of the percentage transcutaneous partial carbon dioxide pressure decrease; and the vibration thresholds, without
hyperventilation and immediately after the end of 30, 60
and 90 sec hyperventilation... 79
Figure 3.3: The experimental set up used for the stimulation and recording of the compound sensory action potentials and the somatosensory evoked potentials after stimulation of
the sural nerve... 83
Figure 3.4: Diagrams of somatosensory evoked potential and evoked sensory action potential waveforms, recorded
simultaneously after stimulation of the sural nerve... 85
Figure 3.5: The mean transcutaneous partial carbon dioxide pressure (±1 standard deviation) before, during, and in the
Co n ten ts
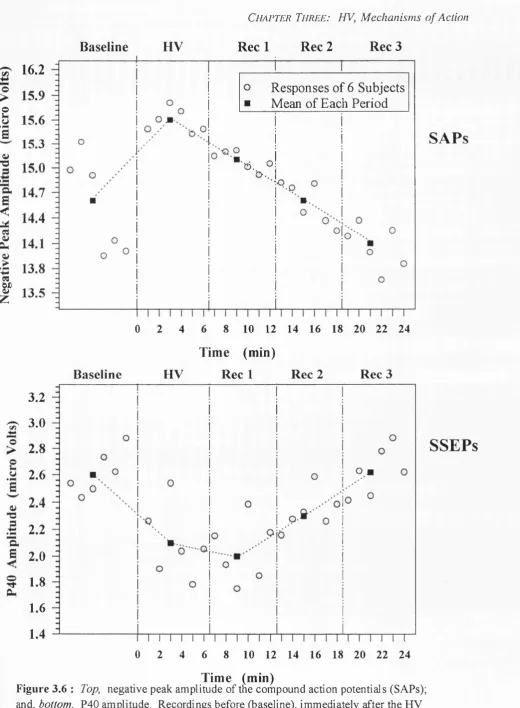
Figure 3.6: Negative peak amplitude of the compound action potentials; and P40 amplitude. Recordings before, between the hyperventilation intervals and during the
recovery after hyperventilation... 88
Figure 3.7: Click-evoked vestibular myogenic potentials, recorded simultaneously from the left and the right
sternocleidomastoid muscles of a normal subject, in response to clicks presented from the left ear, before and
after hyperventilation... 95
Figure 3.8: The mean pl3-n23 amplitude of the myogenic potential generated in the ipsilateral sternocleidomastoid muscle by sound clicks, before and after hyperventilation in each
subject... 96
Figure 3.9: Correlations of the eye position before and after 60 sec hyperventilation, for the electro-oculographic and scleral
infra-red recordings... 100
Figure 3.10: Vestibulo-ocular reflex in a normal subject, in response to whole body oscillations in the dark. Simultaneous
recordings with scleral infra-red and electro-oculographic
techniques; before and after 60 sec hyperventilation... 104
Figure 3.11: Visual suppression of the vestibulo-ocular reflex in a normal subject during whole body oscillations, in the dark. Simultaneous recordings with scleral infra-red and electro-oculographic techniques; before and after 60 sec
hyperventilation... 105
Co n te n ts
Figure 3.12: Ocular smooth pursuit of a sinusoidally moving target, in a normal subject. Simultaneous recordings with scleral infra-red and electro-oculographic techniques; before and
after 60 sec hyperventilation... 106
Figure 3.13: Average velocity gain before and after 60 sec hyperventilation. Data from each individual subject,
obtained using electro-oculography... 107
Figure 3.14: Horizontal eye movements of a patient with selective right neurectomy, in light, in dark and recordings in dark: during hyperventilation, immediately after 60 sec
hyperventilation and 1 min after the end of
hyperventilation... 113
Figure 3.15: Slow phase velocity of the horizontal and vertical nystagmus of each patient, before and immediately after 60 sec hyperventilation. Average of 10 sec recordings
fixating in the dark... 114
Figure 3.16: Average slow phase eye velocity of the horizontal nystagmus before (dotted line) and immediately after 60
sec hyperventilation as a function of time... 115
Figure 3.17: Postural sway in a 68 year-old patient with left viral cochlear/vestibular lesion: before and after 60 sec
hyperventilation... 117
Figure 3.18: Mean anterior-posterior and lateral deviation, mean sway velocity and sway area before and immediately after the
Co n ten ts
Chapter Four: Ocular and Cervical Proprioceptors on Postural Stabilisation
Figure 4.1: A subject swaying in the right-left direction whilst looking at stationary objects with eyes and head straight ahead experiences self-generated visual motion in the left- right direction. This co-planarity between body sway and visuo-retinal motion is altered when eyes and/or head are
deviated... 125
Figure 4.2: Body sway in the anterior-posterior direction. Raw traces recorded simultaneously from the fastrack and the
platform device; and regression of raw recordings from
the two devices... 127
Figure 4.3: Averaged sway platform recordings with standard
deviations during viewing of the clockwise rotating disc with eyes and head straight ahead or with gaze deviation
of 90°... 130
Figure 4.4: Averaged sway platform recordings whilst viewing the clockwise rotating disc in the straight ahead and left sided positions. Each turning point represents 5 sec of data. During the first 15 sec and the last 15 sec the disc was
stationary... 132
Figure 4.5: Summary of results: testing positions and main vectors
of the visually elicited sway responses... 133
Chapter Five: Auditory and Visual Interactions on Postural Stabilisation
Figure 5.1: Schematic representation showing the production and
Co n ten ts
presentation of the auditory stimuli... 142
Figure 5.2: Frequency spectrum of the background noise level of the
test environment... 143
Figure 5.3: The interaction of vision and critical band frequency on the mean movement of the centre of pressure in the
anterior-posterior direction... 148
Figure 5.4: The interaction of loudness (70 phones and 90 phones) and critical band frequency on the mean movement of the
centre of pressure in the lateral direction... 150
Figure 5.5: The interaction of vision (eyes open and eyes closed), loudness (70 phones and 90 phones) and critical band
frequency on the length of the sway path... 150
Appendix A
Figure A l: Normalized elliptical sway areas versus time (sway-time
curves). Raw data from 12 subjects... 187
Figure A2: Mean sway deviations in the anterior-posterior direction after 0, 30, 60, 90 sec of hyperventilation. Data from 6
healthy subjects, 3 repetitions each... 188
Figure A3: Average sway increases and standard deviations in 9
healthy and 9 avestibular agematched subjects... 189
Co n ten ts
Figure B l: Regression of the voltameter versus the neurothesiometer
indications ... 194
Figure B2: Regression of the estimated versus the actual chair
velocity ... 195
Figure B3: Horizontal eye movements in the dark of 6 patients with long standing unilateral vestibular lesions before
(baseline) and after 60 sec HV... 196
Appendix C
Figure C l: Minimum audible field and equal loudness contours for
pure tones... 201
Ab breviatio n s
ABBREVIATIONS
ANOVA Analysis of variance
Ae 95% confidence elliptical sway area Ao Area included within the sway path CAS Computer automated stability analysis CNS Central nervous system
CO2 Carbon dioxide
dB Decibel
d f Degrees of freedom EEG Electroencephalogram EMG Electromyogram ENG Electronystagmogram EOG Electro-oculogram
FFT Fast Fourier transformation HV Hyperventilation
IR Infra red kPa Kilo Pascal
L Length of the sway path LDs Labyrinthine defective subjects LEQ Equivalent continuous sound level mm Hg Millimetres of Mercury
PCO2 Partial pressure of carbon dioxide
Phon Unit of loudness level Rec Recovery
Rm Mean deviation about the sway radius Rs Standard deviation about the sway radius SAPs Sensory action potentials
Abbrev iatio n s
SPV Slow phase velocity
SSEPs Somatosensory evoked potentials Vel Mean sway velocity
VOR Vestibulo-ocular reflex
VORS Suppression of the vestibulo-ocular reflex Xm Mean lateral sway deviation
Xs Standard deviation of the lateral deviation Ym Mean anterior-posterior deviation
Ys Standard deviation of the anterior-posterior deviation
C
h a p t e rO
n eCh apter On e: Introdu ction
1.
General Introduction
Postural adjustments underlying the maintenance of equilibrium result from feedforward control and from the integration of different sensory information (proprioceptive, vestibular and visual). This integration takes part within the central nervous system, resulting in motor responses which control postural sway and maintain the centre of gravity over its base of support. Since standing is a dynamic event, a small amount of postural sway (physiological body sway) is a normal and constant process. During the course of a normal day, a person is asked to maintain postural and balance control in order to function independently. Feedback by sensory systems - vestibular, visual and proprioceptive - in response to different stimuli is essential for this purpose. The belief that postural equilibrium may be retrained by modem rehabilitation techniques has stimulated interest in identifying ’high risk’ destabilising stimuli and conditions that effect postural control mechanisms.
In this thesis, postural stability is examined as a manifestation of corrective mechanisms associated with the maintenance of upright stance. Static posturography - still developing as a practice of assessing balance function and growing in clinical use - is mainly used for this purpose. Other methods, complementary to posturography, such as recording eye movements, vibration thresholds and evoked potentials are also used. More specifically this thesis explores three neglected aspects of postural control in response to three different stimuli:
a. after voluntary hyperventilation;
b. in response to moving visual targets in different eye-in-orbit and head-on- tmnk angular positions; and
c. in response to sounds differing in loudness and frequency.
Ch apter On e: Introdu ction
The first study of this thesis describes the unsteadiness induced after voluntary hyperventilation in normals and vestibular subjects (Chapter 2). This is followed by an attempt to identify the neurophysiological basis provoking such unsteadiness using technics such as somatosensory evoked potentials and nystagmographic analysis (Chapter 3).
Although the relationships between sound, vision, proprioception and human equilibrium have been considered, most of the studies in this area have been concerned with whether or not such effects exist and have not clarifyed the relationships between the physical characteristics of the stimuli and the sway parameters. Another objective of the thesis is therefore to examine how different auditory, visual and proprioceptive cues affect the ability of normal people to regulate their balance control.
In Chapter 4 the question of whether the position of the eyes in the head and of the head on the trunk influence the direction of visually elicited postural reactions was examined. Previous studies dealing with visuo-postural control in man have not considered the importance of the contribution of the ocular and cervical proprioceptors.
Chapter 5 identifies possible sound characteristics liable for postural instability. A practical application of revealing specific destabilising critical sound bands (groups of frequencies) may help in the prevention of industrial accidents.
Finally an overview of this thesis as well as some suggestions for future work are presented in Chapter 6.
Ch apter On e: Introduction
1.1 Hyperventilation and Equilibrium
Hyperventilation is ventilation in excess of metabolic needs (Lum 1976, Conway et al. 1988, Holland 1991). It is observed under certain emotional and stressful conditions in which the coordination of respiratory control may break down (Wientjes 1992). This type of break down is characterized by exaggerated ventilatory activity, which causes more carbon dioxide to be eliminated from the body than is produced by metabolic processes. Rapid, deep breathing with a high inspiratory flow rate is typical of increased arousal (Dudley et al. 1964). After voluntary hyperventilation, it may take several minutes for the alveolar partial carbon dioxide pressure to assume its steady state. This is because carbon dioxide is stored in the body in the form of bicarbonate in the blood and interstitial fluid and it takes some time to reach an equilibrium (West 1985).
Hyperventilation may elicit somatic and psychological symptoms, such as cardiac and respiratory complaints, dizziness, tingling sensations, in addition to feelings of confusion, anxiety, and panic (Grossman and Wienties 1989). Indeed, papers with a comprehensive view of the dizzy patient indicate hyperventilation as one of the most common causes of dizziness (Drachman and Hart 1972, Hanson 1989). The psychosocial consequences of the syndrome are obvious since it can itself give rise to heightened anxiety, leading to an escalating cycle of symptoms and fear of what they might signify.
Hyperventilation has been used as a provocation test for eliciting vertigo and nystagmus. Drachman and Hart (1972) analysed 104 patients with complaints of vertigo and found that a patient’s complaint of chronic dizziness could be reproduced by hyperventilation in nearly 25% of those patients studied. Despite the extensive use of the hyperventilation provocation test in clinical practice very little is known about the mechanisms of its action. Its diagnostic value is mainly based on the reproduction of the symptoms caused. Researchers, such as Spinhoven et al. (1993) have questioned the validity of the hyperventilation provocation test and the concept of hyperventilation syndrome. They
Ch apter On e: Introdu ction
believe that the hyperventilation provocation test is an non-specific stressor during which anxious patients may anticipate an anxiety attack.
The first attempt to confirm the sensation of dizziness after hyperventilation objectively, by nystagmus, was made by Monday and Tétreault (1980). They observed that there was a significant increase in the number of positions in which nystagmus was elicited in healthy subjects after 90 sec hyperventilation periods, without having demonstrable effect on the postcaloric nystagmus. Drachman and Hart (1972) described a syndrome of positional vertigo occurring only after hyperventilation. The Nylen-Bàràny manoeuvre produced vertigo and nystagmus only after hyperventilation (the patient’s complaints were by history, of positional vertigo associated with hyperventilation symptoms). The researchers decided to include hyperventilation followed by positional testing in their routine electronystagmographic battery in the laboratory. Theunissen et al. (1986) observed an association between vestibular hyperactivity and hyperventilation syndrome. They suggest that hyperventilation patients tend to have a higher gain of vestibulo-ocular reflex than normals and normal subjects following forced hyperventilation tend to behave like hyperventilation patients.
Gotoh et al. (1965) has suggested that hyperventilation lowers the carbon dioxide content of the blood, producing constriction of the cerebral vasculature which in turn causes dizziness. Wyke (1963) reported that voluntary hyperventilation produces a detectable drop in cerebral blood flow within 1.5 minutes. Additionally, Stringer et al. (1993) found that hyperventilation induced cerebral ischemia affects both injured and apparently intact areas of the brain, in patients with acute brain lesions. Kennealy (1980) suggested that cerebral tissue hypoxia is produced by hyperventilation.
Ch apter On e: Introdu ction
drug-resistant partial epilepsies (Schuler et al. 1993). Nevertheless Van der Worp et al. (1991) concluded that the electroencephalographic changes observed during hyperventilation must mainly or totally be attributed to factors other than cerebral hypoxia.
As already mentioned a number of authors have stressed that one of the main symptoms of hyperventilation is the subjective feeling of dizziness. On the other hand, hypoxia has been associated with hyperventilation in one way or another. It has been found that postural sway is disturbed by mild, but not with severe hypobaric hypoxia. Fraser et al. (1987) reported a significant increase in postural sway after acute exposure to simulated high altitudes. Although in their experiment they observed a significant change of end tidal carbon dioxide there was no significant interaction between altitude and carbon dioxide.
Points of exploration of the first part of this study are (a) if this ’dizzy’sensation is accompanied by objectively decreased balance capacity; (b) the characteristics of this altered sway behaviour; (c) its correlation, or not, with the reduction in the partial pressure of arterial carbon dioxide; (d) the degree of hyperventilation-induced unsteadiness in the presence of altered proprioceptive, visual or vestibular cues; (e) the similarity, or not, in the response to hyperventilation of patients with vestibular deficit and normal subjects.
Feelings of dizziness and tingling fingers can occur in every subject during hyperventilation provocation test (Vansteenkiste et al. 1991, Grossman and Wientjes 1989). According to Macefield and Burke 1991, the parasthesiae and tetany induced by hyperventilation result solely from the increase in the excitability of cutaneous and motor axons in the peripheral nerve. Priori et al. (1995) using transcranial brain stimulation found that over 5 minutes of hyperventilation were required to depress motor cortical inhibition. In parallel by stimulating electrically the ulnar nerve they found no change of the motor potentials concluding that hyperventilation does not affect spinal inhibition. This is in agreement with studies conducted by King et al. (1932) in animals with intact spinal cord in which hyperventilation produced only mild effects on the myotatic reflex.
Ch a pter On e: In trodu ction
The aim of the second part of this study was to determine whether the effect of hyperventilation has a pure proprioceptive action or whether the vestibular, vestibulo- cerebellum systems are equally participating.
1.2 Ocular, Cervical Proprioceptors and Equilibrium
The fact that vision contributes to postural stability has been known for over a century (Romberg 1846). Studies investigating the role of the visual system have shown that it can function as a compensatory mechanism for a deficit in one or more of the remaining postural control systems (Doman et al. 1978, Lee and Lishman 1975). Edwards (1946) found that vision attenuates self-generated sway by 50-100%. and Dichgans and Brandt (1978) observed that spontaneous body sway is reduced by up to 60% with visual feedback in normal individuals, standing on a flat stable surface. However it is only recently that the precise function of vision in postural control has begun to emerge (Paulus et al. 1984).
Vision controls balance by generating postural reactions which are direction-specific to the visual motion stimuli. This has been demonstrated with experiments in which the visual surroundings are experimentally moved. Thus, rotatory motion in the frontal plane (roll-motion) in a clockwise direction or a linear optokinetic stimuli to the right induce postural tilt to the right (Dichgans et al. 1975, Clement et al. 1985, Bronstein 1986). It is accepted that these experimentally induced postural movements are in response to a visually-mediated sense of self motion or tilt (Dichgans et al. 1972). Such ’illusion’ need not be consciously perceived since studies have shown that postural responses occur well before any vection illusion is reported (Previc and Mullen 1991) or with subjects unaware as to the cause of their unsteadiness (Lee and Lishman 1975).
Chapter On e: Introdu ction
Lestienne et al. 1977, Clement et al. 1985, Bronstein 1986, B le se ta l. 1983, Dichgans et al. 1975, Dietz et al. 1994) suggesting that vision has a role of its own. It is not clear if these two mechanisms are actually different.
Studies of postural responses elicited by visual motion have used two basic types of stimuli. Long lasting stimuli (usually at constant, high velocities) elicit sustained postural responses (Lestienne et al. 1977, Dichgans et al. 1975, Clement et al. 1985) which are likely to represent the visual contribution to postural adjustments in response to long range, vehicular or locomotor displacements. Studies using transient or oscillatory, low velocity stimuli are more likely to probe visuo-motor mechanisms controlling spontaneous body sway (Lee and Lishman 1975, Bronstein 1986). Here again, it is not clear whether these responses are mediated by the same mechanisms or not.
There is a simple evidence indicating the importance of the proprioceptive input from the lower limbs (Diener et al. 1984, Dichgans and Brandt 1978), and to some extent from the neck region (Holtmann et al. 1989, Pyykko et al. 1989) for the postural control. De Wit (1971) demonstrated the maintenance of the upright stance through the somatosensory system alone, by his "Flying Enterprise Syndrome" experiments. The subjects remained upright due to the somatosensory system alone.
In the study described in Chapter 4 different combinations of eye and head deviations are used to study the main direction of visually induced sway as a result of combined information from the cervical and ocular proprioceptors and the visual stimulus.
1.3 Sound and Equilibrium
Sound is such a common part of everyday life that its varied functions are rarely fully appreciated. However, Juntunen et al. (1987) demonstrated that chronic noise exposure may increase postural instability, possibly by affecting the vestibular end organ, and that severe hearing loss is correlated with increased sway. Both Dietedch et al. (1989) and
Ch apter On e: Introdu ction
Ishizaki et al. (1991a,b) have observed that, in certain disorders affecting the middle and inner ear, vestibular activation can occur with the presentation of sound; the Tullio phenomenon. Baloh and Honrubia (1979) trying to explain this phenomenon of dizziness by loud noises, suggest that it could be explained by fibrous adhesions between the medial surface of the stapedial footplate and the membranous labyrinth which result in displacement of endolymph when the footplate moves. Pyykko et al. (1992), also referred to mechanisms that could explain the vestibular response to sound in patients suffering from vertigo due to different types of inner ear disease. Sound-evoked phenomena such as myogenic responses in cranial muscles, the postauricular response (Kiang 1963) and the acoustic jaw reflex (Meier-Ewert et al. 1974) are well documented.
Abnormal sensitivity to certain environmental sounds is observed in some subjects with hyperacusis. This phenomenon implies discomfort or a startled response to sounds at an intensity which would not be considered threatening or loud by the average person (Nigam and Samuel 1994): reactions vary from covering the ears to crying or cringing. Most individuals with hyperacusis, however, have virtually normal hearing.
Vestibular stimulation by sound is not confined solely to pathological conditions. In an early study von Békésy (1935) attempted to show that the vestibular system was sensitive to sound, but found that no body movement could be elicited with pure tone stimuli (1000 Hz) below 90 dB sound pressure level (SPL); however, an increase in head movement at intensities greater than 92 dB was observed. He observed that head movements of the order of 0.5 mm could be evoked with sound levels of 120 dB, while a sound pressure of 130 dB increased head movements to 10 mm. Moreover, humans exposed to rotating sound fields, where visual information has been eliminated, experience an illusion of self rotation, and may even manifest nystagmus (Lackner 1977). Also according to Marme-Karelse and Bles (1977) the role of the auditory system in circular vection is comparable to the role of the visual system.
Ch apter On e: Introdu ction
et al. 1968) and lateral body sway enhancement at 62 dB (Revusky et al. 1965) have been observed. An increased body sway with certain sounds has also been reported by Molina-Negro and Martinez-Lage (1982) as well as by Raper and Soames (1991) who attempted to relate sway behaviour with both the direction of the sound source and the nature of the auditory input.
To form a more complete framework for the evaluation of auditory signals and their feedback, their influence on postural sway behaviour and the maintenance of balance has been examined.
1.4 General aims o f the thesis
The experimental work of this thesis was designed to achieve the following aims: 1. To ascertain and investigate the relationship between body sway and
hyperventilation in healthy subjects and subjects with vestibular deficits and determine how the demands on the postural stability differ from the baseline condition (no hyperventilation).
2. To improve on the current knowledge of body sway responses of healthy subjects under the influence of sound stimuli; and visual stimuli by different eye-in-orbit and head-on-trunk angular positions.
3. To determine how additional demands are met.
1.5 Hypotheses
The main hypotheses that this work aims to investigate are stated below:
1. The physical characteristics of different external or internal stimuli (auditory, visual, proprioceptive or respiratory) are essential for the regulation of the human postural responses.
2. The study of postural reactions to the above stimuli can provide an insight on the design of an overall plan for further clinical or other purposes.
C
h a p t e rT
w oCh apter Tw o: B o d y S w a y & H yp erven tila tio n
2 GENERAL METHODOLOGY - APPARATUS
2.1 Force platform
A computerised biomechanics measuring system (AMTI force platform, model OR6-3, linked through an AMTI signal amplifier, model SGA6-1, to an IBM personal computer) was used for the recordings of postural sway in the experiments of this thesis, unless otherwise stated. CAS (Computer Automated Stability Analysis) software was used in calculating the mean position of the centre of pressure relative to the platform coordinates, and to plot the sway data relative to this mean position. Prior to each experiment, the force platform calibration was checked for the accuracy of locating the centre of the applied pressure by placing known loads, at standardised positions on the platform surface.
2.1.1 Description of the platform measurements
The force platform consists of a square metal plate with foil strain gauges attached to load cells at each comer, which measure the three force components Fx, Fy and Fz of the resultant applied force vector, and the three moment components, Mx, My and Mz resulting from the moment of the applied torques or "pure moments". The moment equations can be written as;
Mx = FxO + FzY - FyZ + Tx, (Tx = 0)
My = FxZ + FyO - FzX + Ty, (Ty = 0)
ATz = -FxY + FyX + FzO + Tz
where Tx, Ty, and Tz are the moments applied to the top of the plate; X and Y the location of the resultant force vector and Z represents the position of the top surface of the platform. Consequently, there are three equations with five unknowns. Under normal conditions one is not possible to apply Tx or Ty torques, unless he/she has sticky feet.
Ch apter Tw o: B o d y S w a y & H yp erven tila tio n
The distance Z is small and in the present study Fx and Fy are also small relative to Fz. The above equations can therefore be replaced by the approximate set:
Mx = FzY Y = Mx/Fz
My ^ ~FzX => X = -My/Fz Mz = Tz
Parameters that will be usedfor the description o f body sway in this thesis : Xm and Ym = mean sway deviation (cm) from the mean position in lateral (X, frontal) and anterior- posterior (Y, sagittal) directions; Ys, Xs the standard deviations (cm) of the above positions; L = length of the sway path, the combined X,Y distance (cm) travelled by the centre of foot pressure during the recording time; Vel = mean sway velocity, the length of the sway path divided by the recording time (cm/sec); Ao = area included within the sway path (cm^); Rm, Rs = the mean and standard deviation (cm) about the sway radius.
2.1.2 Calibration of the platform
In order to obtain the best estimate of the validation, the data collected from different orientations were subjected to a multiple regression analysis. The apparatus used to measure the competence of the platform is shown in Figure 2.1 and consists of:
(1) a metallic frame, constructed to hold the platform and to enable loads to be applied in specific directions. The loads were applied exactly on the height of the surface of the platform;
(2) two pulleys, each connected in series between the platform frame and the applied load; and
(3) a stable scaffolding frame to enable the platform to be loaded in any specific direction.
Ch apter Tw o: B o d y S w a y & H yp erven tila tio n
Data were obtained by loading the platform in three different directions. Each axis was initially validated independently. Because of a limitation of the Bedas software load of three kg was placed on the platform (Z axis), -the minimum load required was 2 kg- in order to obtain measurement for the X and the Y axis.
Weights between 0.8 and 33.5 kg were loaded on the X axis and afterwards on the Y axis while the 3 kg load was permanently placed on the Z axis. The process was repeated with 40, 50, 70 and 90 kg instead of 3 kg on the Z axis. For the validation of the Z axis loads between 0.8 kg and 140 kg were applied on it. Regression lines between the applied load and the values given by the software were found to be linear with values of 99.9%, standard errors of the slopes less than 9.13x10"'^ Newtons/Newton and
slopes more than 0.97.
Data collected from simultaneous application of a combination of loads applied to all three axis was then used to test the reliability of the above results. These gave linear regression lines for each of the axes with r^ values of 99.9%, standard errors of the slopes less than 1.51x10'^ Newtons/Newton and slopes more than 0.95.
Competence of the software, regarding the values of the applied torques, was estimated by applying loads at different vertical distances from the centre of the platform while weights of 50, 60 and 80 kg was placed on the top of the platform. The values for the position of the centre of the applied pressure were validated by placing 10 kg load (the surface of the load in touch with the platform had 20 mm diameter) on points of the platform with known X and Y coordinates.
Results of the Regression Analysis for the determination of the X, Y and Z force components (Newtons), the location of the centre of applied pressure (mm) and the Torque (Newton*Meters) can be found in Table 2.1. It is clear that for a given resultant force applied to the platform no actual forces fell outside the 95% confidence interval.
TOP VIEW SIDE VIEW Pulley Scaffold Framework
Weight
Force Platform
Metallic F rm e
/M etallic F
\
45.6 cmPulley I
Force Platf
-30 cm
Cable
Scaffold Framework
Figure 2.1 : The experimental set up used to calibrate the platform device y
0
%
i
8
Ch apter Tw o: B o d y S w a y & H yp erven tila tio n
Table 2.1 : Summary of Regression Analysis for determination of the X, Y and Z force components (Newtons), the location of the centre of applied pressure (cp in mm) and the Torque (Newton*Meters).
df R-squared Stnd Error of Est
Fx 365 99.9% 3.623
Fy 321 99.9% 4.191
Fz 389 100% 3.243
cp(x-axis) 24 99.9% 4.085
cp(y-axis) 24 99.9% 3.24
Torque 241 99.8% 152.9
The accuracy of detecting the location of the centre of applied pressure (essential for the analysis of the results of this thesis) was analysed further. In Figure 2.2(a) the difference between the value of the x coordinate acquired from the software and the actual position of the 10 Kg load on the platform is plotted against the mean of these values.
The Student t-test was used to test for bias, for example if the error gets larger as the distance from the centre of the platform increases. The deviation of the differences measures the variability of the error. The t-test showed that there was no statistically significant difference between the actual and the observed x values, (p>0.2). Thus the values given by the software can be accepted as being true values in the 95% interval with tolerance ± 8.37 mm, p>0.2 (plus or minus two standard deviations of the difference).
The Student t-test showed that reliable data can be also obtained for the y coordinate, (p>0.1). Thus in the 95% interval the tolerance is ± 5.03 mm, p>0.11, (plus or minus two standard deviations of the difference).
e
c /5 <u -a >a
c/5 3 C 108
6 4 2 G -2 -4-6
-8^
-10X -o (U
g
c /5 O C/T e s c /5 <D -a > aa
N oo =3 C *T3 <U > % mO O C/T g 10 -8 6 42
0 -2 -4 -6 -8 - 10Chapter DvO: Body Sway & Hyperventilation
(a) © © © © 0 © © © © © © © © © © i ©
Meaii o f the observed and actual X values (mm)
(b)
© © © 0 © © © © © © © ©“ I--- - --- --- ---
1---200 -150 -100 -50 0 50 100 150 200 Mean of the observed and actual Y values (mm)
Figure 2.2 : D ifferences betw een the observed and actual values for the location o f the centre o f foot pressure plotted against their mean (a) for the lateral axis (X); and (b) for the anterior-posterior axis (Y).
Ch apter Tw o: B o d y S w a y & H yp erven tila tio n
The results of the above analysis were considered acceptable taken under consideration factors such as the friction between the rope and the pulleys, the possible misalignments of the rope and the diameter of the weight placed on the platform. In conclusion the platform performed within acceptable limits of error. The tolerance limits specified previously were used to characterise the values obtained from the platform calibration performed before each study as acceptable.
A cross evaluation of sway recordings obtained both by a force platform and by recordings of the upper body sway obtained with an electro-magnetic head motion recorder (3-space fastrack system, Polhemus, Kaiser Aerospace and Electronics) is described in Chapter 4.
2.2 Transcutaneous recorder of partial carbon dioxide pressure (tc-pC02)
A transcutaneous heated membrane monitor Radiometer Copenhagen (type TCM3) was used to record the PCO2 values. Blood gas data were obtained from a TC, E5277
combined tc-p02/pC02 electrode, of 15 mm diameter and 3.8 gr weight, heated at 44°C. The recording was made possible by the following mechanism: When the electrode is attached to the skin, the generated heat is transferred from the heating element via a silver body to the skin surface. The heating produces local vasodilatation and increases the permeability of the skin to O2 and CO2 According to the monitors specifications the in
vivo response time is decreased by higher electrode temperature. A temperature of 44°C was selected, since the application time would always be less than one and half hour.
The transducer membrane was inspected before each session and a new membrane was installed if trapped bubbles under the membrane were identified. The monitor was permanently placed in the same room. The skin was first cleaned with alcohol in order to reduce skin resistance. The electrode was held in place with a fixation ring placed on the inner side of the forearm approximately 2 inches below the elbow and allowed to equilibrate for at least 15 minutes. Blood gas values were read from the monitor screen
Ch apter Tw o: B o d y S w a y & H yp erven tila tio n
and recorded manually at baseline and every 30 sec during and after the hyperventilation (HV) until the full recovery of the subjects.
The electrodes were calibrated before each use using gases containing CO2 (at
concentration of 5%) and O2 (at 21%). Calibration was performed with a Cooming
Calibration Cylinder, Radiometer Copenhagen (type TCC3), (5% CO2; 12% N2; 83% O2).
The tc-pC02 was measured in kPa.
1. The typical stabilisation time according to the specifications o f the device for the subjects is 10-15 minutes for the tc-p02 reading and 3-7 minutes for the tc-pC02 Longer time was an indication of a possible incorrect attachment of the electrode or a poorly selected measurement site.
2. Artifacts due to subjects’ movements caused sudden changes in tension readings without any physiological cause.
In both cases a recalibration and reapplication of the electrode to the skin, selecting a new measuring site, was made.
2.2.1 Carbon dioxide and hyperventilation
According to Achenbach et al. (1994) standardization by observing the rate, depth, and consistency of the respiratory effort does not necessarily produce uniform changes in blood gases. For the purpose of recording the changes of the CO2 simultaneously with
the sway recordings, an objective measure was needed which would be accurate and robust enough to allow for continuous CO2 measurements without interfering with human
balance.
Chapter Tw o: B o d y S w a y & H yperven tila tio n
levels in neonates and adults within the physiological range from 40 to 100 mmHg (5 to 13 kPa) of PO2 and the physiological range from 30 to 80 mmHg (4 to 11 kPa) of pCOz
The above studies have proposed CO2 level as an objective measure of quantifying HV.
Nevertheless no good correlation has been found between the HV symptoms and the CO2
drop. Vansteenkiste et al. (1991) using the 3 minutes and 5 minutes end-tidal CO2
fraction ratio during recovery after the HV provocation test concluded that neither of two shows a good correlation with other diagnostic criteria. Rafferty et al. (1992) concluded that there was no influence of the rate of fall of the PCO2 on the threshold of the HV
symptoms.
What other researchers characterise as HV: Many previous studies have used Hardonk and Beumer (1979) criteria in order to characterise a situation as HV. According to these criteria HV was considered to be demonstrated if the CO2 level 3 minutes post voluntary
HV has not returned to within 66% of the resting level. Also, measurement of the % end tidal CO2 at rest and 3 minutes following completion of forced HV, allowed a ratio to be
derived (called the "slope"). If this slope was greater than or equal to 1.5 then a diagnosis o f HV was considered likely according the criteria of Hardonk and Beumer. Freeman et al (1986) in their study considered hypocapnia significant if either the end tidal PCO2 fell
to less than 66% of prechallenge levels, or whether the resting levels were at or below 30 mmHg, fell by more than 6 mmHg and persisted at this lower level spontaneously for at least 3 minutes.
Ch apter Tw o: B o d y S w a y & H yp erven tila tio n
2 3 INTRODUCTION
The aim of the studies reported in this chapter was to establish if HV has a destabilising effect on body sway and, if so, how is postural equilibrium restored. More specifically the studies performed were aimed at:
I providing an insight into whether postural responses changed immediately after HV (pilot study: paragraph 2.3);
II. a. examining differences in demand made upon functional equilibrium by HV periods of different duration,
b. investigating whether reduction in visual and/or somatosensory information has an effect on the HV induced unsteadiness,
c. assessing postural stability, combining the effects of HV with actively performed body movements,
d. evaluating the role of the vestibular system by examining the sway responses of patients with labyrinthine lesions (main study : paragraph 2.4).
2.3.1 Pilot Study
2.3.1.1 Introduction
This study was designed to explore whether the question of considering HV as an influencing parameter to postural control seem to have a valid basis and to determine a feasible experimental design in order to investigate the phenomenon and to foresee possible problems.
Ch apter Tw o: B o d y S w a y & H yp erven tila tio n
HV”. Howell (1990) reported his impression that 20 deep breaths were sufficient if symptoms were to be induced. Others (Hoes et al. 1987, de Ruiter et al. 1989 and Conway 1993) suggested the use of a more conservative 90 sec of voluntary HV, to be reasonably certain of producing the desired physiological changes.
Three main proposals were made concerning the optimal rate of breathing to induce HV. Breathe at one breath per sec (in most of the previous studies), breath at about 40 deep breaths/minute (Ley 1985) and breathe quickly and deeply (Conway 1993).
2.3.1.2 M aterial and Methods
Subjects: Five healthy subjects (2 male and 3 female, mean age 28.44 years, range 22 to 42, SD 7.25) participated in the study.
A pparatus: A force platform (AMTI, model OR6-3), linked through an AMTI signal amplifier, model SGA6-1, to a PC was used for the recordings of postural sway. Recordings were made at a sampling rate of 20 Hz. A self-adhesive, heated (44°C) membrane electrode (Radiometer Copenhagen, type TCM3) was attached to the skin on the inner side of the forearm approximately 2 inches below the elbow. The membrane was allowed to stabilize for at least 15 minutes before recordings were obtained. The electrode was calibrated before each usage using a Cooming Calibration Cylinder, Radiometer Copenhagen (type TCC3).
Experimental procedure: Subjects were asked to step on the platform with bare feet placed parallel if possible together and breathe as deeply and quickly as they could, at the rate that it was most convenient for them, until the experimenter would ask them to stop and breath normally. The attempt to use a sound paced breathing rate was very distracting and difficult to maintain during the whole HV period. Sway recordings would start immediately after the ’breathing’, instructing subjects to stand as still as possible. Sway recordings were of 45 sec duration each and were acquired following the 12 conditions below:
Ch a pter Tw o: B o d y S w a y & H yp erven tila tio n
1. Fixating on a 2 cm purple dot placed at eye-height and 50 cm directly in front of the subject.
2. Keeping the eyes closed, after staying in position on the force platform. 3-4. Similarly as in the above two conditions but standing on a rubber foam (11
cm height, 30 gr/dm^ density).
5-12. Repeating the above ’baseline’ conditions immediately after voluntary HV. Two different intervals of HV were used on each subject, 30 and 60 sec.
2.3.1.3 Results
By observing the raw platform traces for the 45 sec of the recording (an example of a single subject raw recordings in the anterior-posterior direction is given in Figure 2.3) it can be suggested that HV has an effect on sway which seems to be more intense during the first 30 sec of recording or less. This effect appeared to be reflected on all the parameters used for the description of the centre o f pressure movement, (Ym, Xm, L and Ao) as shown in Table 2.2. (One of the subjects participating in this study fell off the platform while trying to maintain his balance with his eyes open on the foam after HV. The eye closed on the foam testing were not performed in this subject).
Ch a p t e r 'FwO : Body Sway & Hyperventilation
Torque (Y axis)
Baseline
After
30 sec HV
After
60 sec HV
5 N-m
5 sec
Figure 2.3: Example o f raw data. Torque (Nm) in the sagittal plane as a function o f time, from top to bottom: baseline (no HV), after 30 sec HV and after 60 sec HV Note that the main effect o f HV seems to be during the first 30 sec, up to dotted line
Ch a p t e r 1 \v o: Body Sway & Hyperventilalion
X Direction Y Direction
e
.2
0.6
>
(D
g 0.4
(U
2
0.2
A0.0
30 60
0
300
60Hyperventilation Time (sec)
—O— Sub 1 - O - Sub 2 —A - - Sub 3 Sub 4 O Sub 5
.2
0.6
— A —
-—
Sub 1 Sub 2 Sub 3 Sub 4 Sub 5
1--- 1--- 1---1--- r
30 60 0 30 60
Hyperventilation Time (sec)
Figure 2.4 : Mean deviation (cm) of the centre o f foot pressure o f individual subjects in the lateral (X) and the anterior-posterior (Y) directions (left and right hand side o f the plots respectively). Recordings o f 45 sec (a) with eyes open and (b) with eyes closed