Kidney Images Classification Using Cuckoo
Search Algorithm And Artificial Neural Network
S.M.K.Chaitanya, P.Rajesh Kumar
ABSTRACT: Ultrasound (US) imaging is used to provide the structural abnormalities like stones, infections and cysts for kidney diagnosis and also produces information about kidney functions. The goal of this work is to classify the kidney images using US according to relevant features selection. In this work, images of a kidney are classified as abnormal images by pre-processing (i.e. grey-scale conversion), generate region-of-interest, extracting the features as multi-scale wavelet-based Gabor method, Cuckoo Search (CS) for optimization and Artificial Neural Network (ANN). The CS-ANN method is simulated on the platform of MATLAB and these results are evaluated and contrasted. The outcome of these results proved that the CS-ANNN had 93% specificity and 88% accuracy. By comparing it with the existing methods, the CS-ANN achieved 0% false-acceptance rate.
Keywords: Kidney diagnosis, Gabor feature extraction, Cuckoo search, Artificial Neural Network, Ultrasound images.
————————————————————
I.
INTRODUCTION
The major and fundamental problem in many medical image analysis tasks is creating the correspondence between the images[1]. The diagnosis of a disease can be affected by any error in medical imaging. Hence, the difficult task in medical field is to find the accurate identification of images for classification. The medical examinations and numerous data are collected from clinical trials for ensuring the statistical significance of studies. The laboratory results and clinical analyses collected from datasets is useful for quality control, investigation of medical research, studies on epidemiology and so on [2,3]. Various imaging implications and technologies are covered by vast medical imaging such as X-ray-based methods in optical imaging. Sonography also called US is used for producing pictures inside the body by exposing the body parts to high frequencies. The diagnosis and therapeutic procedures are made by invasive imaging technology which is offered by US. The scanning of US is used to scan the organs of the body like gallbladder, bladder, liver, ovaries, spleen, kidneys, pancreas, uterus and fetus in pregnant patients [4,5]. The complex geometric problems are solved by some effective algorithms like three-dimensional (3D) modelling, sharp extraction and classification method in medical image processing. The typical geometric problems can be identified by contour data points which connects a proper surface [6,7].Segmenting the medical images is considered as a basis of analysing and understanding the images in medical field [8]. In recent years, many software tools are available for segmentation in both open-source and commercial purpose. But the open-source software cannot support the parallel image processing [9]. Therefore, more number of existing methods use either combining the low-level features or discarding the set of features for classification [10,11]. In this work, the kidney images are trained and tested for classifying the images as normal or abnormal images. The images are segmented and the features are extracted by Gabor feature extraction method and these extracted features are selected by using CS-ANN method. The experiments were conducted on MATLAB and the performance of the method wasevaluated by metrics such as Accuracy (Acc), Sensitivity (Sen) and Specificity (Spec). The remaining paper consists of Section II describes the
survey of the existing methods used for segmenting the kidney images, Section III describes the problem definition, Section IV represents the proposed methodology, Section V validates the experimental results and the conclusion was made on Section VI.
II.
LITERATURE REVIEW
were selected for the classification task with the help of differential evolution feature selection. The average accuracy was obtained by Runlength matrix features from ROIs of images that were pre-processed by Lee’s sigma. The outcome of the results indicated the outperformance of the proposed system. S. A. Tuncer, and A. Alkan, [15] detected a renal cancer using cell cancer tissues and abdominal images by implementing decision support system. The cancer detection system contained two major stages such as segmenting the tissues and detecting the cancer. Clustering algorithm was used to segmenting the kidney area which was considered as a first step. The identification of renal cell cancer was made by classifying these feature vectors with the help of SVM in the second step process. The Dice coefficient was used to measure the segmentation success, the method obtained 89.3% as coefficient of Dice. But the results were gained from the many organs on the abdominal images, which was difficult to isolate the kidneys alone. K. D. Krishna, et al., [16] developed an algorithm that depends on FPGA for abnormality detection of kidney in ultrasound images. The algorithm followed these steps for classification as pre-processing, de-noising the ultrasound images and ROI was segmented. The features such as Haralick and intensity histogram were collected from the kidney images after segmentation. The classification algorithm was developed in two stages based on feature extraction. The difference between normal and abnormal kidney images was identified by using Look Up Table (LUT) based approach which was considered as first stage. After the confirmation of abnormality, SVM with multi-layer perceptron classifier was used to identify the presence of cyst with the help of extracted features in kidney in the second stage.The method helped radiologist for suggesting immediate precaution and monitoring disease progression. To overcome the above issues, the proposed method implemented the feature extraction algorithm and classifier for segmenting and classifying the kidney images.
III.
PROBLEM DEFINITION
An automated system is developed for the diagnosis of kidney diseases by using ultrasonic systems in the recent years. During imaging, the system allows the extraction of vast data and good quality of information to detect the diseases. The evaluation of global conditions can be made by the process of feature extraction, analysis of images and classify the images by pattern recognition techniques. But still, no technique had improved the accuracy of the system or proved to be best in accuracy for classifying the kidney diseases. Therefore, the classification accuracy will be improved with the help of improving the existing pre-processing as well as classification models. This above mentioned limitations and the lack of solutions motivated this research work.
IV.
PROPOSED METHODOLOGY
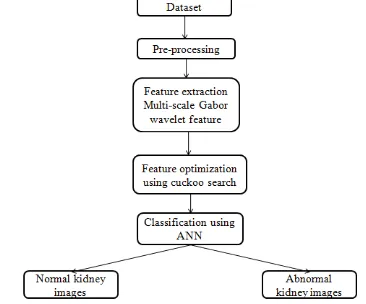
In this work, the accuracy of the classification results can be improved by implementing the computer-aided system for classifying the normal and abnormal US kidney images according to extraction of features and classification methods. The proposed method involves extracting the features based on multi-scale wavelet and classifying the images with the help of ANN in which the parameters are optimally chosen through CS. In first step, the multi-scale wavelet features are extracted from ROI of each image. The ANN is used for classifying the kidney images through extracted features and provides better classification by combining with CS algorithm. Figure 1 details the basic structure of feed based abnormality classification method.
Figure 1: Basic structure of proposed methodology
A. Preprocessing:
The CS-ANN method is pre-processing the kidney images which are considered as the first step. The unwanted noise components in the images are removed by using pre-processing. The CS-ANN method uses the colour-to-gray conversion for reducing the complexity. At last, the interference of irrelevant regions is reduced by using ROI generation.
B. Extracting the features:
The selected features represent the uniqueness of the images for defining a class. In this work, the Gabor features are extracted to classify the kidney images. The extraction of features from many frequencies or scales is aligned at different angles with the help of Gabor filtering. The wavelet decomposed images are used for evaluating the Gabor features. The Eq. (1) describes the Gabor filter as:
( )
∏ (
)
(1)
orientation. Here, the six different orientations and four different wavelengths are used for extracting the features. The Eq. (2) and (3) summarizes the parameters and ,
(2)
(3)
From the Gabor filter, ( ), the Gabor features can be extracted as( ) ( ) ( )
(4)
The six orientations and four different central frequencies are evaluated by the Gabor features and produce 24 features for every decomposition of kidney images. According to the extracted features, the classification of normal or abnormal images is a tedious process. Therefore, reducing the features must be carried out for better classification accuracy. In this proposed work, Probabilistic Principal Component Analysis (PPCA) is used for selecting the best features.
C. Feature selection:
The most challenging task is to select the correct number of features for better classification. The problem of over-extraction and under-extraction can be formed by an incorrect choice. PPCA is an effective tool for reducing the data set dimension and also allows reconstruction of the optimal shape. While retaining most of the variations, the dataset contains vast number of interrelated variables. For reducing the feature dimension, projection vectors are used which contribute to highest covariance.In this work, K-eigenvectors are selected from the feature input by PPCA for choosing the best features from the whole extraction of features.
D. Feature optimization:
The CS algorithm is implemented according to the reproduction of cuckoo birds. The potential solutions are associated with the cuckoo eggs. Normally, cuckoo produces their eggs in other cuckoo’s nests and believed that their off-springs are raised by proxy parents. Sometimes, when the proxy parents know that their nests does not belong to them, the foreign eggs are thrown out of the nests or the whole nest will be destroyed. According to three rules, the CS algorithm is described as:
1) The nests are randomly selected and each cuckoo produces one egg in selected nests. 2) The high quality of eggs from the best nests
will lead to the next generation.
3) For a fixed number of nests, the probability is [0,1] for finding the foreign egg by host cuckoo. In such a case, the cuckoo can have three possibilities such as throwing the foreign eggs, destroy the nest and build a new nests somewhere else.
The use of CS algorithm maintains a balance between global random walk and local random walk and CS algorithm is considered as one of the efficient algorithms for global optimisation problems. Switching parameter is used to control the balance between these random walks. The local and global random walks are defined by Equations 5 and 6, respectively.
(
) (
)
(5)
( )
(6)
Where is the next position,
(
)
gives current position selected by random permutation,is step
wise,
entry-wise product of two vectors, is Positive step size scaling factor, used to switch between local and global random walks, is heavy-side function, is random number from uniform distribution,( )
Levy distribution. In this work, CS computes the minimum values of Mean Square Error as fitness values.E. Classification:
The finding of patterns and the computation method for data is referred as Classification, which is used to train the tumour images using ANN. The simple components are interconnected with each other in Neural Network which consists of neurons and having the similar property of biological neurons. The output obtained from neurons as a function of
( )
input vector( )
is shown below:∑
(7)
The Weighted sum
( )
and corresponding neurons are contained in a multilayer perception network. The information flows in a direction along all the connecting paths in ANN method. The hidden layer without feedback is used to pass information from input to output. According to the gradient descent, back propagation is used for calculating the derivative performance with respect to each bias variable and weight is adjusted.V.
RESULTS AND DISCUSSION
The CS-ANN algorithm is evaluated with the help of MATLAB software using a system with 4 GB RAM and 2.10 GHz Intel i-3 processor. In this section, the experiments were conducted for analysing the performance of the CS-ANN with other existing works such as ANN, GA-ANN, KNN and Bayes algorithm. According to various factors, the prediction efficiency is measured.
A. Database description:
classes such as kidney with stone and kidney without stone. The major parts include the Training set (), Test set (), and Validation data () for finding the classification accuracy of the machine-learning algorithm. The trails categorizes the test set into class 0 or 1 for the ANN classification system. The figure 1 describes the normal and abnormal kidney images from UCI database.
Figure 2: a) Normal kidney image b) Kidney with cyst
c) kidney with stone
B. Performance Parameters:
In this section, the outcome of the proposed method is evaluated by different parameters such as accuracy, sensitivity, specificity, False Positive Rate (FPR) and False Negative Rate (FNR). The metrics are used for this parameters are described as True Positive (TP), True Negative (TN), False Positive (FP), False Negative (FN).
Sensitivity: Sensitivity is described in Eq. (8) as ratio of TP number to the addition of both TP and FN.
(8)
Specificity: This parameter can be explained as the ratio of total number of TN to the total number of both TN and TS in Eq. (9)
(9)
Accuracy: By using the measure of sensitivity and specificity, accuracy can be evaluated. This measurement can be explained in the following Eq. (10).
(10)
False-positive rate: FPR is used to predict the proportion of all negative outcomes produces the positive test outcomes which is described in Eq. (11). In addition, the FPR is also represents as false-acceptance rate (FAR).
(11)
False-negative rate: The negative test outcomes are yielded by the proportion of positive outcomes that are explained in Eq. (12). Moreover, the false-rejection rate (FRR) is the other name of FNR.
(12)
C. Performance Analysis:
In the following section, various existing methods are compared with the CS-ANN method for validating the performance results in kidney image classification. The method considered half of the data for training and remaining half for the testing process (i.e. 50-50 sample data). Table 1 describes the values of various metrics for the CS-ANN with existing methodologies.
Table 1: The values of Confusion Matrix of Proposed with Existing methods
The proposed CS-ANNapproach has low FP and FN compared to the existing methodologies that are described in Table 1. The parameter values such as accuracy, specificity and sensitivity are computed in Table 2. Some of the techniques like KNN and Bayes algorithm achieved 100% specificity that is reported in Table 2. This shows the effectiveness of the proposed method in classifying the normal or abnormal images of kidney.
Table 2: The values of several parameters of Proposed and Existing Methods.
By calculating the accuracy classification, the CS-ANN achieved 87.05%, whereas Bayes and KNN, PSO got 81% accuracy and 56% is achieved by GA-ANN and ANN. The overall performance of the CS-ANN is better in terms of Sen, Spec, Acc. and the proposed CS-ANN algorithm results are represented in Table 3.
Table 3: Comparison of CS-ANN and Existing State-of-the-Art Methods.
Metrics ANN GA+ANN KNN Navie Bayes
PSO+ANN CS+ANN
FRR 1 0.6667 1 1 0.33333 0.3333
FAR 0.3076 0.38461 0 0 0.15385 0.076923
Performance Measure
ANN GA+ANN KNN Naive Bayes
PSO+ANN CS+ANN
ACC 0.5625 0.5625 0.8125 0.8125 0.8125 0.875
SPEC 0.692308 0.615385 1 1 0.8461 0.923
SEN 0 0.333333 0 0 0.6667 0.6667
PERFORM -ANCE MEASURE
ANN GA+ANN KNN NAIVE BAYES
PSO+A
NN CS+AN
N
TP 0 1 0 0
2 2
TN 9 8 13 13 11 12
FP 4 5 0 0 2 1
From the tables, the values clearly explain that the proposed approach outperforms the various existing methods such as ANN, GA-ANN, KNN, Navie Bayes. The values of FRR and FAR are also stated that the proposed approach CS-FFBN performed well.
The experimental results of Accuracy, Sensitivity and Specificity are shown in the Fig. 3, Fig. 4 and Fig. 5 respectively.
Figure 3: Accuracy values
While analyzing classification accuracy values, the proposed Cs-based ANN provides 87%, whereas PSO-ANN gives 81%, GA-PSO-ANN and PSO-ANN give 56% and KNN and Naive Bayes give 81%.
Figure 4: Sensitivity values
While analyzing classification sensitivity values, the proposed CS-based ANN provides 66%, whereas PSO-ANN gives 66% GA-ANN gives 33% and ANN, KNN and Naive Bayes gives 0%.
Figure 5: Specificity values
While analyzing classification specificity values, the proposed CS-based ANN provides 92% PSO ANN gives 84%, whereas GA-ANN gives 61%, ANN gives 69%, KNN and Naive Bayes gives 100%.
VI.
CONCLUSIONIn this approach, to classify the US kidney images, an effective abnormality classification method based ANN is presented. The achievement of both proposed CS-ANN approach and existing methods are evaluated by using metrics such as Acc, Spec, Sen for abnormal classification. The accuracy obtained by the proposed CS-ANN method is around 87%, whereas the existing methods offers less than proposed one. The
FAR values are not less than 27
% in existing methods, but the proposed method obtains 0% in FAR values. From the results, it is clear that the proposed ANN works better than all other existing methods for classifying the kidney images. In the future, multi-label classification will be considered rather than normal/abnormal characterization to examine the discriminative power of our approach for each sort of pathology.
REFERENCES
[1]. F. Kanavati, T. Tong, K. Misawa, M. Fujiwara, K. Mori, D. Rueckert, and B. Glocker, “Supervoxel classification forests for estimating pairwise image correspondences.,” Pattern
Recognition, vol. 63, pp. 561-569, 2017.
[2]. A. Eklund, P. Dufort, D. Forsberg and S. M. La Conte, “Medical image processing on the GPU – past, present and future,” Med. Image Anal., vol. 17, pp. 1073–1094, 2013.
[3]. O. Reiche, K. Häublein, M. Reichenbach, M. Schmid, F. Hannig, J. Teich and D. Fey, “Synthesis and optimization of image processing accelerators using domain knowledge,” J.
Syst. Architect., vol. 61, pp. 646–658, 2015.
[4]. A. K. Sharma, N. D. Toussaint, G. J. Elder, R. Masterson, S. G. Holt, P. L. Robertson, and C. S. Rajapakse, “Magnetic
resonance imaging based assessment of bone microstructure as a non-invasive alternative to histomorphometry in patients with chronic kidney disease,” Bone, 2018.
0 0.2 0.4 0.6 0.8 1
Accuracy
Accuracy
0 0.2 0.4 0.6 0.8
Sensitivity
Sensitivity
0 0.2 0.4 0.6 0.8 1 1.2
Specificity
[5]. A. Razik, C. J. Das, and S. Sharma, "Angiomyolipoma of the Kidneys: Current Perspectives and Challenges in Diagnostic Imaging and Image-Guided Therapy," Current problems in diagnostic radiology 2018.
[6]. A. Świetlicka, “Trained stochastic model of biological neural
network used in image processing task,” Appl. Math. Comput,
vol. 267, pp. 716–726, 2015.
[7]. J. Tian, J. Xue, Y. Dai, J. Chen and J. Zheng, “A novel
software platform for medical image processing and analyzing,” IEEE Trans. Inf. Technol. Biomed, vol. 12, pp.
800–812, 2008.
[8]. C. S. Gur and M. Top, “Regional clustering of medical imaging technologies,” Comput. Hum. Behav., vol. 61, pp. 333–343,
2016.
[9]. F. Rengier, M. F. Häfnerb, R. Unterhinninghofenc, R.
Nawrotzkid, J. Kirsch, H.-U.Kauczor and F. L. Giesel, “Integration of interactive three-dimensional image
post-processing software into undergraduate radiology education
effectively improves diagnostic skills and visual-spatial ability,” Eur. J. Radiol, vol. 82, pp. 1366–1371, 2013.
[10].L. Sajn and M. Kukar, “Image processing and machine learning
for fully automated probabilistic evaluation of medical images,” Comput.Methods Prog.Biomed, vol. 104, pp. e75–
e86, 2011.
[11].F. Zhao, J. Zhao, W. Zhao, F. Qu and L. Sui, “Local region
statistics combining multi-parameter intensity fitting module
for medical image segmentation with intensity in homogeneity and complex composition,” Optics Laser Technol, vol. 82, pp.
17–27, 2016.
[12].J. Serrat, F. Lumbreras, F. Blanco, M. Valiente, and M. López-Mesas, “myStone: A system for automatic kidney stone classification,” Expert Systems with Applications, vol. 89, pp.
41-51, 2017.
[13].J. Verma, M. Nath, P. Tripathi, and K. K. Saini, “Analysis and identification of kidney stone using Kth nearest neighbour (KNN) and support vector machine (SVM) classification techniques,” Pattern Recognition and Image Analysis, vol. 27,
no. 3, pp. 574-580, 2017.
[14].M. B. Subramanya, V. Kumar, S. Mukherjee, and M. Saini, “SVM-based CAC system for B-mode kidney ultrasound images,” Journal of digital imaging, vol. 28, no. 4, pp.
448-458, 2015.
[15].S. A. Tuncer, and A. Alkan, "A decision support system for detection of the renal cell cancer in the kidney." Measurement vol. 123, pp. 298-303, 2018.
[16].K. D. Krishna, V. Akkala, R. Bharath, P. Rajalakshmi, A. M. Mohammed, S. N. Merchant, and U. B. Desai, “Computer
aided abnormality detection for kidney on FPGA based IoT enabled portable ultrasound imaging system,” Irbm, vol. 37, no. 4, pp. 189-197, 2016.
AUTHORS PROFILE
S.M.K.Chaitanya received the B.Tech. degree in E.C.E. from JNTU-K. andM.Tech. degree from JNTU-K, Kakinada, AP, India. He has 11years of teaching experience and he is an Assistant Professor of ECE Department, G.V.P.College of Engineering (Autonomous), Visakhapatnam. His researchinterests include medical image processing and image segmentation and Embedded systems