Proc. IAHS, 379, 217–222, 2018
https://doi.org/10.5194/piahs-379-217-2018 © Author(s) 2018. This work is distributed under the Creative Commons Attribution 4.0 License.
Open Access
v
ativ
e
w
ater
resources
management
–
understanding
and
balancing
inter
actions
betw
een
humankind
and
n
ature
Predicting future land cover change and its impact
on streamflow and sediment load in a
trans-boundary river basin
Jie Wang1, Hao Wang2, Shaowei Ning3, and Ishidaira Hiroshi4
1School of Hydrology and Water Resources, Nanjing University of Information Science & Technology, Nanjing, 210044, China
2School of Resource and Geosciences, China University of Mining and Technology, Xuzhou, 221116, China
3HeFei University of Technology, Hefei, 230009, China
4International Research Center for River Basin Environment, University of Yamanashi, Kofu, 4008511, Japan
Correspondence:Jie Wang ([email protected])
Received: 30 December 2017 – Revised: 30 March 2018 – Accepted: 12 April 2018 – Published: 5 June 2018
Abstract. Sediment load can provide very important perspective on erosion of river basin. The changes of
human-induced vegetation cover, such as deforestation or afforestation, affect sediment yield process of a catch-ment. We have already evaluated that climate change and land cover change changed the historical streamflow and sediment yield, and land cover change is the main factor in Red river basin. But future streamflow and sedi-ment yield changes under potential future land cover change scenario still have not been evaluated. For this pur-pose, future scenario of land cover change is developed based on historical land cover changes and land change model (LCM). In addition, future leaf area index (LAI) is simulated by ecological model (Biome-BGC) based on future land cover scenario. Then future scenarios of land cover change and LAI are used to drive hydrological model and new sediment rating curve. The results of this research provide information that decision-makers need in order to promote water resources planning efforts. Besides that, this study also contributes a basic framework for assessing climate change impacts on streamflow and sediment yield that can be applied in the other basins around the world.
1 Introduction
Studies on hydrological processes in a changing environment have been the focus of hydrological science in the 21st cen-tury. The geographic extent of land cover change worldwide has undergone tremendous change in the past years. It has been pointed out land cover change is a major driving force in degradation of natural environment, such as more frequent incidents of local flooding, increasing soil erosion (García-Ruiz et al., 2008).
The research of the impact of land cover change on hy-drological condition of the catchment area has therefore re-ceived increasing considerable attention from both field ob-servations and model simulations (Brown et al., 2005).
How-ever, most studies have been performed on the impact of land cover change on streamflow (Zheng et al., 2009) or sediment yield itself (Leh et al., 2013), few researches were related to impact of land use change on both streamflow and sediment load (Tang et al., 2011; Dao and Suetsugi, 2014). Conse-quently, it is of great importance to predict future land cover change and its effects on combined streamflow and sediment flow in an effort to optimize the use of water resources and prevent reservoir siltation in Red river basin.
Figure 1.Location of DRB and the hydro-meteorological stations.
-5 -4 -3 -2 -1 0 1 2 3 4 5
Urban Croplands Wetlands Grasslands Shrublands Forest Water
Figure 2.Net land cover changes between 2001 and 2008.
And future leaf area index (LAI) is simulated by ecological model based on the future land cover scenario. Then future land cover change scenario is used to drive a distributed hy-drological model to forecast the impact of the predicted land use change on streamflow. And scenarios of future land cover change and LAI and new sediment rating curve model to as-sess the impact of the future land use change on sediment load into Hoabinh reservoir. A methodology is developed in which the land change model and ecological model are cou-pled with a calibrated a distributed hydrological model and sediment simulation model. This coupling is new and essen-tial for evaluating effects of land cover change on streamflow and sediment load, required for providing information that decision-makers need in order to promote water resources planning efforts.
2 Study Area and Data Description
2.1 Study Area Description
The Da River Basin (DRB) located in humid region is the biggest branch of the Red River which gets its name from the reddish-brown color caused by its high sediment load rich in iron dioxide. The DRB drains 55 000 km2, origi-nates in Yunnan Province, China (Fig. 1). The river cross sections are narrow, with a steep slope of 0.37. The an-nual mean runoff is about 1168 m3s−1 from 1988 to 2004 at Laichau station, associated with the total annual sediment load about 40.1×10⁶t yr−1. The Da River basin is
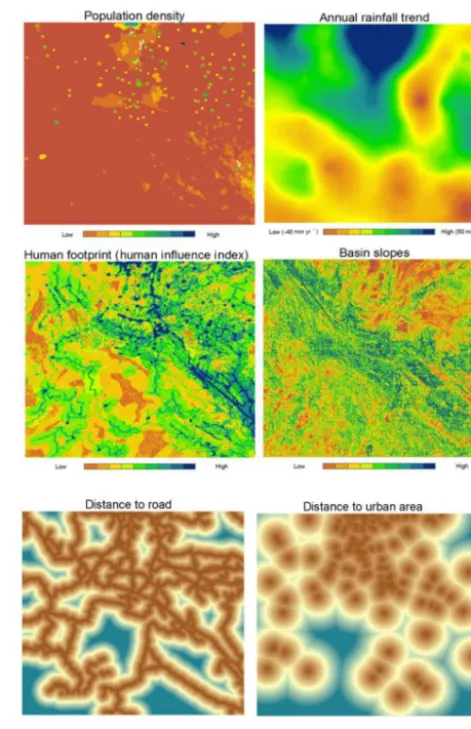
charac-Figure 3.Selected drive factors for LCM.
terized by a tropical monsoonal. Summer season is warm and humid, whereas the winter season is cool and dry (Le et al., 2007; Dang et al., 2010). The annual mean rainfall is about 1320 mm for the Da River basin, 85 % of which falls during wet rainy season. The HoaBinh reservoir, lo-cated on the downstream of Laichau station, is one of the largest (V =9.5 km3) and highest (120 m) dams in South-East Asia. It was completely finished in 1993, with the main purpose of flood control, irrigation and hydropower genera-tion (Le et al., 2007).
2.2 Dataset Description
calcula-Table 1.Dataset summary for different models in the study.
Models Spatial dataset Point dataset Hydrological model Elevation, land cover, soil map Rainfall, streamflow New sediment rating
curve
Streamflow, LAI, SSC
Land change model Elevation, land cover, population density, road, river network, slope, human footprint, rainfall trend
No need
Ecological model Elevation, land cover, soil map Rainfall, maximum and minimum temperature
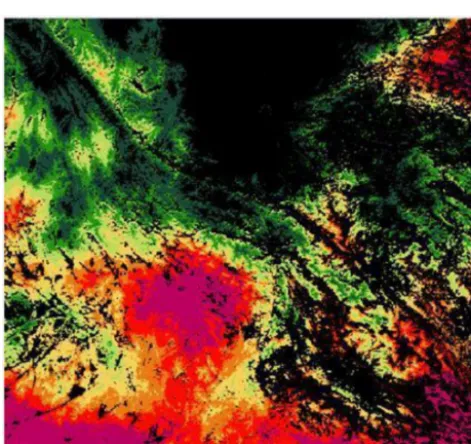
Figure 4.Potential map for transition from forest to croplands.
Table 2. Difference between the reference map of 2011 and the simulated map 2011.
Land Reference Simulated Error Kappa cover type 2011 (pix) 2011 (pix) percent (%) index Water 869 842 −3.1
Forest 184 701 177 657 −3.8 Shrublands 60 433 69 411 14.8
Grasslands 10 743 9126 −15.0 0.94 Wetlands 825 896 8.6
Croplands 58 871 58 403 −0.8 Urban 1618 1725 6.6
tion. A series of geographical datasets (e.g., DEM, LAI, land cover type) were also employed in ecological simulation, hy-drological simulation and land change prediction, summa-rized in this study (Table 1).
Figure 5.Land cover map of 2001 (basin line) and 2050 (pre-dicted).
3 Methodology
In this study, a group of models coupled in a “one-way” man-ner framework were applied. Firstly, the Land Change Mod-eler (LCM) was used to predict future the land cover change in the year of 2050. LCM is a powerful tool to predict future land cover change scenarios and was widely applied (Wilson and Weng, 2011). More technical details of this model could be found in the reference (Clark Labs, 2009). Then, Biome-BGC was also applied to calculate the potential LAI under future land cover changes. In our previous work, we have al-ready described it in detailed and validated this model well in DRB (Wang and Ishidaira, 2013). So in this research this val-idated Biome-BGC model would be applied to predict future LAI under future land cover scenario directly.
simu-Table 3.Future land cover changes of 2050 created through neural networks compared with the baseline map of 2001 image in DRB (area percent: %).
Land Baseline Predicted Changes cover 2001 (%) 2050 (%) (%) Water 0.06 0.05 −0.01 Forest 70.91 49.57 −21.34 Shrublands 15.5 25.47 9.97 Grasslands 0.72 0.16 −0.56 Wetlands 0.19 0.34 0.15 Croplands 12.57 24.27 11.7 Urban 0.06 0.14 0.08
0 0.2 0.4 0.6 0.8 1
Jan Feb Mar Apr May Jun Jul Aug Sep Oct Nov Dec
MLai1991–2000 Mlai2046–2055
Figure 6. Comparison between current average LAI (Mlai1991−2000) and future average LAI (Mlai2046−2055).
lation result in several Asian basins (Wang et al., 2013; Wang and Ishidaira, 2013), was used to simulate SSC in DRB.
4 Results
4.1 Future land cover and LAI prediction
Land cover changes between year of 2001 and 2008 were cal-culated firstly by land change modeller, which showed that cropland increased and forest decreased obviously. So the in-crease in cropland mainly came from forest changes (Fig. 2). In addition, six driving factors (Fig. 3) which may affect land cover changes and land cover changes obtained above were introduced to build up potential land cover transition maps by multi-layer perceptron neural network method. For example, transition possibilities map from forest to croplands in Fig. 4 shows that there is a high possibility in the bottom and center of our basin.
Land cover map of 2011 simulated by LCM based on po-tential land cover transition maps showed an agreement spa-tially with actual land cover map of 2011. Additionally, high kappa index (Jensen, 1996) and low mean error between sim-ulated and observed land cover maps in 2011 was calcsim-ulated (Table 2), which indicated that simulated map had a good match with the reference one. So LCM was proved to have the ability to simulate land cover changes well, then we ap-ply it to predict future land cover map of 2050 (Fig. 5 and
Ta-0 5000 10 000 15 000 20 000 25 000
1991 1992 1993 1994 1995 1996 1997 1998 1999 2000
Qobs Qsim
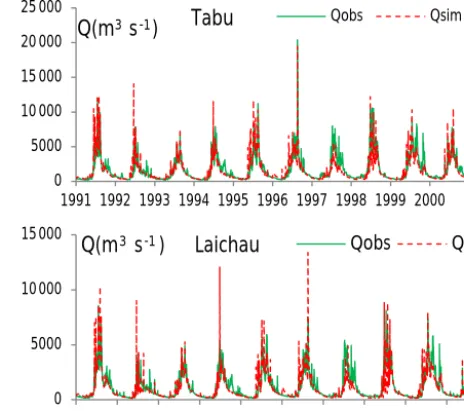
Q(m3 s ) Tabu
0 5000 10 000 15 000
1991 1992 1993 1994 1995 1996 1997 1998 1999 2000 Qobs Qsim
Q(m3 s ) Laichau -1
-1
Figure 7.Comparison of observed and simulated daily stream-flow in the DRB (calibration period: 1991–1995, validation period: 1996–2000).
Table 4.Evaluation of model simulation during the baseline period for the catchments controlled by Laichau and Tabu stations in the DRB.
Laichau Tabu
Calibration Validation Calibration Validation
NSE 0.75 0.70 0.70 0.60
R2 0.83 0.77 0.76 0.72
MAE (mm) 0.74 0.80 0.77 0.91 PBIAS (%) 6.2 7.2 7.0 7.8
ble 3). Comparison of the land cover maps for 2001 and 2050 reveals that that forest area would have an obvious decrease of about 26 % and croplands have an increase of 11.7 % in 2050 compared with 2001.
Finally, Biome-BGC model which has already been val-idated well in DRB (Wang and Ishidaira, 2013) was driven by future land cover of 2050 to predict future LAI in the pe-riod of 2046 to 2055. Results (Fig. 6) showed that future LAI would decrease especially for dry season due to deforesta-tion.
4.2 Hydrological and sediment simulation
Table 5.Performance of sediment simulation model for Laichau.
Catchment R2 MAE (g m−3) PBIAS (%) Laichau 0.894 3.23 0.524
0 5 10 15
Jau Feb Mar Apr May Jun Ju
l
Aug Sep Oct Nov De
c We t Dr y An n u al
Tabu Laichau
C h an ge s ( %)
Figure 8.Changes in streamflow under land cover change in 2050 at Laichau and Tabu station.
4.3 Future land cover change impacts
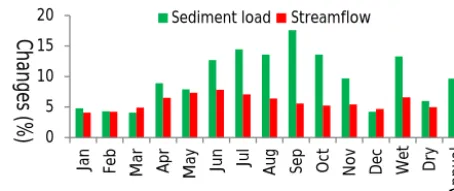
Predicted land cover map, LAI data and fixing the climatic conditions were used to drive the validated hydrological and sediment simulation models to investigate future land cover change impacts on streamflow and sediment load. Changes in streamflow in upstream and downstream are illustrated in Fig. 8, which indicate that land cover change affect stream-flow stronger in the downstream of DRB. As shown in Fig. 9, the effects of future land cover change would increase sed-iment load by 9.6 %, while the change rates in streamflow were within 5.7 %. Sediment load was found more sensitive to land cover change than streamflow. As for seasonally vari-ations of stream flow and sediment load caused by land cover changes, changes in streamflow and sediment load were more pronounced during the wet season.
Other factors such as model parameters may lead to not realistic results in our study. To reduce uncertainty in model simulation, more field observations should be done.
5 Conclusions
In this study, one framework to evaluate future land cover change effects on streamflow and sediment load was devel-oped and successfully applied in Da River Basin. Generally, the streamflow and sediment yield will increase in 2050s under land cover change. Streamflow and sediment load in-crease in 2050s emphasize the importance of building adap-tation to land cover changes to avoid flood and soil erosion. The results obtained in this study could be useful for the ap-propriate utilization of water resources, flood control, soil conservation and ecological protection in this region by en-hancing the understanding of the impact of land cover change scenarios on streamflow and sediment yield.
0 5 10 15 20
Jan Feb Mar Apr May Ju
n
Ju
l
Aug Sep Oct No
v De c We t Dr y An n u al
Sediment load Streamflow
C h an ge s ( % )
Figure 9.Changes in streamflow and sediment load under land cover changes in 2050 at Laichau station.
Data availability. 1. Daily meteorological and hydrological data from 1991 to 2000 were obtained from the hydrological stations and precipitation stations from China Meteorological Data Sharing Service Center and Vietnam Academy of Science and Technology which is considered confidential.
2. Digital elevation data (GTOPO30) is obtained from the flowing URL: https://lta.cr.usgs.gov/GTOPO30 (last access: 16 May 2017)
3. Soil type data is obtained from the flowing URL: http://www. fao.org/soils-portal/soil-survey/soil-maps-and-databases/ harmonized-world-soil-database-v12 (last access: 15 Decem-ber 2017)
4. Land cover data from 2001 to 2011 is obtained from the flow-ing URL: https://modis-land.gsfc.nasa.gov/ (last access: 10 June 2017)
5. Global roads dataset and global Human Footprint (HF) are obtained from the flowing URL: http://sedac.ciesin.columbia. edu/ (last access: 15 June 2017)
6. Monthly TRMM satellite rainfall data (TRMM_3A12) are obtained from the flowing URL: https://pmm.nasa.gov/ data-access/downloads/trmm (last access: 15 May 2017).
Competing interests. The authors declare that they have no con-flict of interest.
Special issue statement. This article is part of the special issue “Innovative water resources management – understanding and bal-ancing interactions between humankind and nature”. It is a result of the 8th International Water Resources Management Conference of ICWRS, Beijing, China, 13–15 June 2018.
Acknowledgements. This research was supported by the Na-tional Natural Science Foundation of China (Grant No. 41501029) and the Startup Foundation for Introducing Talent of NUIST. The authors are also thankful to China Meteorological Data Sharing Service Center for providing the hydro-meteorological data. Edited by: Depeng Zuo
References
Ao, T., Takeuchi, T., Ishidaira, H., Yoshitani, J., and Fukami, K.: Development and application of a new algorithm for automated pits removal for grid DEMs, Hydrol. Sci. J., 48, 985–997, 2003. Brown, A. E., Zhang, L., Mcmahon, T. A., Western, A. W., and Vertessy, R. A.: A review of paired catchment studies for deter-mining changes in water yield resulting from alterations in vege-tation, J. Hydrol., 310, 28–61, 2005.
CIESIN: Center for International Earth Science Information Net-work, Columbia University, Environmental Treaties and Re-source Indicators (ENTRI) Query Service, Palisades, NY: NASA Socioeconomic Data and Applications Center (SEDAC), avail-able at: http://sedac.ciesin.columbia.edu (last access: 15 June 2017), 2013.
Clark Labs: The Land Change Modeler for Ecological Sustainabil-ity, IDRISI Focus Paper, Clark UniversSustainabil-ity, Worcester, MA, 2009. Dang, T. H., Coynel, A., Orange, D., Blanc, G., Etcheber, H., and Lan, A. L.: Long-term monitoring (1960–2008) of the river-sediment transport in the Red River Watershed (Vietnam): tem-poral variability and dam-reservoir impact, Sci. Total Environ., 408, 4654–4664, 2010.
Dao, N. K. and Suetsugi, T.: The responses of hydrological pro-cesses and sediment yield to land-use and climate change in the Be River Catchment, Vietnam, Hydrol. Process., 28, 640–652, 2014.
FAO: FAO/UNESCO Soil Map of the World, avail-able at: http://www.fao.org/soils-portal/soil-survey/ soil-maps-and-databases/harmonized-world-soil-database-v12 (last access: 15 Dec 2017), 2011.
García-Ruiz, J. M., Regüés, D., Alvera, B., Lana-Renault, N., Serrano-Muela, P., Nadal-Romero, E., Navas, A., Latron, J., Martí-Bono, C., and Arnáez, J.: Flood generation and sedi-ment transport in experisedi-mental catchsedi-ments affected by land use changes in the Central Pyrenees, J. Hydrol., 356, 245–260, 2008. Huffman, G., Bolvin, D., Braithwaite, D., Hsu, K., Joyce, R., and NASA’s Precipitation Processing Center: 3B42 RT Derived Daily Product, version 7, available at: https://pmm.nasa.gov/ data-access/downloads/trmm (last access: 15 May 2017), 2015. Jensen, J. R.: Introductory Digital Image Processing: A Remote
Sensing Perspective (Second edition), Prentice Hall, Upper Sad-dle River, New Jersey, USA, 1996.
Le, T. P. Q., Garnier, J., Gilles, B., Sylvain, T., and Minh, C. V.: The changing flow regime and sediment load of the Red River, VietNam, J. Hydrol. 334, 199–214, 2007.
Leh, M., Bajwa, S., and Chaubey, I.: Impact of land use change on erosion risk: an integrated remote sensing, geographic informa-tion system and modeling methodology, Land Degrad. Dev., 24, 409–421, 2013.
NASA Land Processes Distributed Active Archive Center: USGS Products, Digital elevation data (GTOPO30), available at: https: //lta.cr.usgs.gov/GTOPO30TS1, last access: 16 May, 2017. NASA LP DAAC: The V005 MODIS Land Cover Dynamics
(MCD12Q2) product, NASA EOSDIS Land Processes DAAC, USGS Earth Resources Observation and Science (EROS) Center, Sioux Falls, South Dakota, available at: https://lpdaac.usgs.gov (accessed 10 Jun 2017), 2015
Takeuchi, K., Ao, T. Q., and Ishidaira, H.: Introduction of block-wise use of TOPMODEL and Muskingum–Cunge method for the hydro-environmental simulation of a large ungauged catchment, Hydrol. Sci. J., 44, 633–646, 1999.
Tang, L., Yang, D., Hu, H., and Gao, B.: Detecting the effect of land-use change on streamflow, sediment and nutrient losses by distributed hydrological simulation, J. Hydrol., 409, 172–182, 2011.
Wang, J. and Ishidaira, H.: Effects of human-induced vegetation cover change on sediment flow using satellite observations and terrestrial ecosystem model, J. Japan Soc. Civil Eng. B1, 69, I_205–I_210, 2013.
Wang, J., Ishidaira, H., Sun, W. C., and Ning, S. W.: Development and Interpretation of New Sediment Rating Curve Considering the Effect of Vegetation Cover for Asian Basins, The Scientific World J., 2013, 154375, https://doi.org/10.1155/2013/154375, 2013.
Wilson, C. O. and Weng, Q.: Simulating the impacts of future land use and climate changes on surface water quality in the Des Plaines River watershed, Chicago Metropolitan Statistical Area, Illinois, Sci. Total Environ., 409, 4387–4405, 2011.