© 2017 IJSRST | Volume 3 | Issue 6 | Print ISSN: 2395-6011 | Online ISSN: 2395-602X Themed Section: Science and Technology
Prediction of Organ and Effective dose with known mAs and kVp for dose
Optimisation Protocol and Recommendations in CT
Issahaku Shirazu1, 4, Y. B. Mensah2, Cyril Schandorf3, S. Y. Mensah1, Theophilus Sackey1,4, Theresa Bebaaku Dery1, 4, Mark Pokoo-Aikins1, 4, Ernest Kojo Eduful1. 4
1University of Cape Coast, School of Agriculture and Physical Sciences Faculty of Physical Sciences, Department of Physics,
Cape coast, Ghana
2University of Ghana Medical School, Department of Radiology, Korle-Bu Teaching Hospital, Accra Ghana 3Graduate School of Nuclear and Allied Sciences, University of Ghana, Legon, Ghana
4Ghana Atomic Energy Commission, Radiological and Medical Sciences Research Institute, Medical Radiation Physics Centre,
Accra, Ghana
ABSTRACT
In medical exposure dose to patients are determine by input parameters including mAs, kVp, pitch factor among other factors. The aim of this study is to provide procedure and protocol of how to assess patients’ dose (organ and effective dose) estimates with preset eff mAs and standard kVp. This is to determine a tradeoff between patient’s dose and the image quality before imaging. In addition to providing appropriate clinical recommendation for clinicians for dose management during CT scan. MVL DICOM application software was used to access image data during abdominal CT scan. Organ and effective dose estimates were estimated as developed by ICRP 103 recommendations. Where on the image data, using MVL platform detail information of the mAs, kVp, CTDIvol and DLP were available for recording. The
weighted CTDI (CTDIW) was estimated by multiplying the volume CTDI (CTDIVOL) by the pitch factor. Which was used
to estimate organ dose using the normalized organ dose factor and the effective dose was estimated by the product of the region-specific normalizing constant and the dose length product. The mAs is the effective Milliameter per second, which were calculated by dividing the mAs by the pitch factor. The relationship between input and output parameters were modeled as the final component of the modeling process in a form of GUI applications format. This was done to establish the various process and procedures involve in abdominal scan for dose managements. The coding process involve the use of written visual basic code to design an interface and integrated on the MVL application platform for clinical application. The GUI has been recommended for use by various stake holders in CT operations
Keywords: CTDI, mAs, MVL, CT, MVL DICOM, ICRP, IAEA/ICRP, DLP
I.
INTRODUCTION
In x-ray computed tomography (CT) imaging large number of photons particle and energy fluence (increase mAs) are absorbed to produce clearer images to enable clinical interpretation. However, introducing larger photons will increase the SNR of the image (improve image quality), where the signals are stronger with less noisy in the image. In addition, the large photons will increase the amount of photon interaction with the body tissues hence increase possible dose deposits. Therefore the use of high kV and mAs will increase the number of photons and radiation dose to patients and hence increasing the SNR respectively. Conversely, it was observed that measured SNR improved with increase slice thickness and by decreasing the kV and mAs, would reduce the patient dose.
Organ doses cannot be measured directly within a patient, because it would require placing a dosimeter at the points of interest within the body. Hence, organ doses are estimated by using the normalized organ dose factor and a weighted Computed Tomography Dose Index (CTDIw).
Whilst the effective dose are estimated by using the product of the region-specific normalizing constant (EDLP)
and the dose length product (DLP) from ICRP publication 103 [1]. Based on IAEA/ICRP recommendations, CTDI is to be replaced in future by the Computed Tomography Air Kerma Index (Ca). However, using the new quantity does
photons particle (mAs) and energy fluence (kVp) that are absorbed by the organ. Where increases in mAs and kVp gives a much better clearer images to answer clinical questions. However, by reducing the mAs and or kVp implied an increase in image noise. However, as the radiation absorbed in the tissue (the dose) is reduced, the visual noise in the image is increased. An optimized imaging protocol is one in which the mAs is adjusted to achieve an image noise level that is acceptable for clinical interpretation.
In addition to the dose input parameters (mAs and kVp), pitch factor also plays an important role in dose management. Where, increasing the pitch factor technically reduces radiation organ dose, but practically other factors must be considered. While increasing the pitch factor reduces the dose if all other factors are the same, which also affects image quality. The pitch factor affect image quality and patient dose in two folds. First, the pitch can place a limit on the maximum detail or spatial resolution that can be obtained in the axial slice thickness direction. Second, increasing pitch will increase image noise. However, most CT systems operates with automatic exposure control (AEC) system, that automatically increases the mAs and dose to maintain a specific noise level as other factors including slice thickness, matrix size, field of view and pitch are changed. An advantage of increasing pitch is to reduce scanning time, not to reduce dose. The appropriate action is to select pitch factor values that provide a balance among the image quality and scan time requirements and concerns for patient exposure. This comes from experience and the use of existing national or international guidelines and appropriate references, mostly based on Basic Safety Standard (BSS) by IAEA.
To achieve this IAEA offers regional and international training courses to member countries. In particular in the field of optimization and image quality, these courses are catered for radiologists, medical physicists, radiographers and other medical professionals. The goal of medical physicist in the team is to establish quality control practices, provide measuring methodology and support optimization processes for patients’, clinicians and general public safety [2]. The Agency’s training services can, through a structured process, address the needs of individual professionals (through fellowships and scientific visits) and, via national training courses of Member States.
II.
OBJECTIVES
The aim is to provide procedure and protocol of how to assess patients’ dose with known mAs and standard kVp before imaging. In addition to providing comprehensive appropriate clinical recommendation for clinicians for dose optimisation procedure.
1) EXPOSURE AND DOSE PARAMETERS
It is important to note that photons are energetic enough to overcome the binding energy of an orbiting electrons in an atoms. This energetic photon can knock off electron from its orbital shell with an angle of 180 degrees, thereby creating ions. In human body the result of this knock off when exposed to photons, results in the creation of hydroxyl radicals in the body [3, 4]. These are due to the x-ray interactions with the human body cells which consist of approximately 70% water molecules. The nearby DNA will cause a base damage or strand breaks and the hydroxyl may even ionize DNA directly. It should be noted that, various systems within the cell may rapidly repair most of these radiation-induced damage, this however is based on a number of factors. However, it is less easy to repaired double-strand breaks, which may lead to induction of cancer [4]. These biological exposure to photon energy give rise to the determination of various fundamental dosimetric quantity in radiological imaging. In medical imaging where low-dose radiation exposure is use, the risk-related quantities can be obtained from the practical dosimetric quantities. These quantities are express from CTDIW and DLP, using the dose-conversion coefficients in
Table 1 for specific organ dose and regional effective dose respectively. These quantities are obtained as part of the image data and on the console. In addition, specific organ dose and regional effective dose are general estimated for referencing and provide advice to clinicians.
Table 1. Region specific normalized effective doses for CT
CT DOSE PARAMETERS
Many modern CT systems calculate the Computed Tomography Air Kerma Index, Ca. Ca is a useful indicator
of scanner radiation output for a specific kVp and mAs. Values of Ca can vary with nominal slice thickness, especially for the narrowest settings [5]
This was introduced to account for variations in radiation exposure in the z direction when the pitch is not equal to 1. So, CTDIvol takes into account the helical pitch or axial
scan spacing [5]. It is of interest to note that recent publications and IAEA soon to be published Code of Practice point out the experimental difficulty in determining the dose to air, especially in the vicinity of an interface, and that, in reality, the quantity measured by instruments is air kerma. For these reasons these publications recommend the use of air kerma rather than absorbed dose to air, and consequently, the name CTDI is to be replaced in future by the Computed Tomography Air Kerma Index (Ca). [6]. Furthermore, doses to organs (e.g.,
kidney) are determine using the Ca and conversion factor for renal tissues as recommended by ICRP publication 103 Table 1 [5].
DT = PCTDIW 1
where DT is the normalized organ dose factor from ICRP
publication 103 and CTDIW is the weighted Computed
Tomography dose Index. The standard SI unit for organ dose us the mSv.
Another dose parameter of interest is the effective dose. It is defined as the sum of the weighted equivalent doses in all the tissues and organs of the body. A broad estimates of effective dose (E) may be derived from values of DLP for an examination using appropriately normalized coefficients (Table 1) designed by ICRP and European commission [7]. The effective dose is define as the product of the region-specific normalizing constant (EDLP) and the dose length
product (DLP).
Define mathematically as:
E = EDLP * DLP 2
This definition by ICRP was used in this study to estimate the effective dose with known DLP and EDLP[8]. However,
the estimate of the effective dose is useful when comparing doses from different diagnostic procedures and for comparing the use of similar technologies and procedures in different hospitals and countries as well as the use of different technologies for the same medical examination. Therefore these values are purely for purposes of
comparism but not for estimating dose to individual patients.
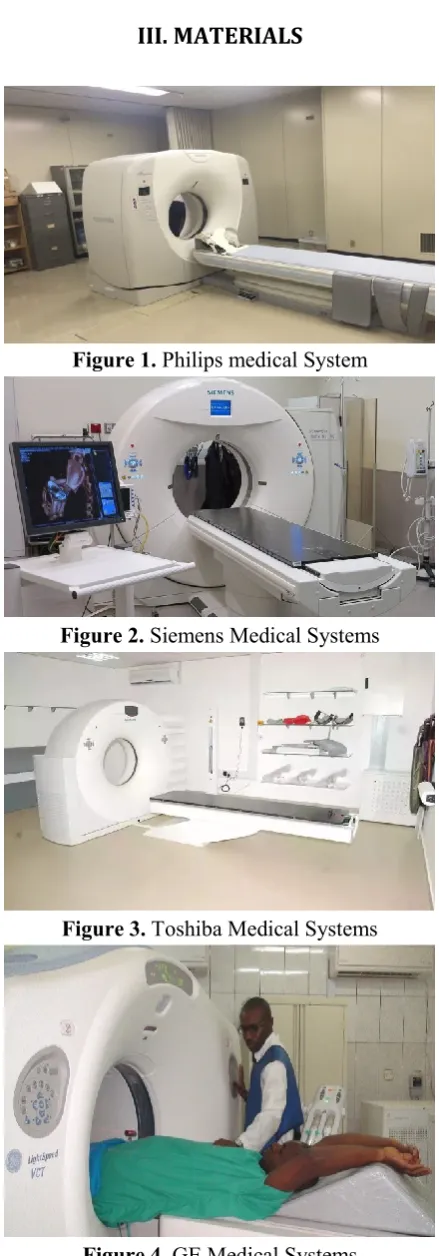
III.
MATERIALS
Figure 1. Philips medical System
Figure 2. Siemens Medical Systems
Figure 3. Toshiba Medical Systems
IV.
METHODOLOGY
MVL DICOM application software standard supplement was issued in 2007 for the reporting of dose parameters in CT [9]. This became mandatory for all manufacturers of CT equipment. It requires a report summary to be given for the whole patient examination and the accumulated dose applied. The patient information, the patient study information and the general equipment information is stored within the general part of the structured report. This development enable the obvious difficulties in measuring the distribution of dose within the body during CT imaging to be overcome. A more practical dosimetric quantities captured as part of image data were used to readily estimate these parameters from closely related measurements. The risk-related quantities were obtained from the practical input dosimetric quantities mAs and kVp which led to the estimate of CTDIVOL and DLP, using the
dose-conversion coefficients in Table 1.
On the image data, using MVL platform detail information of the mAs, kVp, CTDIvol and DLP were available for
recording. The weighted CTDI (CTDIW) was estimated by
multiplying the volume CTDI (CTDIVOL) by the pitch
factor expressed mathematically as:
3
Where p is the pitch factor and varies from 0.813-1.0 is the average pitch factor of the scanning protocol.
Determination of Effective dose and organ dose using CTDIw and DLP
The CTDIW and DLP enable organ and effective dose to be
estimated using equation 1 and 3 with recommended ICRP region-specific normalized effective dose coefficient in
Table 1. Hence, broad estimates of effective dose (E) and
organ dose (D) were derived from values of DLP and CTDIVOL respectively, for each examination using the
appropriately normalized coefficients. For abdomen, EDLP
represent general values appropriate to abdomen to estimate effective dose as published by the ICRP [10].
To estimate abdominal effective dose, DLP and
region-specific normalizing constant or DLPconversion factor
(EDLP) as developed by ICRP Publication 103 were used
and define as:
. 4
where 0.0153 is the estimated abdominal conversion factor from ICRP publication 103 as stated. This is because the
effective dose is NOT measured but it is a theoretical calculated dose based on the organs exposed by the applied radiation multiplied by tissue-weighting factors. Because the tissue-weighting factors can change with new data and continuing analysis of existing data with better analytical tools, the effective dose conversion factor estimates can change over time.
In addition, organ dose estimates was estimated as develop by ICRP 103 recommendations. This was estimated by using a converting factor and a known weighted-CTDI (CTDIW). Once the CTDIW is known, it is straightforward
to multiply it by the effective mAs value and the organ dose conversion coefficients to obtain the organ doses for all the examination. For partial-body irradiation as in CT, effective dose is the weighted summation of the absorbed dose to each specified organ and tissue multiplied by the ICRP-defined tissue-weighting factor for that same organ or tissue [101].
Furthermore, the conversion factor for tissues as recommended by ICRP publication 103 varies from region to region at varied mAs. Hence, the organ dose are calculated using the same ICRP publication 103, for renal tissues it’s calculated as:
Dkidney= 0.0086CTDIW * eff (mAs) 5
where 0.0086 is the renal tissue conversion factor from ICRP publication 103, CTDIW is the weighted Computed
Tomography dose Index and mAs is the effective Milliameter per second, which were calculated by dividing the exposure (mAs) by the pitch factor.
That’s
6
Modeling the relationship between input and output parameters
parameters for control measure). This allowed direct manipulation of the data during clinical application. Modeling the linear dose optimisation parameters (mAs,
CTDI, E, RD and SNR) were predicted as follows:
CTDIvol = ϓmAs + C1 7
DLP= ђmAs + C2 8
RD = ϕE + C3 9
SNRRD = λRD + C4 10
SNRE = ϰE + C5 11
where ϓ, ђ, ϕ, λ, ϰ, C1, C2, C3 C4 and C5 are constants to be determine. In addition, the mathematics model was developed to estimate effective and organ doses with specific input parameters and age and gender specific dose estimates.
V.
RESULTS
Table 1: Average exposure parameters Table 2: Average exposure parametersVI.
DISCUSION AND ANALYSIS
The estimated pre-set dose parameters during CT scan were; tube current, kilovolts peak (kVp), exposure (mAs), pitch factor and patients body size and gender. This enable the prediction of prognostic consequences of these parameters. In relation to dose parameters such CTDI and DLP estimate and the resultant organ and effective dose. In all the examinations, the average protocol setting in terms of exposure and kilovolts peak were 48.19mAs and 120kVp respectively. The mean, maximum and minimum of these parameters are shown in Table 1. This play an important role in the determination of the level of exposure (mAs) in term of particle and energy fluence in CT examinations to the various tissues. The influence of these parameters on various regional body scan depends on the slice thickness, scan time and scan scope. The mean, the maximum and the minimum measured E, RD, SNR are shown in Table two. A graphic user interface has been designed to obtain user input of patient- and scan-specific parameters, and to calculate and display effective and organ doses. Together with signal to noise ratio for image quality to be determine. This enable organ dose to be estimate before imaging by using the parameters in the modeled relations below. MODELED EQUATIONS The constants ϓ, ђ, ϕ, λ, ϰ, C1, C2, C3 C4 and C5 has been determined and modeled as shown in equation 12, 13, 14, 15 and 16 respectively. CTDIvol = 0.21mAs -3.05 12DLP = 27.60mAs -240.06 13
The input mAs is test run using equation 12 at 120 kVp and the CTDIVOL is estimated in addition to DLP. The estimated CTDIVOL is also converted to CTDIW with known pitch factor as in equation 3 to obtain renal dose as shown in equation 5. The DLP is also converted to effective dose as shown in equation 4. Effective dose can also be used to estimate renal dose as shown in equation 14 RD = 0.0224 E + 0.39 14
Furthermore, with known effective and renal dose signal to noise ratio can be estimated as shown in equation 15 and 16 respectively. SNRE = 0.0075E + 7.1 15
SNRRD = 0.144RD+ 6.83 16
The signal to noise ratio enable a tradeoff between patient radiation dose and image quality in abdominal CT to be established. During preimage setting the mAs is set and test run to produce the CTDIVOL and DLP
values. The CTDIVOL is then converted to CTDIW and
the questions to be answered. Where image noise does not distort the information for adequate and accurate analysis. This means the signal strength should not exceed the fivefold requirements that is recommended for adequate diagnostic decision. Establishment of these procedure help to protect the patients from radiation dose which may result in a reduction of the risk to patient. This is because reducing dose reduces the signal and thereby reduces the signal to noise ratio in the resulting CT image, hence, the image quality is affected. Hence it is necessary for to establish various diagnostic protocol to be followed before imaging. A Comprehensive Clinical Decision Support Application protocol for dose Optimisation Protocol has been developed for clinical application in Ghana.
VII.
RECOMMENDATIONS
Base on the study results, the following general recommendations are addressed to managements of CT facilities, Radiologist, Physicist, Radiographers and the Regulatory Authorities in order to help reduce radiation dose to patients:
Various facilities
Facilities are encouraged to acquire dose reduction technologies and techniques to help reduce radiation dose to patients compatible with what has been done during this research work.
Adequate and appropriate training is required to
equip the imaging team (Radiologists,
Radiographers and Medical Physicists) to equip them with latest technology in patients’ dose assessment and optimization of imaging procedures to ensure adequate protection of the patient.
The technical factors required for a CT examination and the resulting dose are dependent on patient size and each CT center should establish specific scan protocols for each patient group as part of optimization procedure.
Radiographers
It is recommended that the modeled equations should be used to aid in the selection of exposure parameters before imaging.
There is the need to work as a team during decision making in order to reduce dose to patients with the physicist and the radiologist.
Various dose optimization factors should be considered during pre-set imaging procedure. These include patient size, age and gender variations to avoid unnecessary dose to patients.
Radiologist
The measurements obtained by this method is associated with excellent results. Hence, the renal volumetric ellipsoid coefficient is recommended to be used for clinical application in Ghana.
It is recommended that the established reference values be used as clinical guidance values for the protection of patients.
Medical Physicist
The CT scanners used acquired 3D data and therefore do not rely on geometric assumptions to estimate organs volumes. This advantage makes CT scan a superior method of organ measurement. Hence it is recommended that Medical Physicist should adopt this method to develop other organ models to be used as standard reference values for clinical application and research in Ghana.
Team work approach is recommended to be used to reduce radiation dose to patients through collaboration between the imaging team made up of the Radiologist, the Medical Physicist and Radiographer.
It is recommended that the studies should be carried out periodical to estimate the abdominal effective dose and organ doses in all the centers in Ghana using the method established in this work regularly. The results obtained can then be used to continuously monitor dose level and advice clinicians appropriately in their clinical practice.
Regulatory Authority
The abdominal effective dose exceeded the recommendation of the EC and ICRP values. This is an indication effective regulatory oversight is needed
The Nuclear Regulatory Authority should provide regulations and guidance document that will assists registrants and licensees to meet regulatory requirements for the control of medical exposure.
Regular inspections should be conducted to ensure CT Facilities are meeting regulatory requirements..
In order to achieve the complete optimization strategies, there is a great demand to educate CT personnel on the effects of scan parameter settings on radiation dose to patients and image quality required for accurate diagnosis
The first is the minimization of the number of slices (hence scan length) as much as possible, without missing any vital anatomical region. This study have recommended that reduction of irradiation volume depending on specific body region being scanned, will reduce radiation dose to patients significantly.
The second is minimization of tube current (mA) based on indication of study. This study have revealed that adjustment of mA based on indication of study dose to patient can be reduced to 50% without significantly affecting the image quality.
The third approach is through modulation of exposure parameters (i.e., kV, mA, exposure time, and slice thickness) based on patient size and age, while maintaining a constant SNR. The study have demonstrated that by adjusting the exposure parameters based on patient age or weight patient radiation doses can be reduced significantly.
Another possible method is through use of contrast media only to optimize diagnostic yield. The study reveal that, the use of contrast media by some of the hospitals was done as a routine procedure without clinical justification of using it.
VIII.
ACKNOWLEDGEMENTS
My sincere thanks goes to the entire staff of the Medical Radiation Physics Centre, Radiological and Medical Sciences Research Institute of Ghana Atomic Energy Commission, Department of Radiology, Korle-Bu Teaching Hospital, Tamale Teaching Hospital, Komfo Anokye Teaching Hospital, Cocoa clinic and 37 Military Hospital, for their support and cooperation.
Finally, I take this opportunity to express my sincere and heartfelt appreciation to University of Cape Coast, for the opportunity granted me during the course of this research work as part of my PhD study, especially Dr. Alfred Owusu whose letter of introduction enable me easy access to the various facilities for data collection.
IX.
REFERENCES
[1]. The 2007 Recommendations of the International Commission on Radiological Protection. ICRP publication 103. Ann. ICRP. 2007; 37(2–4):1–332
[2]. Aabha Dixit, IAEA Office of Public Information and Communication, IAEA Workshop to Address Challenges of Unnecessary Radiation Exposure of Patients, 15 march, 2016. Pages: 1.3
[3]. Mullenders L, Atkinson M, Paretzke H, Sabatier L, Bouffler S. Assessing cancer risks of low-dose radiation. Nat. Rev. Cancer. 2009; 9: Page: 596–604. [4]. Rothkamm K, Lobrich M. Evidence for a lack of DNA double-strand break repair in human cells exposed to very low x-ray doses. Proc. Natl Acad. Sci. USA. 2003; 100: Pages: 5057–5062.
[5]. Perisinakis K, Damilakis J, Tzedakis A, Papadakis A, Theocharopoulos N, Gourtsoyannis N, 2007, "Determination of the weighted CT Dose Index in modern multi detector CT scanners", Physics in Medicine and Radiology, 2007, 52: Pages: 6485- 6495.
[6]. AAPM Report No. 39, "Specification and Acceptance Testing of Computed Tomography Scanners", 1993
[7]. Bushberg JT, et al. The Essential Physics of Medical Imaging. 3rd Ed. Section 3.3.
[8]. Walter Huda, Kent M. Ogden, Mohammad R. Khorasani, Converting Dose-Length Product to Effective Dose at CT, RSNA, Volume 248: Number 3 September 2008 PP 995-1003
[9]. DIGITAL IMAGING AND COMMUNICATIONS IN MEDICINE, Supplement 127: CT Radiation Dose Reporting (Dose SR), DICOM Standards Committee, Rosslyn, VA (2007)
[10]. Hutton B F and Osiecki A 1998 Correction of partial volume effects in myocardial SPECT J. Nucl. Cardiology. 5 Pages: 402–413
![Table 1. Region specific normalized effective doses for CT scan [69]](https://thumb-us.123doks.com/thumbv2/123dok_us/9107311.1445094/2.595.300.554.627.730/table-region-specific-normalized-effective-doses-ct-scan.webp)