Respiratory Modulation o f the Vagal Regulation o f the Heart Rate
and its Beat to Beat Variability
BY
CHRISTOPHER PAUL SEERS
Thesis submitted for the degree of Doctor of Philosophy to the Faculty of Science of the University of London
(submitted December 1996)
Sobell Department o f Neurophysiology Institute of Neurology
National Hospital for Neurology and Neurosurgery Queen Square
ProQuest Number: 10017316
All rights reserved
INFORMATION TO ALL USERS
The quality of this reproduction is dependent upon the quality of the copy submitted.
In the unlikely event that the author did not send a complete manuscript and there are missing pages, these will be noted. Also, if material had to be removed,
a note will indicate the deletion.
uest.
ProQuest 10017316
Published by ProQuest LLC(2016). Copyright of the Dissertation is held by the Author.
All rights reserved.
This work is protected against unauthorized copying under Title 17, United States Code. Microform Edition © ProQuest LLC.
ProQuest LLC
789 East Eisenhower Parkway P.O. Box 1346
ABSTRACT
This thesis examines concepts for respiratory rhythm generation in relation to how
the central inspiratory activity interacts with the peripheral inputs responsible for the reflex control of the heart rate by the vagus nerve.
The aim of the study was to examine the beat to beat parasympathetic control o f the heart in the anaesthetized cat in eupnoea, in ventilation-induced hyperoxic- hypocapnic apnoea and during transitions between the two states. Morphine was used to slow respiration
and elevate the threshold for rhythm generation, and p-blockade to eliminate the cardiac
sympathetic drive.
Hypocapnic apnoea caused a largely parasympathetically mediated tachycardia, subsequent CO2 titrations showed a CO2 dependent bradycardia and a titratable increase in the beat to beat heart rate variability (HRV). When expiration was prolonged the bradycardia phase of the respiratory sinus arrhythmia (RS A) was generally larger, and closely followed
the firing pattern of the expiratory EMG. Late in the expiratory phase there was a greater HRV which is analogous to the CO2 dependent HRV seen during hypocapnic apnoea. Morphine significantly augmented RSA and HRV by an increase in vagal tone (VT), which was not completely eliminated during inspiration.
In the young cat changing from normoxic to hyperoxic breathing caused a marked bradycardia and increase in RSA. During apnoea hyperoxia significantly increased VT and HRV, which was then phasically inhibited at the onset of rhythm to give a substantial RSA.
The results show that both moiphine and the central CO2 drive can evoke a tonic VT which is not completely inhibited by the inspiratory related inhibition of the cardiovagal motoneurones (CVMs). In the young animal the peripheral chemoreceptors powerfully inhibit VT via the respiratory rhythm generating mechanisms, which is not seen in the adult.
During apnoea the CVMs receive a central CO2 dependent tonic cardiac drive, which is rendered phasic with the onset of rhythm, and is analogous to the tonic expiratory drive to
ACKNOWLEDGEMENTS
I would like to thank my supervisor Professor T. A. Sears for his patient teaching, stimulating discussion and kind encouragement throughout the course of this project. I would
also like to thank past and present members of the Sobell Department o f Neurophysiology for their support and advise, in particular Robin Howard for keeping me going, and Professor
R. N. Lemon for giving me the time and space to continue the work.
Last but not least I would like to thank Kate, Tim and Ben for their patience and
understanding, and for being there when I most needed them.
I gratefully acknowledge the financial support of the Brain Research Trust and the
ABBREVIATIONS AND SYMBOLS
nTS Nucleus Tractus Solitarius
nA Nucleus Ambiguus
PaCOj Arterial Carbon Dioxide tension (%)
PgOz Arterial Oxygen tension (%)
FetCOs Fractional End-iidai Carbon Dioxide (%)
CO2TRG CO2 Threshold for Respiratory Rhythm Generation (%) Frequency of breathing (Respiratory rate, Breaths min ’)
Ti Inspiratory time (s) Te Expiratory time (s)
BPM Beats minute'*
RSA Respiratory sinus arrhythmia (b p m)
HR Mean heart rate (b p m)
HP Heart period (s)
HPyar Heart period variance (s) HRp Filtered heart rate (b p m)
HR; Instantaneous heart rate (b p m)
HRpK Mean heart rate of RSA Peaks (b p m)
H Rj r Mean heart rate of RSA Troughs (b p m)
RSApK RSA Peak values (inspiratory - tachycardias, b p m)
RSA-tr RSA Trough values (expiratory - bradycardias, b p m)
RRj, RR2, RR3 X, Y, & Z axis on 3-Dimensional R -R cluster plot BP Mean blood pressure (mmHg)
CTCH Cycle Triggered Cardiac Histogram
CV Coefficient of variability (R-R cf. R -R mean, %) CVS Coefficient of variability (R-R; cf. R-R;+;, %)
SEM Standard error of the mean HRV Heart rate variability (R-R)
H R Vm a x Maximum value of the HRV (b p m)
HRVmin Minimum value of the HRV (b p m)
HF-HRV High frequency (>0.1 Hz) HRV in power spectra
VLF-HRV Very low frequency (<0.02 Hz) in power spectra
VHP-HRV Very high frequency HRV (beat to beat R -R variability)
a.u. Spectral power arbitrary units Î Step increase in variable
i Step decrease in variable No change in variable
/ Steady ramp increase in variable
\ Steady ramp decrease in variable
Integrated Inspiratory (Ig^G ) or Expiratory (Eemg ) EMG. Integrator ‘low pass I filter’ (leaky) type with time constant (TC)
EMG
TC
EMG Electromyograph
Iem g Inspiratory EMG
Eem g Expiratory EMG
Epii Expiratory filament
Efisu Expiratory Bulbospinal Units
MS Morphine Sulphate
DLH DL-homocysteic acid
CVMs Cardiovagal Motoneurones PCs Peripheral Chemoreceptors
VT Vagal Tone
NS Not significant
CRDPs Central Respiratory Drive Potentials
CONTENTS Page
Title Page 1
Abstract 2
Acknowledgements 3
Abbreviations and Symbols 4
Contents 6
List o f Figures 12
List o f Tables 18
Chapter 1 TNTRODUCTTON
1.1 Preamble 19
1.2 Respiratory Control 22
History 22
Functional anatomy 23
Rhythm generation 25
Central respiratory drive potentials (CRDPs ’) 29
Central apnoea 30
1.3 Autonomic Regulation of the Heart 35
1.3.1 Anatomy 36
Dorsal Motor Nucleus o f the Vagus 36
Cardiac innervation 36
Retrograde labelling 36
Antidromic activation 37
Nucleus Ambiguus 38
1.3.2 Termination of Sinus Nerve Inputs 39
Baroreceptor terminations 39
Chemoreceptor terminations 40
nTS and nA connections 41
1.3.3 Vagal Pre-ganglionic Firing Patterns 42
Simultaneous recordings o f cardiac vagal and sympathetic efferents 44
1.3.4 Gating of Baroreceptor and Chemoreceptor Inputs 45
Presynaptic modification 47
1.3.5 Modulation of Cardiovagal Motoneurones in the nA 49
Cardiac efferents 49
nA pharmacology 51
GABA 52
Hypothalamic Defence Area responses 53
nTS tonic inhibition 53
1.3.6 Cardiovascular Reflexes 54
Hypoxia 55
Hypercapnia 56
Hypocapnia 57
Reciprocal and non -reciprocal reflex responses 58
1.4 Aims of the Study 61
Outline o f experiments 62
Chapter 2 METHODS
2.1 Animals and Anaesthesia 6 6
2.2 Surgical Procedures 67
Decerebration 67
2.3 Respiration 6 8
Expiratory EMG 69
Inspiratory EMG 70
Ventilation 70
Brainstem recordings 70
2.4 Cardiac Nerve Recording 71
2.5 Instrumentation 71
Expired CO2 concentration 71
Blood pressure 72
Temperature 72
Electrocardiogram 72
Cardiac event detection 72
Heart rate display 73
Off-line data acquisition 73
2.6 Software 75
Commercial software 75
User written software 76
2.7 Data Analysis 76
Cardiac event series pre -processing 76
Cardiac event series filtering (see also Appendix 1) 77
2.8 Statistical analysis 77
Data analysis 78
Respiratory sinus arrhythmia 79
Cycle triggered cardiac histograms (CTCH) (see also Appendix 2) 79
Power spectral analysis 80
Experimental protocols 82
C h a p te rs RESULTS
3.1.1 Baseline Observations 84
Aims 84
p-blockade 90
p-blockade during Hypocapnic apnoea 94
3.1.2 Summary of responses to p-Blockade 96
3.1.3 Summary o f responses to Parasympathetic Blockade 100
3.1.4 Parasympathetic blockade with p-blockade 101
3.1.5 Discussion 105
3.2.1 Morphine 112
Aims 112
3.2.2 Qyeryiew of MS Responses 115
Initial responses 115
Primary MS response 117
Blood pressure 118
Heart rate variability 118
Power spectra 120
p-blockade 1 2 0
Ventilated preparations 127
Hypocapnic apnoea 131
Parasympathetic blockade 133
Low blood pressure 135
Expiratory bulbospinal activity after MS 136
Effect o f second dose o f M S 139
3.2.4 Naloxone 141
Naloxone with p-blockade 144
Power spectra 146
Hypocapnic - apnoea 146
3.2.5 Discussion 147
3.3.1 Hypocapnic Apnoea 157
Aims 157
Normoxic V5 Hyperoxic hypocapnic apnoea 160 3.3.2 Summary o f Normoxic and Hyperoxic Experiments 162
Power Spectra 164
p-blockade 164
Atropine 165
Offset o f RSA 168
Post -ventilation apnoea (Pump-stop manoeuvre) 168
Cardiac nerve recording 172
Double blockade in hypocapnic apnoea 174
3.3.3 Discussion 174
3.4.1 COn Titrations in Normoxic- and Hyperoxic-Hypocapnic Apnoea 181
Aims 181
Heart period changes 181
BP changes 183
HR V during CO2 titrations in hypocapnic apnoea 18 6 Power spectra during CO2 titrations 186
3.4.2 Normoxia vs Hvperoxia 191
3.4.4 CO^ titration tachycardia 204
3.4.5 Onset of respiratory rhythm 207
3.4.6 Discussion 212
3.5.1 Expiratory modulation of the heart period 221
Aims 221
Morphology o f RSA 221
MS effect on RSA 233
Cardiac efferent recordings 237
3.5.2 Discussion 242
3.6.1 Modification of cardiorespiratory interactions bv hyperoxia 248
Aims 248
Adults, ventilated 248
Young animals, ventilated 250
Continuous ventilation 252
Spontaneous breathing with hyperoxic gases 258 Normoxic -hyperoxic effect on MS response 260
3.6.2 Discussion 264
3.7.1 Post-MS residual bradycardia 270
Aims 270
Effect o f M S on residual bradycardia 270
Young animals 274
Hexaméthonium blockade 277
3.7.2 Discussion 278
C h ap ter 4 DISCUSSION 285
REFERENCES 299
APPENDICES
A2.1 Measurement of Respiratory Sinus Arrhythmia 345
Peak-Trough detection 345
A2.2 Cycle Triggered Cardiac Histograms 346
Verification o f method 348
A2.3 Turns analysis 349
A3.1 Power Spectral Analysis of Heart Rate Variability 351
Modelling o f low frequency oscillations 3 52
Pharmacological blockade studies 356
LIST OF FIGURES
1.2.1 Model of the inspiratory off-switch mechanism. Redrawn from Bradley,
Euler, Marttila & Roos (1975) 27
1.2.2 Schematic representation of response of inspiratory and expiratory motoneurones to brainstem mediated central and peripheral chemoreceptor
drives. Redrawn from Sears (1984) 33
1.3.1 Pharmacological control of cardiovagal motoneurones. Redrawn from Spyer
(1989) 52
1.3.2 Relationships between cardiac vagal and sympathetic activity, and pulse
interval Redrawn from Koizumi et al. (1985) 60
1.3.3 Relationship between changing and simultaneous recordings o f the
cardiac vagal and sympathetic nerve activities in the dog. Redrawn from
Kollai & Koizumi (1979) 60
2.1 Residual modulation of the heart after autonomic blockade 74 2.2 Computer screen image of instantaneous heart rate program used during
experiments 74
2.3 Example of filtered heart rate data 81
2.4 Power spectra analysis by summing the area under the curve 81
3.1.1 Changes in HR and RSA with spontaneous fluctuations in respiration 85 3.1.2 Slow changes in HR, RSA and respiration following decerebration 87
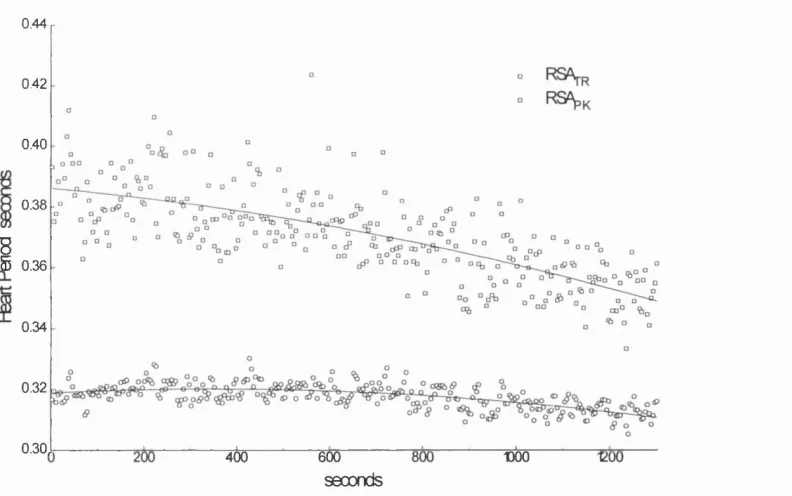
3.1.3 Graph of RSAp^ and RSA^r from experiment in Fig. 3.1.2 89 3.1.4 Transient increase in RSA following p-blockade 91
3.1.5 Reduction in RSA following p-blockade 93
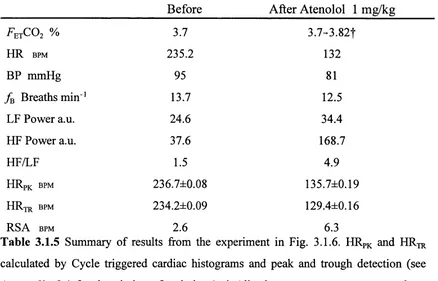
3.1.6 Sustained increase in RSA following p-blockade 95
3.1.7 Example of p-blocker given during hyperoxic-hypocapnic apnoea 97
3.1.8 R -R cluster plot of data in Fig. 3.1.7 98
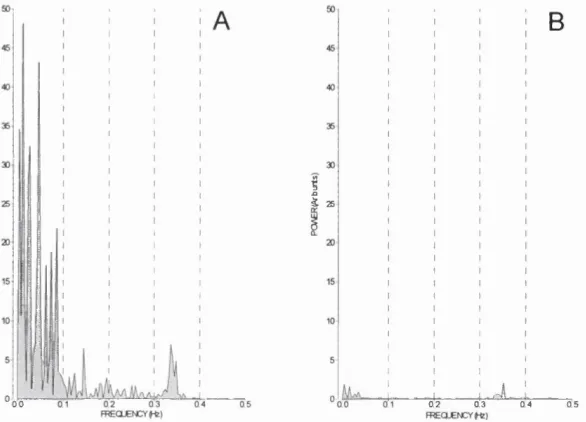
3.1.9 Power spectra before and after atropine from data in Fig. 3.7.3 102 3.1.10 Bradycardia produced by atropine in the spontaneously breathing animal 102
nerve stimulation. Reproduced from Levy & Zieske (1969) 108
3.2.1 A C MS dose in the spontaneously breathing animal 113 3.2.1 D -E RSA before and after MS and the relationship with Tg 114
3.2.2 Three examples of initial respiratory and cardiovascular responses to MS 116
3.2.3 Graphs of change in F^tCOj, HR, BP and respiratory rate in response to MS 119 3.2.4 Graphs of H ?var, CV and MS in response to MS 121
3.2.5 MS induced ‘inspiratory shift’ and the modulation of RSAp^ and RSAjr 123 3.2.6 O2 ventilated decerebrate animal, response to MS 125 3.2.7 MS induces an apnoea and marked bradycardia in a spontaneously breathing
animal 127
3.2.8 O2 ventilated animal, cardiorespiratory response to MS 128 3.2.9 O2 ventilated animal with the FexC0 2 ‘clamped’, response to MS 130 3.2.10 FexC0 2 ‘clamped’ experiment. MS induces an apnoea and increases the HRV
in p-blocked animal 132
3.2.11 Spontaneously breathing animal, response to MS after parasympathetic
blockade 134
3.2.12 Ventilated animal with ‘clamped’ F^jCOj, response to MS after
parasympathetic blockade 134
3.2.13 Marked RSA following MS with a low BP 136
3.2.14 Recordings from expiratory bulbospinal units. Response to MS and then
naloxone 138
3.2.15 Recordings from expiratory bulbospinal units and internal intercostal
filaments, response to MS 139
3.2.16 Effect of two doses of MS (1 mg/kg) on respiration, HR and RSA 140
3.2.17 The respiratory and cardiovascular responses to naloxone given after MS 142
3.2.18 Naloxone effect on heart rate and respiration after parasympathetic blockade 143 3.2.19 Naloxone effect on HR and respiration when given after p-blockade 145
3.2.20 Response to naloxone in a FetC0 2 ‘clamped’ experiment 147
3.3.1 Normoxic-hypocapnic apnoea (‘CO2 o ff) experiment showing the major
respiratory and cardiovascular changes 158
3.3.3 Comparison of normoxic- (A) and hyperoxic- (B) hypocapnic apnoea 161
3.3.4 Same experiment as Fig. 3.3.3A over a longer timescale 163 3.3.5 Normoxic-hypocapnic apnoea before (A) and after (B) p-blockade 166
3.3.6 Hyperoxic-hypocapnic apnoea with parasympathetic blockade 167 3.3.7 Hyperoxic-hypocapnic apnoea following 1 mg/kg MS 168
3.3.8 ‘Pump stop’ during normoxic- (A) and hyperoxic- (B) hypocapnic apnoea 170
3.3.9 Post-ventilation apnoea (‘pump stop’) in a p-blocked animal 171 3.3.10 Recording from Rt Cardiac nerve during transition from eupnoea to
hyperoxic-hypocapnic apnoea 173
3.3.11 Power spectra of integrated cardiac nerve activity in Fig. 3.3.10 174
3.4.1 A, Summary graph of HP changes in normoxic and hyperoxic CO2 titrations
without any drugs. B, with MS or p -blockade 182
3.4.2 A, Summary graph of BP changes in normoxic and hyperoxic CO2 titrations
without any drugs. B, with MS or p-blockade 184
3.4.3 Graph of HP verses BP change, A, without drugs, B, with MS and/or
p-blockade 185
3.4.4 CV and CVS changes during CO2 titrations without any drugs 187 3.4.5 CV and CVS changes during CO2 titrations with MS and/or p-blockade 188 3.4.6 A, HF and B, LF spectral power changes during CO2 titrations 189 3.4.7 A, HF and B, LF spectral power changes during CO2 titrations with MS
and/or p-blockade 190
3.4.8 CO2 titration in air showing marked increases in HRV with FetC0 2 192 3.4.9 HP, CVS and power spectra from the CO2 titration in Fig. 3.4.8 193 3.4.10 Hyperoxic CO2 titration in the same experiment as Fig. 3.4.8 194 3.4.11 Hyperoxic CO2 titration after p-blockade in same experiment as 3.4.10 196 3.4.12 Cluster plot of RR rR Rz RRs data in Fig. 3.4.11 197 3.4.13 A, Normoxic and B, hyperoxic CO2 titrations in the same experiment 199 3.4.14 Expanded section of Fig. 3.4.13 showing the onset of respiratory rhythm 200 3.4.15 Normoxic CO2 titration and multiple power spectra after MS 202 3.4.16 Graphs of LF and HF power, HP, CV and CVS from the CO2 titration in Fig.
3.4.14 203
titration and onset of rhythm 205
3.4.18 Graph of HR, CV and CVS for data in Fig. 3.4.17 206
3.4.19 Continuation of Fig. 3.4.17 showing the p-blockade and second CO2
titration 206
3.4.20 Onset of rhythm following hypocapnic apnoea after MS and p-blockade 208
3.4.21 Continuation o f the experiment in Fig. 3.4.20 and hypocapnic apnoea 209 3.4.22 Example o f marked ‘RSA’ tachycardias at the onset of rhythm following
hypocapnic apnoea 2 1 1
3.4.23 Schematic summarising CO2 off and CO2 titration procedure 217
3.5.1 ‘Sinusoidal-like’ RSA in the spontaneously breathing animal 222 3.5.2 The effect o f a prolonged Tj on the shape of RSA 224
3.5.3 The effect o f a prolonged Tg on the shape of RSA in the ventilated animal
after MS 225
3.5.4 Three examples of R -R modulation in respiration analysed by the cycle
triggered interval histogram (CTCH) 226
3.5.5 Example o f ‘Type IV’ pattern of RSA 227
3.5.6 Example o f experiment with a prolonged Tg in with the RSA mirrors
the Eg]^Q 228
3.5.7 Graphs of RSA amplitude vs expiratory time (Tg) 229
3.5.8 The effect o f an ‘expiratory shift’ on the pattern of RSA 231 3.5.9 Marked RSA and post-inspiratory bradycardias at the onset o f respiratory
rhythm generation 232
3.5.10 Spontaneously occurring low frequency modulation of RSA 234 3.5.11 Post-decerebration. Decrease in marked RSA by a reduction in the
bradycardia component 235
3.5.12 Evolution o f RSA following MS, and plots of RSAp^ and RSA^r 236 3.5.13 Effect of electrical stimulation of the cervical vagus on RSA 238
3.5.14 CTCH and its variance from the data in Fig. 3.5.13 239
3.6.1 The effect on the HR of a Air-Oj transition in adult animal 249 3.6.2 O2-A ir transition during hypocapnic apnoea in adult 250 3.6.3 Young cat, mixture of spontaneous and artificial ventilation, and changes
from Air- 0 2 and 0 2-A ir 251
3.6.4 45 day old cat with continuous ventilation. Transitions from Air- 0 2 and
O2-A ir at two levels of ^ ^ ^ 0 0 2 253
3.6.5 Detail from the region of high HRV in Fig. 3.6.4 254 3.6.6 RR1-RR2-RR3 cluster plot of the data in Fig. 3.6.4 255 3.6.7 Expanded views of second air- 0 2 transition in 3.6.4 256
3.6.8 Schematic of HRV changes in Fig. 3.6.7A 258
3.6.9 Air- 0 2 transitions in spontaneously breathing 116 day old cat 259 3.6.10 Effect on MS response of air- 0 2 changes in the young animal 261 3.6.11 Modification of the 'classic' MS response by a 0 2-air change 261
3.6.12 Onset o f rhythm after MS in the young cat 263
3.7.1 'Residual bradycardia’ following double pharmacological blockade 271 3.7.2 Effect of MS on 'residual bradycardia’ with p-blockade 272 3.7.3 Parasympathetic blockade after MS without p-blockade 273 3.7.4 Marked non-respiratory inhibited vagal tone in a 46d animal 275 3.7.5 Expanded section from the experiment in Fig. 3.6.12 showing the augmented
breath (sigh) 276
3.7.6 Effect of hexaméthonium blockade on 'residual bradycardia’ 277
A l.l The ECG event series as point events 337
A1.2 Interval tachogram representation of the R -R interval 338
A1.3 Examples of interval function plotting 338
A1.4 Model of autonomic control of SA node pacemaker. Redrawn fi*om Hyndman
(1980) 339
A1.5 Integral pulse fi'equency modulator. Redrawn ft"om Bayly (1968) 340
A1.6 Spectrum of the output pulse train o f an IPFM for a small sinusoidal input 341 A1.7 a. Ideal filter response in the frequency domain, b. Corresponding weighting
function (impulse response) in the time domain. Redravm from Hyndman
A1.8 Event series x(t) are convolved with a sine function h(t). Redrawn from
Rompelman (1986) 343
A1.9 Example of the output from the convolution process 344
A2.1 Example of the peak and trough algorithm 346
A2.2 Example of an cycle triggered cardiac histogram (CTCH) 347
A2.3A Random samples of RSAp^ Peak-trough method compared with CTCH 348 A2.3B Random samples of RSAjr. Peak-trough method compared with CTCH 349
A2.4 Turns analysis. Section of Iemg ^nd HR; during eupnoea 350
A3.1 Example of power spectra of respiration and heart rate recorded in man 352 A3.2 Block diagram of simplified BP control system. Redrawn from Hyndman et
al. (1971) 353
LIST OF TABLES
3.1.1 Summary of data in Fig. 3.1.2 8 8
3.1.2 Summary of power spectra data in Fig. 3.1.2 89
3.1.3 Summary of data in the experiment in Fig. 3.1.4 90
3.1.4 Summary of results from Fig. 3.1.5 92
3.1.5 Summary of results from Fig. 3.1.6 94
3.1.6 Summary of p-blockade experiments 99
3.1.7 Summary of p-blockade effects on HRV 99
3.1.8 Summary of parasympathetic blockade responses 100 3.1.9 Summary of HR responses to atropine with either MS or p-blockade 100
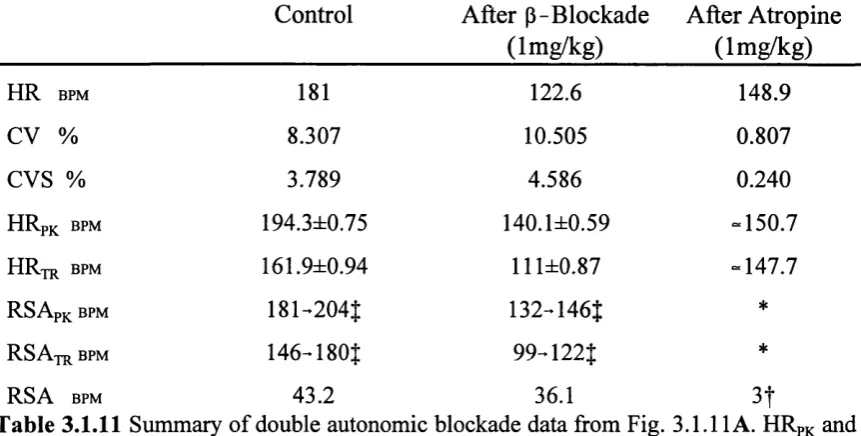
3.1.10 Summary of power spectra and HRV data in Fig. 3.1.9 101 3.1.11 Summary of double blockade experiment in Fig. 3.1.11 103
3.1.12 Summary of double autonomic blockade experiments 103 3.1.13 Comparison of respiratory effects of atenolol and propranolol 107
3.1.14 Summary of data in Fig. 3.1.2 110
3.2.1 Summary of data in Fig. 3.2.1A 115
3.2.2 Summary if results from 17 morphine experiments 117 3.2.3 Summary of changes in HR power spectra with MS 120
3.2.4 Summary of HR and respiratory changes after MS with sympathetic
blockade 1 2 2
3.2.5 Summary of power spectra in MS experiments 122
3.2.6 Summary of data before after MS in 3.2.5 124
3.2.7 Summary of data in Fig. 3.2.6 126
3.2.8 Summary of data in Fig. 3.2.9 129
3.2.9 Summary of data in Fig. 3.2.10 131
3.2.10 Summary of data in Fig. 3.2.11 133
3.2.11 Summary of data in Fig. 3.2.14 137
3.2.12 Summary of respiratory and cardiovascular changes to naloxone 144
3.2.13 Summary of data in Fig. 3.2.19 146
3.3.1 Summary o f data from Figures 3.3.3 A and B 160
3.3.2 Summary o f normoxic-hypocapnia experiments 162
3.3.3 Summary o f hyperoxic- hypocapnia experiments 162
3.3.4 Summary o f power spectra from normoxic-and hyperoxic-hypocapnia
experiments 164
3.3.5 Summary o f hypocapnia experiments after p - blockade 164 3.3.6 Summary o f hypocapnia experiments after parasympathetic blockade 168
3.4.1 Summary o f BP changes during CO2 titrations 183
3.4.2 Summary o f data from Fig. 3.4.11 195
CHAPTER 1 INTRODUCTION
1.1 Preamble
During the last few decades there has been a rapid development in understanding of the cardiovascular system, in particular, of the neural control of the heart. Similarly, advances
in understanding the genesis of the respiratory rhythm and its ability to maintain ventilation following severe disturbance has been remarkable. Such interest in these ‘systems’ is
understandable both because of their individual and essential contributions to maintaining life and their close interactions in maintaining homeostasis by efficiently matching gas exchange and blood supply. The regulatory adjustments can either be marked, for example,
as during exercise or in disease states, or subtle and not easy to detect due to simultaneous changes in ventilation, vascular resistance and cardiac output.
The neural drive to the heart is crucial for normal cardiovascular control because it
determines both the heart rate and contractile force. Changes within each breath cause heart rate to increase during inspiration and to decrease in the expiratory phase. This type o f heart rate variability (HRV) is known as respiratory sinus arrhythmia (RSA) and stands out as the most easily recognised cardiorespiratory interaction. Such an interaction was classically attributed to ‘irradiation’ between cardiac and respiratory centres, but the actual neural mechanism underlying this has been difficult to define.
The fimctional significance of RSA per se is obscure. Nevertheless, its measurement has become an important clinical diagnostic procedure for studying autonomic control systems. Indeed, it is sometimes the most relied upon parameter in prognostic investigations aimed principally at predicting death in the sudden infant death syndrome (SIDS), in which
infants are found dead, sometimes after being unattended for only a few minutes. With the elimination of other causes of neonatal death SIDS has become the largest cause o f infant
death after the first week of life. A definite cause of such deaths has not been established (see Hunt & Brouillette, 1987; Valdes-Dapena 1980, 1988a,b for reviews), and the many
anomalies in anatomy, physiology and epidemiology have tended to cloud some of the issues, as have the individual circumstances leading to SIDs. First, there is usually no clear
evidence for either. Indeed, absence of obvious pathology is a precondition of the diagnosis, hence the assumption that it represents a functional disorder of a developmental nature.
Neonates normally have periods of apnoea and it is possible that the mechanisms responsible for maintaining respiratory rhythm fail at some point leading to a terminal
apnoea. Alternatively, the cardiovascular system could be involved. At present there is no clear pathological evidence for a myocardial abnormality. However, life threatening
arrhythmias (e.g ventricular fibrillation) cannot be ruled out.
Over the last ten years there has been a widespread expectation that by measuring
parameters such as respiration and heart rate and their variability in prospective studies on a large number of infants, paediatricians could identify risk factors in those who died of
SIDS, and also define the physiological mechanisms responsible. However, the number of measurements available is limited. For long term (>24h hours) ambulatory recordings this
was restricted to ECG and respiration and possibly BEG for sleep analysis. Such studies have given mixed results. Some found an increased respiratory and heart rate variability (Gordon, Cohen, Kelly, Akselrod & Shannon, 1984) or just increased respiratory variability (Shannon,
Kelly, Akselrod & Kilbom, 1987); others show a lower overall heart rate variation in SIDS victims under one month of age compared with their controls (Schechtman, Harper, Kluge, Wilson, Hoffman & Southall, 1989).
Studies in normal infants (39-75 Hours old) indicate a dominance of low frequency modulation of the heart rate related to breath amplitude variation (not RSA), in contrast to older infants and adults where the heart rate variability is dominated by RSA (Dykes,
Ahmann, Baldzer, Carrigan, Kitney & Giddens, 1986). Heart rate and its variability increase in the first month of life and then decline over the next six months in both when awake and in quiet sleep (Harper, Hoppenbrouwers, Sterman, McGinty & Hodgman, 1976), and RSA
decreases throughout the rest of life (Shannon, Carley & Benson, 1987). Thus, RSA and
other heart rate modulations allow some quantification and comparison of autonomic parameters between statistically matched groups, leading to some workers to claim from the results ‘autonomic instability’ as a possible mechanism for SIDS (Shannon et al., 1987).
Whether these small differences in respiratory variability, heart rate and HRV genuinely could predict an impending fatal episode is unknown. They might indicate a true
difference, pointing to those infants which are ‘at risk’ but only become victims of SIDS
Department of Health guidelines (DOH, 1992) now recommend a safe ambient temperature
for infants under one year, which although halving the incidence of SIDS in the U.K. has not established the cause of death. The guidelines also recommend positioning the baby on its
back or side, but it is not known which has the most significant effect.
Any further refinement of the analytical techniques mentioned above clearly depends
upon a better understanding of the mechanisms that produce RSA and other variations in the heart period. RSA is an important component of the overall heart rate variation, however, during an apnoea there is no respiratory modulation and the pressure (baroreceptor) and
chemical (peripheral and central chemoreceptors) sources of the neural drive to the heart are
free from those periodic influences. The resultant mean heart rate depends on the ‘balance’ of the drives and the degree of control the respiratory system exerts over the cardiovascular
neural drive to the heart during apnoea.
The aim of this study is to further investigate the character of RSA and the overall heart rate variability in the anaesthetized and largely intact animal, with particular emphasis
on the modulation o f the heart rate during apnoea, during the transition from apnoea to respiratory rhythm generation, and its modification by changing chemical drives.
1.2 Respiratory Control
History. During the early 19th century LeGallois embarked on his search for the
‘respiratory centre’. It had been known since Roman times that high cervical injuries stopped
breathing (Galen of Pergamon, see Spillane, 1981) so by successive ablation of the brain and spinal cord discovered that respiration was controlled by an area located within the brainstem and hence accorded it the function "the primum mobile" o f respiratory movements (LeGallois, 1812, see Sears, 1963a). Shortly after, Flourens claimed that small lesions in this
area (le noed vitale) were able to stop respiration (Flourens, 1851). However, it was not until the classic lesioning experiments of Lumsden (1923a) in decerebrate cats that a clearer
relationship between the lesion site and the change in respiration was seen, implicating supramedullary structures in the control of breathing. By lesioning at different levels in the
brainstem he observed different gross types of respiratory state. Rostral pontine section produced long bursts of tonic inspiratory activity which he termed inspiratory apneusis. In
the upper half o f the pons he defined a ‘pneumotaxic centre’ which produces normal breathing rhythm by inhibiting the apneustic centre, which otherwise would be tonically
Lumsden’s lesions were necessarily gross and suffered from all manner of experimental problems, nevertheless, they showed that respiratory rhythm generation is distributed over the brainstem, and is resistant to quite marked insult.
Lumsden (1923b,c) showed that these areas were under chemical and nervous control.
Hypercapnia stimulated all the centres and hypoxia particularly affected the apneustic centre,
determining the depth of apneusis. During either phase o f apneustic respiration, vagal
stimulation inhibited the existing phase and released the reverse phase.
Electrical stimulation of the medulla promotes both inspiratory and expiratory responses (Pitts, Magoun & Ranson, 1939a,b; Andersen & Sears, 1970). Using strong tetanic
stimulation a variety o f respiratory responses were obtained from most medullary sites. However, two responses dominated, inspiratory or expiratory apneusis, the former
corresponding to the sustained inspiratory apneusis due to rostro-pontine lesions. Pitts (1946) concluded that respiratory rhythmogenesis could be produced by either an inherent
rhythmicity of the medullary centres, or, more likely, that the inspiratory and expiratory centres were tonically active and were periodically inhibited by the pneumotaxic centre or vagus inputs to produce rhythm.
Functional anatomy. The anatomical location and functional connectivity of the
respiratory related neurones in the medulla have been extensively reviewed (Euler, 1986;
Feldman, 1986; Monteau & Hilaire, 1991).
Briefly, neurones with respiratory related discharges are found in the medulla, concentrated in, but not restricted to, two main areas known as the dorsal and ventral respiratory groups (DRG and VRG). The former is in the lateral part of the Nucleus of the Solitary Tract (NTS), the latter is further subdivided into a caudal part (cVRG) which
includes the N. ambiguus (nA) and N. retroambiguualis, and a rostral part (rVRG) which
includes the area designated as the retrofacial nucleus.
Respiratory neurones within the DRG and VRG have been classified by their pattern
o f discharge, location of the cell body and by their axonal projection. Three main populations are recognised. 1, Bulbospinal neurones sending an axon towards the spinal cord, which transmit the respiratory drive to the respiratory motoneurones (diaphragm, intercostal and
abdominal muscles). 2, Cranial motoneurones sending axons into cranial nerves which control the upper airways (vagal or glossopharyngeal), and 3, Propriobulbar neurones whose
axons remain within the brainstem.
rostral and 1.7-2.5mm laterally. Most of the DRG neurones receive an inspiratory drive of central origin and show a peak firing late in inspiration (Berger, 1977). Almost all the
neurones have a spinal axons (Bianchi, 1971). The DRG neurones can also be subdivided into several functional groups. R„ bulbospinal neurones are inhibited by increases in lung
volume (Baumgarten & Kanzow, 1958) whereas Rp are excited by lung inflation. Another group of cells in the DRG (P-cells) fire synchronously with lung inflation (Fedorko, Merrill
& Lipski, 1983) but do not receive an inspiratory drive of central origin, and in the paralysed ventilated animal cease discharging when lung inflation is withheld (Berger, 1977). 50-90%
of the DRG inspiratory neurones are bulbospinal, crossing the midline rostral to the obex and projecting to phrenic and external intercostal motoneurones (see Feldman, 1986; Monteau
& Hilaire, 1991).
The VRG is more extensive than the DRG, extending from the N. retrofacialis to the
first cervical roots. In the most caudal and rostral areas are expiratory neurones. In between and overlapping are the inspiratory neurones o f the rVRG. (This region correspond to the rostral part o f the nRA (Merrill, 1970; 1974) or to the N. para-ambigualis (Kalia, 1981a). In
the cat the reported number o f inspiratory bulbospinal neurones varies considerably from 45-51% (Bianchi, 1971; Hilaire & Monteau, 1976) to 88-100% (Merrill, 1970; Fedorko, Hoskin & Duffin, 1989). Various firing patterns are seen in this region with most of the augmenting inspiratory type neurones showing a bulbospinal projection. There is also a small population of neurones which have a decrementing pattern during inspiration which are propriobulbar (Feldman, 1986). The bulbospinal neurones in the rVRG are the source of
excitatory inputs to the phrenic and intercostal motoneurones.
The expiratory bulbospinal neurones are located caudally in the VRG, extending from
the first cervical roots to a region of overlap with the inspiratory neurones o f the rVRG. The full extent o f the overlap is unknown, as no experiments have been reported taking into account the pattern of breathing and ‘state dependent balance’ between inspiratory and
expiratory activities (see Wyman, 1977; Bainton, Kirkwood & Sears, 1978b).
Few if any axons from the cVRG neurones terminate within the brainstem (Feldman,
Sommer & Cohen, 1980; Merrill, 1974). Almost all send axons to the contralateral spinal
cord and to the expiratory motoneurones (see Monteau & Hilaire, 1991). They show an expiratory augmenting pattern starting either early in expiration or with a variable time lag
Kogo & Koshiya, 1987), terminating with an abrupt repolarization on inspiration. There is
no evidence for the existence of concurrent IPSPs during the active phase (Richter, Camerer, Meesmann & Rohrig, 1979; Ballantyne & Richter (1986) showed that the shape and time course of the membrane potential depended upon the overall breathing pattern, which may
develop smoothly during the expiratory phase or proceed in two stages, separated by a transition phase of hyperpolarization in the early part of expiration.
In the most rostral part of the VRG is a region known as the Botzinger complex
(Lipski & Merrill, 1980), or the retrofacial nucleus (Kalia, Feldman & Cohen, 1979). It mainly contains neurones which have an augmenting firing pattern, which fire at a high frequency at the end of inspiration (Lipski & Merrill, 1980; Otake, Sasaki, Ezure & Manabe,
1988; Fedorko, Duffm & England, 1989). These neurones send a major inhibitory projection
to other respiratory neurones and also send axons to the contralateral spinal cord (Merrill, 1982). Intracellular recordings from Botzinger neurones show a progressive depolarization
throughout expiration (Otake, Sasaki, Mannen & Ezure, 1987). but only about 30% of them can be antidromically activated by spinal stimulation (Otake et al., 1987; Blanchi, Grelot, Iscoe & Remmers, 1988). Therefore it would appear that the majority of these neurones are propriobulbar. They are located in the ventromedial border of the retrofacial nucleus and their axons project caudally to both the ipsi- and contralateral brainstem, giving off collaterals within the Botzinger complex, retrofacial N. and nA (Otake et al., 1988), the latter including
inhibitory axons.
The retrofacial area also contains inspiratory neurones and motoneurones associated with the upper airways (Grelot, Blanchi, Iscoe & Remmers, 1988).
The dorsolateral rostral pons contains inspiratory, expiratory and phase-spanning (inspiratory-expiratory) neurones in the regions of the N. parabrachialis and the
Kolliker-Fuse nucleus. This area correspond to the levels containing Lumsden’s
pneumotaxic centre.
Rhythm Generation. How does the regular cycle of inspiration and expiration occur,
and how is this activity modified by external inputs to maintain gaseous homeostasis? (for reviews see, Cohen, 1979,1981; Euler, 1983,1986; Richter, 1982; Richter & Spyer, 1990;
Sears, 1990).
During inspiration the downward movement of the diaphragm and the contraction of
passively recoil under their own elastic recoil forces. Eupnoea in man shows little or no early expiratory activity, but expiratory muscles do show activity in late expiration (Newsom Davis, Sears, Stagg & Taylor, 1966) which is increased markedly in phonation, exercise and
with pathology. However, in most descriptions expiration is given a passive role (Euler,
1983).
This view of respiration is reflected in the neural output of the phrenic nerve, which
shows a ramp of increasing activity terminated by an abrupt silence as the expiratory phase begins. It is not surprising that this concept should be used to model respiration. The ramp
can be explained by integration of an augmenting synaptic input due to the recruitment in number and frequency of the inspiratory pre-motor neurones. However, a mechanism is then
required to terminate inspiration, and to create a pause (the expiratory (E) phase) until the next inspiratory ramp occurs. Thus, the eupnoeic pattern o f breathing is defined (Cohen,
1979).
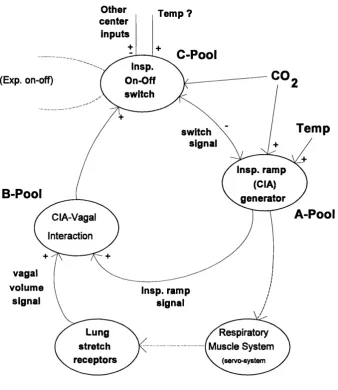
To summarise their results from the study of chemical and thermal drives and volume-time relationships in respiration, von Euler and colleagues (Bradley, Euler, Marttila & Ross, 1974a,b, 1975; Euler & Trippenbach, 1975) developed a model (Fig. 1.2.1) which
encapsulates the idea of an integrating inspiratory centre.
This model is based on a pool of neurones (A-Pool) which generate a conceptual central drive (central inspiratory activity, CIA) to the inspiratory motoneurones, which is
reflected in the ramp of activity seen in the integrated phrenic neurogram. The time course of the A-Pool ramp of activity is strongly dependent upon the prevailing chemical (net CO2 drive from central and peripheral chemoreceptors) drive. Thus, the output to the inspiratory motoneurones is a product of the chemical drive and t, the time the ramp is allowed to increase. The A-Pool also provides a conceptual input to the B-Pool o f neurones. The
B-Pool combines the CIA input from the A-Pool and the volume signal (vagal) from the pulmonary stretch receptors mediating the Breuer-Hering reflex to form an input to the third
group o f neurones (C-Pool) which acts as an ‘off-switch’ (the non-linear element o f the system) to terminate the CIA. This means that when there is no pulmonary input (i.e. after
vagotomy) the CIA itself terminates inspiration by activating the B and C pools
When the C-Pool reaches a threshold it abruptly switches off the A-Pool neurones,
volume with a given rate of rise in inspiratory activity (Bradley et al., 1974).
Other center
inputs
Temp ?
C-Pool
Insp. On-Off switch
CO
(Exp. on-off)
Temp
switch signai
insp. ramp (CiA) generator
B-Pool
A-Pool
CIA-Vagal Interaction
vagal volume
signal
insp. ramp signal
Lung stretch receptors
Respiratory Muscle System V (servo-system
Figure 1.2.1 Model o f inspiratory off-switch mechanism. Redrawn from Bradley, Euler, Marttila & Roos (1975). See text for detailed description.
It has been suggested that the progressive increase in off-switch excitability might be derived from a separate ‘timing integrator’ independent from the CIA integrator (Younes, Remmers & Baker, 1978; Speck & Feldman, 1982). Thus, modulation of the C-Pool
‘off-switch’ mechanisms is important for the control of volume and rate in the intact animal.
In the absence of lung afferent input, the C-Pool ‘off-switch’ mechanism is disabled in the low decerebrate animal or with lesions in the N. parabrachialis, as previously discussed.
for normal operation the pattern generator is in series with the system, hence; "no rhythm, no drive" (Sears, 1990).
When inspiration has been terminated by the action of the off-switch, the CIA is kept inhibited during the expiratory phase. These central inspiratory-inhibiting (CII) effects are
most powerful in early expiration, and decay during expiration until a threshold is crossed and the CIA mechanisms can initiate an inspiration (Euler, 1986). The decay rate o f CII is
slowed by lung inflation (increasing Tg), and increased by inspiratory-facilitating influences such as the ‘deflation reflex’, which shortens the expiratory duration (Knox, 1973; Knox &
King, 1976).
During the expiratory phase the inspiratory activity is assumed to be inhibited, even
though there is continuous excitatory influence by the chemical drive (Bradley et al., 1975).
The expiratory duration is governed by a declining CII, which may be facilitated by influences like the ‘deflation reflex’, which shortens the expiratory duration (Knox, 1973; Knox & King, 1976). In contrast, lung inflations decrease the decay rate of the CII thus prolonging the expiration (Clark & Euler, 1972; Knox, 1973).
Richter, Ballantyne & Remmers (1986) proposed an alternative model of respiratory rhythm generation, based upon knowledge of the neuronal network, discharge properties of the respiratory neurones and the modulation of synaptic excitability. In contrast to Euler’s model which only addresses the phasing of respiration in terms of gross output, i.e.; inspiratory and expiratory phases, Richter introduces a third phase called the post-inspiratory phase, which corresponds to the declining activity seen in the phrenic nerve at the onset of
expiration. Six classes of respiratory neurone are characterized by their firing patterns and timing with reference to the phrenic nerve, which are used to form a network.
There are inspiratory and expiratory bulbospinal neurones providing the drive to the motoneurones, and four classes of intemeurones (propriobulbar); early inspiratory (e-I);
ramp inspiratory (Ir); late inspiratory (L-I) and post-inspiratory (p-I). The e-I and p -I constitute key elements in the model. They have an abrupt onset in discharge, reaching their
peak frequency quickly before declining. Richter et al. (1986) propose that these two neurones act as ‘oscillating’ neurones each inhibitory to the other and each to the other four kinds o f neurones. The Ir and e-I neurones are fed with a tonic excitatory drive from the
classical ‘reticular activating system’ (RAS). Inspiratory activity is accumulated by recycling synaptic excitation within the Ir neurones (cf. Long & Duffm, 1984).
Electro Motive Force, EMF) to power the process of CIA generation (cf. Bainton, Kirkwood
& Sears, 1978a). A proposed sequence of phasic activation and inhibition then follows, with the p-I having the essential role of exerting widespread inhibition throughout the network,
directly inhibiting the e-I, Ir, Irs and E neurones, and through a parallel inhibition of the
reticular formation, the disfacilitation of the Ir, e-I and E neurones, thus irreversibly
terminating inspiration.
An essential feature of this model is the recycling synaptic excitation within the Ir
neurones which is the CIA ramp of activity. In the model this ramp is transmitted to the Ig^ and L-I neurones. However, as Sears (1990) points out, it is not necessarily the Ir neurones
which are forming the inspiratory ramp, and there is evidence for involvement o f the Igg in rhythm generation. Recent work by Ezure and Manabe (1989) shows the Igg neurones are
monosynaptically coupled to their contralateral counterparts in the VRG, making it likely, though not proven, that the short term synchronization seen among ipsilateral neuronal pairs
(Feldman & Speck, 1983) has the same mechanism. If this is found to be true, the role of the Igg in rhythm generation needs to be reexamined because the Igg could play a significant role in rhythm generation, as their output could form the CIA to the ‘off-switch’ mechanism.
Central respiratory drive potentials (CRDPs ). At the respiratory motoneurone level
Eccles, Sears & Shealy (1962) and Sears (1963b) were able to demonstrate an important functional feature of the respiratory output. From intracellular recordings o f the respiratory
motoneurones during spontaneous breathing they were able to show that neurones undergo rhythmic depolarization and repolarization which was abolished by transection of the spinal cord. If the membrane potential reached threshold then some neurones would give an output, but substantial numbers only displayed membrane oscillation alone at eupnoeic levels of
drive. This finding challenged the idea that the discharge o f respiratory neurones originated solely from an alternating burst of excitation from the ‘respiratory centres’ and emphasised
a much more significant role for integration at the segmental level than had been previously
supposed. This waxing and waning of the membrane potential was named the central respiratory drive potential (CRDP) to link it with the supraspinal demand for breathing movements, and to distinguish it from the synaptic inputs contributing to segmental stretch
reflexes.
The CRDP could have been interpreted simply as representing the waxing and waning
is a phase reversal of the membrane potential during the antagonistic phase indicating that neurones were indeed receiving periodic inhibitory drives o f central origin alternating with excitation. Phase reversal by hyperpolarizing current has also been demonstrated in phrenic
motoneurones, (Berger, 1979) and both procedures proved subsequently essential to the dissection o f the process underlying rhythm generation particularly in the work of Richter
and colleagues.
The intemeurones presumed to mediate the inhibitory phase of the CRDP are closely coupled to the excitatory drive to the antagonistic motoneurones and the degree of
hyperpolarization mirrors the breath by breath variations o f their discharge (Sears, 1964c).
Initially indirect, (Aminoff & Sears, 1971) and now direct evidence is available that some o f the relevant intemeurones are segmental, Kirkwood & Sears (1989).
Central Apnoea. What happens when there is no central respiratory rhythm
generation? From the models previously described it would be expected that the respiratory motoneurones would be silent, but this is not the case,
Lumsden (1923a) showed that transection of the pons resulted in a prolonged inspiration which he called inspiratory apneusis. Later, Stella (1938) showed that rate and
depth of apneusis was influenced by CO2 tension. With low CO2 the apneustic activity was absent or very small. As CO2 was increased the apneustic activity increased concomitantly. Importantly this is accompanied by a reciprocal inhibition of the expiratory output (fusimotor and a-motoneurone activity) (Sears, 1964b).
Andersen & Sears (1970) stimulated tetanically in the region of the N reticularis
gigantocellularis and ventralis, the areas from which inspiratory and expiratory ‘apneusis’ is obtained by electrical stimulation (Pitts et al., 1939). They found that sectioning o f the
dorsal roots decreased the tonic output, and concluded the apneustic response was mediated by two different mechanisms; one involving a direct effect on the a-motoneurone, and the
other the activation of fusimotor neurones and thereby the spindle loop.
Cooling of the medulla (Budzinska, Euler, Kao, Pantaleo & Yamamoto, 1985) also leads to apneustic activity. Similarly the tonic activation o f medullary inspiratory and
expiratory neurones occurs in hypocapnic apnoea (Nesland, Plum, Nelson & Siedler, 1966;
Batsel, 1967; Cohen, 1968).
neurones had this response and two-thirds of the phasic E neurones.
In the Type 2 response, lowering CO2 reduces the phasic modulation and may increase firing rate, and at sufficiently low CO2 the discharge becomes completely tonic in about 50% of all E neurones and 80 % of E -I neurones. This type of response to hypocapnia is observed in most E motoneurones and muscles (internal intercostal, laryngeal).
Thus, in the absence of central respiratory rhythm the basic state is ‘expiratory
apnoea’ where previously active E motoneurones (Sears, 1964b; Bainton, Kirkwood & Sears,
1974) and many brainstem E neurones exhibit tonic activity.
This state also occurs in apnoea under other conditions: elimination o f descending
inputs projections (Bainton et al, 1974, 1978a), deep anaesthesia, (Koepchen, Klussendorf & Phillip, 1973) and during the absence of breathing movements in the fetus (Bystrzycha,
Nail & Purves, 1977), and in the conscious dog (Homer, Kozar & Phillipson, 1994).
The type 3 response shows a reduction in the firing in the high-frequency portion of
the cycle with relatively little change in the low-frequency, so that eventually neurones of this type lose their respiratory modulation and fire tonically. This response is typical of pontine neurones and was observed in 70% of tonically firing I and E modulated neurones.
Euler (1983) questions whether the tonic activity seen in hypocapnic apnoea represents ‘genuine’ respiratory activity or if it reflects any of the non-respiratory inputs. Duron (1966, 1973) has emphasized a purely ‘postural role’ for the tonic activation o f the intercostal motoneurones, such activation would have an important role in the stabilization
of the rib cage by optimizing the position of the diaphragm (see Da Silva, Sayers, Sears & Stagg, 1977).
In the decerebrate cat ventilated with O2 and CO2, Bainton et al., (1978a) showed that during hyperoxic hypocapnic apnoea there is a tonic output o f either the expiratory or inspiratory motoneurones (EMG). Experiments were classified as either having an inspiratory
or expiratory bias depending on whether the tonic activity was inspiratory, or the more
frequently seen tonic expiratory activity, which proved to be more stable than the inspiratory tonic activity. The tonic expiratory activity showed a graded increase with rising F^jC02
Sears (1964c), Aminoff & Sears (1971) and Merrill (1974) have shown that the excitatory drives to inspiratory and expiratory motoneurones are associated with reciprocal
inhibition of their respective antagonistic motoneurones. Therefore, as the COj dependent drive is increased there is a progressive inhibition of the opposite activity (if present) until,
at the onset o f rhythm, there is inhibition of the expiratory activity by inspiratory activity and an oscillating pattern of respiration begins. Thus, the two states (tonic and rhythmic) are not
necessarily independent processes but represent two aspects of the same bulbospinal drive. Slowly lowering the PaCOj from a state of rhythm generation invariably led to
elements of rhythm persisting at low levels of PaC0 2, although eventually it was abolished (Bainton et al., 1978a). This delay was probably due to the washout time of P^COz from the
brain which creates a hysterisis in the CO2 vs Rhythm response curve. The onset of rhythm at relatively low levels of PaC0 2 restricted the range over which the PaC0 2 could be titrated.
A mid-sagittal lesion of the medulla in the region of the obex has shovm to abolish the activity o f spinal respiratory neurones in the cat (Salmoiraghi & Bums, 1960; Sears, 1966). Bainton et al. (1978a) used sagittal lesions in the vicinity o f the obex (obex-2.0mm
rostrally) to intermpt the axons of the inspiratory bulbospinal neurones which decussate rostral to the obex (Merrill, 1974). With rostral extension of the lesions they found that the CO2 threshold for rhythm generation was elevated to as high as 50-60 torr, but such lesions left the expiratory bulbospinal output substantially intact. This enabled the CO2 titration of the tonic activity to be extended into the eupnoeic range, and above, without the occurrence of respiratory rhythm; rhythm could only be inferred from the periodic inhibition of
expiratory activity, as all inspiratory activity ceased following the lesion. Because the inspiratory drive was abolished, any reciprocal effect on the expiratory motoneurones at the
segmental level was removed allowing the full extent of the CO2 drive to be revealed. All the CO2 related responses were abolished when the lesion was extended caudally to the level of the first cervical segment, indicating that these effects were dependent on fibres decussating at these levels, namely those from expiratory bulbospinal neurones.
Single unit recordings of medullary expiratory neurones and their corresponding motoneurone discharges in the intercostal filaments at different levels of CO2 confirmed these results by clearly shoving that the same bulbospinal respiratory neurones convey both tonic
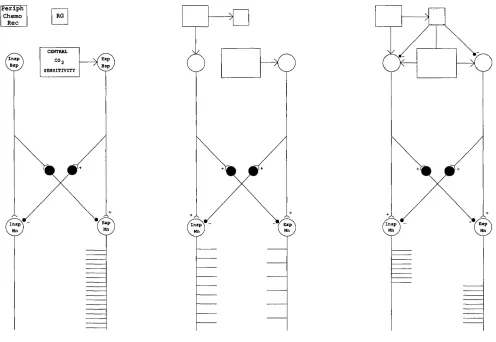
HYPEROXIC - HYPOCAPNIA HYPOXIC - HYPOCAPNIA HYPOXIC - NORMOCAPNIA
Periph
Chemo RG Rec
Bap
« 2
Exp
Figure 1.2.2 Schematic representation of brain-stem-mediated central and peripheral chemoreceptor drives to respiratory motoneurones rhythm generator (RG), operative only in right-hand (hatched) panel. Insp and Exp bulbospinal (Bsp) and motoneurones (Mn). See text for details.
motoneurones. As the bulbospinal inspiratory neurones are inactive during hypocapnic
apnoea there would be no reciprocal inhibition of the inspiratory motoneurones, thus allowing the expiratory motoneurones fully to express the prevailing tonic expiratory
bulbospinal drive. When CO2 is slowly elevated, but before the onset o f rhythm, tonic activity may occur in both inspiratory and expiratory groups in hypocapnic apnoea (Bainton et al., 1978a; Sears, Berger & Phillipson, 1982).
The above experiments were made in hyperoxic hypocapnic apnoea where the
peripheral chemoreceptor input is minimal. If however, a peripheral chemoreceptor input is added (Fig. 1.2.2 centre panel), it produces a tonic inspiratory bias to the system (Sears et al.,
1982). With graded hypoxia there is a graded discharge of inspiratory motoneurones and a graded reciprocal inhibition of expiratory motoneurones discharge, thus causing an ‘inspiratory shift’ in the pattern of respiratory motoneurone activation. If O2 is reduced further, rhythm is now seen as a periodic, expiratory phased inhibition of the tonic inspiratory discharge.
Sears et al. (1982) recognised three distinct effects of hypoxia. First, during normoxic normocapnia, hypoxic stimulation of peripheral chemoreceptors causes an increase in peak phrenic and external intercostal muscle activity with a reciprocal decrease in expiratory activity; a similar pattern occurs with deepening anaesthesia. Second, during normoxic hypocapnic apnoea, hypoxic stimulation of the peripheral chemoreceptors increases the tonic discharge of phrenic and external intercostal motoneurones, and there is a graded reciprocal
inhibition o f the tonic expiratory discharge. Thus the ‘inspiratory shift’ is expressed independently o f rhythm generation. This state, when there are balanced drives (peripheral
and central), giving co-activation of inspiratory and expiratory neurones, is represented schematically in Fig. 1.2.2 (centre panel). If either the PaC02 was increased, or hypoxia added, respiratory rhythm started. The third effect of hypoxia is a dynamic version of the
second with the pump switched off.
The right hand panel of Fig. 1.2.2 illustrates the onset of rhythm generation following
a further increase in either the hypoxic or peripheral chemoreceptor drive and this is seen to be sculpted from inhibition of the underlying tonic expiratory activity (Sears et al., 1982; Berger, Phillipson & Sears, 1982). If the animal is ‘inspiratory biased’ then increasing
hypoxia or hypercapnia stimulation leads to the onset o f rhythm due to periodic expiratory phased inhibition of the tonic inspiratory motoneurone discharge.
concepts and experimental results do not exclude the mechanisms of previous models, but help to enhance their understanding. Conceptually the condition of apnoea is often regarded
as being the absence of respiration, both neurally and mechanically. However, it is not possible to ignore the relevance of the these results when the same neurones are involved in
both ‘states’. Thus, in terms of chemical drive the apnoea is the respiratory ‘state’ in the absence o f rhythm generation.
Clearly these two major states of respiration are not equivalent. At high levels of CO2, and with the addition of peripheral chemoreceptor inputs the inspiratory neurones provide an overriding drive for oscillation. When CO2 is lowered the expiratory part of the drive is revealed. The marked asymmetry of such an arrangement would guarantee respiratory rhythm generation in all but the most extreme circumstances.
Narcotics such as morphine are known to depress the ventilatory response to CO2 (see later), Howard & Sears (1991) have recently shown in the rabbit that morphine elevates the CO2 threshold for rhythm generation without significantly depressing the inspiratory or expiratory response to increasing F^C02, either in the rhythmic or tonic state. Morphine had no effect on the threshold of the recruitment of fusimotor or a-motoneurones, which with
increasing F ^ C0 2 showed a continuous recruitment up to and beyond the pre-morphine CO2 threshold. The primary effect on ventilation was a prolongation of the expiratory duration (Te). Morphine did not significantly alter the amplitude of either the inspiratory output, thus morphine decoupled the mechanisms through which the chemical drives gained access to the
motoneurones fi*om those concerned in the process of rhythm generation, further supporting the idea that the ventilatory drive (central and peripheral chemoreceptors) has a relatively direct access to the bulbospinal neurones as opposed to the Euler model in which the central
and peripheral chemoreceptor drives can only drive the bulbospinal neurones through the central pattern generator mechanism.
Therefore, morphine can be used in a similar way to the saggital lesions for studying the tonic drives of hypocapnic apnoea over an extended range.
1.3 A utonom ic regulation o f the heart
The neural control of the heart is mediated by both parasympathetic and sympathetic innervation which together control the heart rate and contractile force to meet the current
hence contribute principally to respiratory sinus arrhythmia (RSA), which is the acceleration
of the heart during inspiration and the slowing of the heart during expiration. RSA is almost completely abolished by atropine or vagotomy, and the cardiomotor fibres responsible have
their origin in two possible areas of the brainstem, the dorsal motor vagal nucleus (DMV) and the nucleus ambiguus (nA) (see Loewy & Spyer, 1990 for review).
1.3.1 Anatom y
Dorsal motor nucleus o f the vagus (DMV). The DMV is located dorso-medially in
the caudal medulla near the fourth ventricle. In the cat it comprises a 10- 15mm column of
cells extending rostrally from the first cervical spinal segment lying dorsal lateral to the central canal (Kalia, 1981b). The DMV is composed o f two types o f neurone, 80% medium sized neurones which are nearly all vagal motoneurones, and 15-20% small cells which either project to other levels of the brainstem, or are intrinsic neurones terminating within the
DMV. The DMV projects to the heart, lungs, bronchi, pharynx, stomach and intestines (Kalia & Mesulam, 1980b; Kalia, 1981b and Hopkins, 1987 for reviews). Cells innervating the
supradiaphragmatic structures lie within the lateral third of the nucleus whereas the medial two thirds innervate subdiaphragmatic structures, but with extensive overlapping (Kalia,
1981b).
Cardiac Innervation. The role of the DMV in the control of the heart remains unclear
and controversial (see Loewy & Spyer, 1990 for review). Early experiments in the dog
reported that electrical stimulation of the DMV elicited a bradycardia (Miller & Bowman, 1916) and confirmed later (Gunn, Sevelius, Puiggari & Myers, 1968; Weiss & Priola, 1972); and for the rabbit (Ellenberger, Haselton, Liskowsky & Schneiderman, 1983); and rat
(Nosaka, Yamamoto & Yasunaga, 1979); but not the cat (Calaresu & Pearce, 1965; Geiss & Wurster, 1980b; Gunn et al., 1968). However, DMV stimulation in the cat, decreased the
strength (dP/dt^aJ of ventricular contraction (Geis, Kozelka & Wurster, 1981). And in both cat and dog stimulation of the DMV and nA showed a decrease in ventricular contraction, but only nA stimulation slowed the heart; cardiac pacing during nA stimulation removed the
inotropic effect indicating it was secondary to the bradycardia. In neither group of experiments was the heart paced during DMV stimulation, therefore, a pure inotropic effect of DMV stimulation has not been confirmed. But clouding all of these results is the problem
of the inevitable current spread to adjacent sites, especially in the NTS.
sparse axonal degeneration of the cardiac branches of the vagus (Calaresu & Cottle, 1965), whereas injections of HRP into the right myocardium show marked labelling of the nA, and
a sparse labelling of the DMV and the intermediate zone (rat: Stuesse, 1982; cat: Geiss & Wurster, 1980a; Kalia & Musalam, 1990).
Direct application of HRP to the cardiac branches of the vagus shows a clear labelling
of the nA and DMV (rat: Nosaka et al., 1979; dog: Bennett, Kidd, Latif & McWilliam, 1981; Hopkins & Armour, 1982; cat: Sugimoto, Itoh, Mizuno, Nomura & Konishi, 1979; Bennett
et al., 1981; Jordan, Spyer, Withington- Wray & Wood, 1986). Bennett et al. (1981) found approximately equal distribution of labelling in nA and DMV from both pulmonary and
cardiac nerves in the cat, in contrast the dog showed much more labelling in the n A than the DMV, and in the rat also (Nosaka et al., 1979). Injections into the myocardium around the sino atrial node are fraught with difficulty both in accuracy o f placement, and restricting its
spread to other structures. Similarly, the use of the cardiac nerve in the cat creates problems because proximally it contains a pulmonary branch (McAllen & Spyer, 1976).
Antidromic Activation. Antidromic mapping techniques have also been used to locate
the origin of the cardiac preganglionic neurones. McAllen & Spyer (1976) in the cat found that neurones in the nA could be antidromically activated by electrical stimulation of the right cardiac vagal branches, whose axons had conduction velocities in the B-fibre range (3-15 ms’'). When neurones were sampled in the DMV most were found to send axons down
the thoracic vagus below the cardiac branches. Only 3/33 could be antidromically activated with high intensity stimulation, but it was though that these were unlikely to be cardio- inhibitory based upon their thresholds and conduction velocities. In contrast, Cirello & Calaresu (1980, 1982) have antidromically activated neurones in both the nA and DMV
regions with latencies corresponding to B-fibre velocities. Bennett, Ford, Kidd & McWilliam (1984a) have also identified neurones in the DMV with non-myelinated axons in the cardiac
and pulmonary branches. Only a small number showed spontaneous activity, the rest being silent. Spontaneous and DL-homocysteic acid (DLH) activated neurones showed no relation to the cardiac cycle, increased BP or lung inflation. In an extensive investigation in the cat,
94 neurones in the DMV have been analyzed by antidromic stimulation, for their cardiac (55/94) and pulmonary (39/94) projections (Ford, Bennett, Kidd & McWilliam, 1990). All
but a few had C-fibre conduction velocities and were assumed to be non-myelinated fibres. Extracellular recording showed little spontaneous activity, and only one neurone responded