1950 IJSTR©2019
Optimal Power Service Restoration Using
Artificial Bee Colony Algorithm
Margret Kwamboka Gechanga, Keren K. Kaberere, Cyrus Wekesa
Abstract: Power service restoration (PSR) is a process of restoring the power supply after a black-out. It aims at restoring the power supply rapidly while meeting all the system operation constraints. A lot of research has been and is being done on power service restoration in order to come up with better restoration methods. In this study, swarm based meta-heuristic algorithm Artificial Bee Colony (ABC) technique was applied for optimal network restoration in a distributed generations (DGs) connected distribution network after a fault(s). The proposed ABC based restoration algorithm and the load flow analysis were simulated using MATPOWER in MATLAB. The objective of the study was to minimize out-of-service loads and power losses of the network while improving the voltage profile. The study considered two cases (single-fault and multi-fault case) each with five different scenarios. In the first scenario, power losses and voltage profile results of the initial network were analyzed, the second scenario analyzed results of the initial network after the restoration process, the third scenario analyzed the results of the modified network configuration(network with DGs), the fourth scenario analyzed the results of the modified network configuration after a contingency is introduced in the network and the last scenario analyzed the results of the modified network configuration after the restoration process. The proposed algorithm’s results were compared with those of existing methods to validate its performance and effectiveness. The application of the algorithm for network restoration ensured optimal restoration of all the loads and the load flow analysis on the restored networks showed a significant power loss reduction and improvement in minimum voltage.
Index Terms: Artificial bee colony algorithm, distribution network, distributed generation, power losses minimization, power service restoration. ————————————————————
I
NTRODUCTION1
RELIABLE power supply is vital for day to day operations and its demand is on the exponential rise. Consequently, this high demand has resulted in high vulnerability of the power system to failures. This has made reliability of supply gain focus and be considered an important parameter in power system planning and operation. Power service restoration (PSR) which is a process of restoring the power supply after a black-out, lays a foundation for achieving self-healing distribution networks [1]. This plays a significant role in improving the power reliability and quality of a given distribution network leading to the reduction in the losses incurred during power blackouts [2]. Studies have been conducted on power service restoration and many methods have been proposed for both the active distribution network and traditional distribution network. Further, with the upcoming smart grid concept to deal with the problem of the high penetration rate of DGs, the topic has attracted lots of attention and is being studied, researched and new improved methods are being developed. These methods are based on mathematical methods, heuristic search or artificial intelligence algorithms. Mathematical optimization methods are fast in terms of computation time and are able to get global optimum for small networks. However, with the growth in the power sector, the distribution network structure is becoming more and more complex, hence leading to greatly extended computation time. This means that this method cannot handle complex large-scale systems. The capability of artificial intelligence optimization is strong compared to the mathematical and heuristic search methods, and this has motivated researchers to come up with algorithmic methods that apply optimization techniques such as Tabu search, Firefly Algorithm (FA), Particle Swarm Optimization (PSO) Algorithm and Genetic Algorithm (GA) to seek the global optima [3]. In [4], binary particle swarm optimization (BPSO) and brute-force attack method (BFAM) have been used to come up restore a faulted area distribution system. The method is reported to have restored the system but can only be used for networks with a few number of loads. In [5], [6]
1951 algorithm solves the restoration problem with flexibility.
However, the approach used requires tuning for the specific problem at hand and being an iterative method the hope of finding the best solution at the very beginning is naive which may turn to be time consuming. Bearing in mind the above mentioned merits and gaps on the proposed methods there is need to research on the other optimization techniques in an attempt to come up with power restoration methods which are better and more reliable. The Artificial Bee Colony (ABC) that utilizes its triple search operator and greedy selection scheme to maximize the possibility of finding the optimal solution in a short time has not been used in this study.
P
ROBLEMF
ORMULATION2
Service restoration problem aims at minimizing the out-of-service customers after interruption of power supply while ensuring minimum network loss through network reconfiguration which satisfies the operational constraints. The process should be carried out as fast as possible, to minimize the economic losses and maintain the power quality within the limits [14].
The objective function for this research is to minimize the number of unserved loads at any given scenario while ensuring minimum power loss in the network. It is expressed as shown in (1):
( )
Where,
(
)
n denotes total number of buses and (i = 1, 2,….n)
Li denotes load at bus i
Si denotes the load status in terms of being energized i.e. Si = 1 if the load is energized and Si = 0 if the load is not energized.
Pl denotes line section/branch power losses
r denotes line section/branch resistance
P, Q, I and V, stands for active power, reactive power,
voltage and current.
To ensure the proposed method meets the system operation requirements, the following constraints were adopted.
Load-generation balance constraint: The amount of power generated should balance the power demand and losses. Also, there should be some reserve capacity to cater for the small perturbations on the network. This constraint is summarized by (5) below;
Where,
PG – is the available generated power, PD – is the Load power demand to be met, Pl(total) denotes total power losses of the network and PR denotes the power reserve
Voltage constraint: The voltage in all the buses should be within the acceptable limits. This is expressed by (6) below;
Where,
Vi – is the bus i voltage, Vmin denotes the minimum voltage
limit and Vmax denotes the upper voltage limit.
Overload constraint: The current in the branches should not exceed the maximum current allowed. This is given by (7) below;
Where,
Ii is the current in a given line section and Imaxis maximum allowable current.
Generator constraint: The generating source output should be within the allowable limits as given by (8).
Where PGi , PGmin and PGmax denotes the actual power output, the lower limit and upper limit of the generation source i.
The network radial topology constraint: At all times, each loop should only have one switch open so as to maintain radial topology. The constraints for the tie switches and sectionalizing switches are represented by (9) and (10) as given in [15].
Where, Sl represents a set of line sections and n is the number of buses.
By considering the constraints, the optimization algorithm will mathematically determine the most optimal solution to the optimization problem under consideration.
P
ROPOSED SOLUTION TECHNIQUE3
3.1 The ABC algorithm
The ABC algorithm was proposed by Karaboga for numerical optimization problems[16]. Its simulation imitates the foraging behavior of bees. It inspects the behavior of real bees when searching for nectar and information sharing of the best food sources to the bee swarm. The algorithm has three main agents as outlined below.
The Employed Bees: They normally stay on the food sources and provide information on the neighborhood of the food source in their memory.
The Onlooker Bees: They obtain crucial information on the possible food sources from the employed bees at the dance area and depending on their probabilities they select the best from which they can gather nectar.
The Scout: This is the bee with the responsibility of finding the new food sources.It is normally only one bee at a time.
When simulating the ABC algorithm, the colony consists of all the three groups of bees which fly in a D-dimensional search space to find the optimum solution [17]. The colony is divided into two halves, with the employed bees forming the first half and the onlooker bees forming the second half. In each iteration each employed bee is allocated to a single food source. Therefore, the number of food sources around the hive equals the number of artificial employed bees. When the employed bee exhausts its food source it automatically turns to be a scout bee.
The search for the best food source consists of several cycles with each search cycle comprising of three main steps:
moving the employed and onlooker bees onto the possible food sources,
1952 IJSTR©2019
food sources
determining the scouts and directing them onto random food sources
The exploration and exploitation processes are carried out simultaneously to make the search process robust. The scouts control exploration process whereas, the exploitation process is carried out by the onlooker and employed bees [18].
3.2 Implementation of ABC algorithm for power service restoration
The implementation of the proposed algorithm to the power service restoration problem is discussed here. The network under consideration is divided into combinations of connected system components. Each combination is separated from others by either isolated faulty section or tie switches. For the modified IEEE 33 bus network under consideration, there are five combinations of the components as shown below.
8 9 10 11 21 33 35 3 4 5 6 7 18 19 20 12 13 14 34
15 16 17 29 30 31 36 32 22 23 24 25 26 27 28 37
The tie switches linking out-of-service components to the other components are the candidate switches for restoration. The restoration process starts with isolation of the faulty section (section 11 in this case) and the restoration plan follows the steps explained below:
Step 1: Initialization stage
The algorithm reads the line data, bus data, base apparent power, combinations of connected components or buses, the fault section(s) location(s) and the ABC control parameters. The initial closed and open network switches before contingency and subsequent reconfiguration for service restoration presents the initial solution vector and fitness value (power loss). After the contingency the determination of the best switching sequence starts with selection of random combination of tie switches from the set of original tie switches. The random populations of tie switches in this process is represented by the food sources position resulting in a possible solution to the optimized restoration problem. For the initial populations to be taken into account they must satisfy the five constraints.
Step 2: Fitness Calculation
In power service restoration process, the system power loss after each configuration is taken as the fitness value. The fitness value of each proposed configuration reflects its quality and requires optimization. The power loss values are obtained by carrying out the Newton Raphson method load flow for each proposed configuration. The formula for calculating the fitness value of a configuration is formulated from the ABC fitness expression (11) and it is given by (12) below:
{
} (11)
(12)
Where,
xnis the proposed solution/configuration)
fn(xn)denotes objective function value of xn.
Ploss(i)denotes real power losses at bus i.
The food source position or network configuration giving higher fitness value is considered to be the best food. This corresponds to the best combination of tie switches that gives minimum power loss.
Step 3: Employed Bee Phase
A new population of neighboring food sources (vn) is generated using (13) below.
(13)
Where,
vnj, xnj and xkj are the new, current, and random solutions Φnj is a random number [-1, +1] which controls the generation of the neighborhood food sources
k= (1, 2, ..., n) and j= (1,2,…,D) are selected randomly The employed bees search randomly for the new neighboring food sources’ locations of their selected food source positions in each iteration. The Newton-Raphson load flow analysis based on the position of employed bees is carried out. The fitness values for the newly generated neighboring solutions are calculated and checked if they are within boundaries. Then, the shifted positions of food sources will be evaluated to determine their fitness values.
Step 4: Greedy Selection Phase
The greedy selection is applied between the fitness value of the new neighboring food source position and that of the initial food source. If the former produces a better value than the latter, the employed bee shifts to it and forgets the former position. Otherwise, the old position is maintained in the memory and the new one is abandoned.
Step 5: Onlooker Bee Phase
The probability corresponding to each food source is evaluated by (14).
(14)
Where,
fitidenotes solution's fitness value i and ne denotes number of food sources.
The onlooker bees will then evaluate the amount nectar of each food source position. Based on food source probability, the onlooker bees will select the best food sources among all.
Step 6: The Scout Phase
As the employed and onlooker bees go on with exploitation of the food sources, some of the food sources get depleted. The depleted food source gets abandoned by the bee attached to it and it is eliminated from the population. The employed bee that was attached to it becomes a scout that randomly searches for new food source position to replace the abandoned food source. Then, load flow analysis is run and the fitness function value for the new food source calculated. The best food source position and corresponding fitness values are then updated. If the maximum number of iterations is not reached, the iteration counter is increased and then the algorithm returns to Step 3.
1953 TABLE 1 ABC PARAMETERS
Table 2 presents the relationship of the real power system and ABC algorithm.
TABLE 2 RELATIONSHIP OF ABC ALGORITHM AND THE REAL POWER SYSTEM
TESTS AND RESULTS ANALYSIS
4
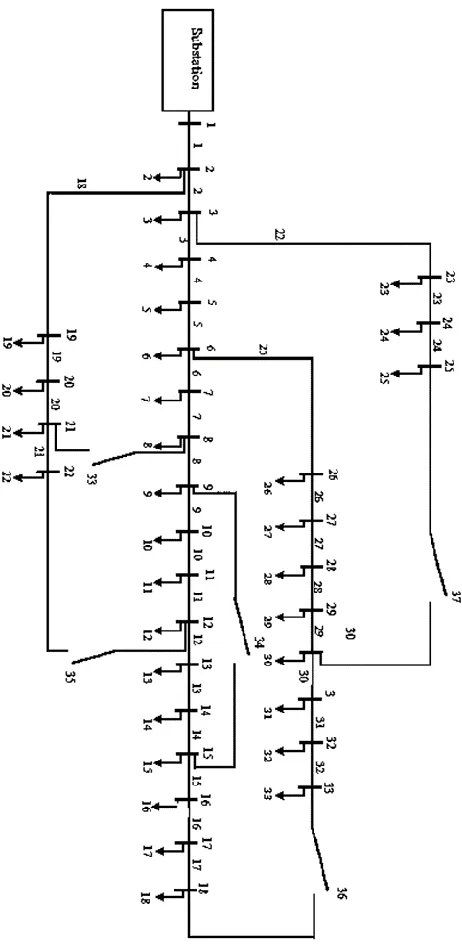
In order to evaluate the performance of the proposed method, it was tested on IEEE 33-bus radial distribution system (RDS)) shown in Figure 1. For the modified system of the above, three distributed generations (DGs) were incorporated at bus 16, 22 and 30. The substation voltage for the system was considered as 1.0 p.u. and all the tie and sectionalizing switches were considered as candidate switches for reconfiguration in order to solve the restoration problem. The proposed restoration method was programmed and simulated in MATLAB environment (R2017a software) and run on an Intel core i3, 2.4 GHz personal computer with 4 GB RAM.
Fig. 1. IEEE 33 bus radial distribution network
The system comprises of 33 buses, 32 line sections (sectionalizing switches) which are normally closed and 5 tie switches which are normally open. The base values for voltage and power are 12.66 kV and 100 MVA respectively. Its total normal configuration demand is 3.715MW and 2.3MVar. Bus 1 is the substation generating the total power demand in the system.
1954 IJSTR©2019
losses and voltage profile results of the modified network configuration after a contingency is introduced at branch 11. The last scenario evaluated total power losses and voltage profile results of the modified network configuration after the restoration process. The proposed algorithm’s results were compared with those of existing methods in [5] and [6] to validate its performance.
4.1 Case 1: Single fault consideration
The load flow analysis results for the five scenarios under consideration with a single fault at branch 11(as considered in [5]) are as shown in Table 3.
TABLE 3 LOAD FLOW ANALYSIS RESULTS FOR DIFFERENT SCENARIOS ON THE TEST SYSTEM (SINGLE FAULT CASE)
The base case network load flow analysis simulation (scenario 1) was used as a reference to show how the other scenarios had improved from it. The total power loss was 208.4592 kW with a minimum voltage of 0.91 p.u at bus 18. When a fault was introduced at branch 11 and the algorithm applied to restore the out-of-service loads, the power loss was reduced to 141 kW from 208 kW. Also the minimum voltage improved from 0.91 p.u to 0.94 p.u. There was a significant power loss reduction of 37% and improvement of minimum voltage to 0.94 at bus 32 in the third scenario when DGs were incorporated in the system compared to the base case network in scenario 1. When a fault was introduced to the modified system at branch 11, the load flow analysis results show a reduction in power losses but the configuration is not optimal because the loads downstream were disconnected. DG 2 could not serve any of the unserved loads because it cannot operate under island mode. As a consequence loads on bus 12 through 18 were unserved and the voltage and power supplied for the unserved buses was 0, calling for the need to carry out power service restoration for the unserved loads. In scenario 5 the modified network was reconfigured to restore the unserved loads while taking into account the research objective of serving as many unserved loads as possible with minimum power losses and satisfying the network constraints. The load flow analysis on the final restored network resulted in a further power loss reduction of 58% bringing down the power losses to 88 kW and minimum voltage improvement to 0.96
p.u at bus 32. The tie switches for the final restored network were 7 11 14 32 and 37.
4.2 Case 2: Multi fault consideration
To test the proposed algorithm’s performance with multi faults, faults affecting branch 5 and branch 35 (as proposed in [6]) were considered. The load flow results for the restored network are as shown in Table 4.
TABLE 4 LOAD FLOW ANALYSIS RESULTS FOR DIFFERENT SCENARIOS ON THE TEST SYSTEM (MULTI FAULT CASE)
The load flow analysis results for scenario 1, scenario 3 and scenario 4 are similar to those of case 1 and they serve as references for comparison of the restoration work carried out by the proposed algorithm under multi faults. In scenario 2 and scenario 5 the load analysis results for the restored networks for base case network and the modified network are presented respectively. In both scenarios there is significant reduction in power losses and improvement in the voltage profiles. However, the improvement in the power losses and voltage profile is lower compared to the first case and this is due to the fact that multi failures in the network present a constraint in the possible reconfiguration options.
The voltage profile for the two cases for both the base case and modified networks are presented in Figure 2 and 3 respectively.
1955 Fig. 3.Voltage profile for the modified network under single fault and multi
fault scenarios
4.3 Comparison of the proposed ABC-based method and other methods
For the validation of the and effectiveness of the proposed power service restoration method on the test system, the results were validated using results from other methods based on power loss minimization, amount of loads restored, minimum voltage and voltage profile improvement.
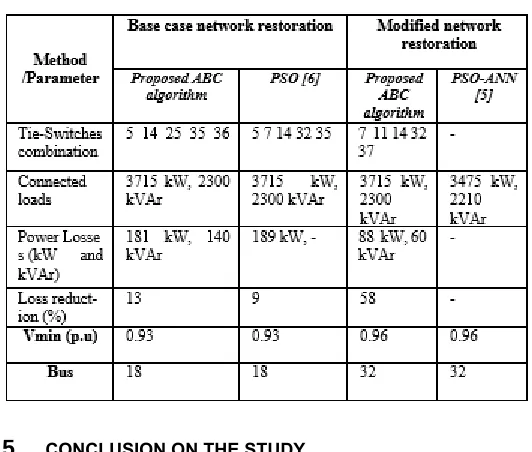
The solution of the proposed ABC-based algorithm when used to restore a multi faulted base case network differed from the solution of [6] according to Table 5. In both methods the minimum voltage of 0.93 p.u was recorded with all the loads connected. However, the proposed method leads to a more efficient solution, with less power loss. There was a difference of 8 kW power loss in favour of the proposed method.
The ABC restoration approach for a single faulted modified IEEE 33 bus system restored all the loads while meeting the constraints observed. The minimum voltage was the same for both the proposed approach and that of [5]. However, the proposed approach was more optimal in terms of the amount of loads restored. In all the methods there was improvement in the voltage profiles and power loss reduction compared to the initial networks. This ascertains the importance of power service restoration.
TABLE 5 COMPARISON OF RESULTS
CONCLUSION ON THE STUDY
5
In this paper, a metaheuristic ABC-based service restoration method was used to identify an optimum reconfiguration in a faulted radial distribution system that ensured restoration of maximum amount of loads while ensuring power loss minimization and voltage profile improvement. The algorithm was also able to maintain the operating constraints of the network. The algorithm features artificial exploitation and exploration of the possible solutions in the search space which allowed us to obtain an optimum solution within a short time. Two cases of faults on the network were used to assess the efficiency of the proposed restorative method. Results obtained were validated using results from other methods from the literature. The numerical analysis of the results obtained demonstrate that our technique is superior over the other methods reported in the literature both in terms of the quality of solutions attained, simplicity in coding, robustness and fewer control parameters. Also, the obtained results show that the integration of DGs to the network had a significant reduction on power losses and improvement of the voltage profile. Further, during the service restoration process for the networks incorporating DGs it was possible to meet the minimum voltage constraint without calling for load shedding. In conclusion, the application of the proposed algorithm to solve power service restoration problem was a success and it proved to be superior over the other algorithms in the literature.
A
CKNOWLEDGMENTThe authors would like to acknowledge the African Union Commission, The Pan African University and The Japan International cooperation Agency (JICA) for financially supporting this work.
1956 IJSTR©2019
R
EFERENCES6
[1] G. Niu, L. Zhou, and Z. Qi, “A Novel Fault Self-Recovery Strategy for Distribution Network with Distributed Generation,” in 2016 China International Conference on Electricity Distribution (CICED), pp. 1–6, Aug. 2016. [2] L. Liu, X. Chen, and D. Zhai, “Status and prospect of
service restoration in smart distribution network,” Power Syst. Prot. Control. CNKI, vol. 39, no. 13, pp. 148–154, Jul. 2011.
[3] D. Najihah, A. Talib, and H. Mokhlis, “Power System
Restoration Planning Strategy Based on Optimal
Energizing Time of Sectionalizing Islands,” Energies, MDPI, vol. 11, no. 1316, pp. 1–17, May. 2018.
[4] K. S. Kumar and T. Jayabarathi, “Optimal Power System Restoration and Reconfiguration in Distribution Circuit Using BFAM and BPSO,” J. Electromagn. Anal. Appl., vol. 01, no. 03, pp. 163–169, Sep. 2009.
[5] D. M. Soomro, H. A. Soodi, N. M. Elasager, and S. C. Chong, “Optimal Restoration of Distribution System by Using PSO and ANN,” J. Telecommun. Electron. Comput. Eng., vol. 9, no. 3–7, pp. 1–6, Aug. 2018.
[6] L. W. Oliveira, E. J. Oliveira, I. C. S. Jr, F. V Gomes, T. T. Borges, and A. L. M. Marcato, “Optimal Restoration of Power Distribution System Through Particle Swarm
Optimization,” in Power Tech Conference,IEEE
Eindhoven, Jun. 2015.
[7] Y. Tian, J. Xin, Z. Du, T. Lin, and J. Cao, “On the strategy of distribution system service restoration considering distributed generation,” CICED 2010 Proc., vol. 3, no. 2, pp. 1–5, Sep. 2010.
[8] I. Watanabe, A. Takehara, Y. Nakachi, and S. C. Verma, “Fast optimization method for service restoration in sub-transmission systems with priority loads,” Transm. Distrib. Conf. Expo. Asia Pacific, T D Asia 2009, pp. 1–4, Dec. 2009.
[9] E. Moazami, M. Z. A. A. Kadir, H. Hizam, M. Izadi, and M. Mirzaei, “Optimal Penalty Method in Distribution Service Restoration using Genetic Algorithm,” in 2013
IEEE 7th International Power Engineering and
Optimization Conference (PEOCO), pp. 397–401, Jun. 2013.
[10]H. Xiaoyu, X. Mingchao, and H. Yinghui, “A service restoration method for active distribution Network,” Energy Procedia, vol. 61, pp. 339–344, 2014.
[11]X. Huang, Y. Yang, and G. Taylor, “Service Restoration of Distribution Systems Under Distributed Generation Scenarios,” J. Power Energy Syst., vol. 2, no. 3, pp. 43–50, Sep. 2016.
[12]X. Guofu, C. Wei, K. Qibao, and S. Yaru, “Distributed Power Service Restoration Method for Smart Distribution Grid,” in 2016 IEEE PES Asia-Pacific Power and Energy Engineering Conference, no. 5, pp. 820–824 Apr. 2016. [13]C. Geraldo, N. Ferreira, and P. Benvindo, “Smart Service
Restoration of Electric Power Systems,” in Power and Energy Society, IEEE General meeting, pp. 1–5, Nov. 2016.
[14]H. Xiaoyu, X. Mingchao, and H. Yinghui, “A service restoration method for active distribution Network,” Energy Procedia, vol. 61, pp. 339–344, 2014.
[15]J. A. Shaibu, “Optimal radial distribution network reconfiguration using modified shark smell optimization,” Pan African University Institute for Basic Sciences Technology and Innovation, 2018.
[16]D. Karaboga, “An Idea Based on Honey Bee Swarm for Numerical Optimization,” Technical Report TR-06, Erciyes University, Jan. 2005.
[17]A. E. Hassanien and E. Emary, Swarm Intelligence; Principles, Advances and Applications. Boca Raton: CRC Press, 2016.