R E S E A R C H
Open Access
Optimal structure of groups under
exposure to fake news
Evelin Berekméri
1, Imre Derényi
1,2and Anna Zafeiris
1,2**Correspondence: [email protected]
1Department of Biological Physics, Eötvös University, Pázmány P. stny 1/A, 1117 Budapest, Hungary 2MTA-ELTE Statistical and Biological Physics Research Group, Pázmány Péter stny. 1/A, 1117 Budapest, Hungary
Abstract
Humans predominantly form their beliefs based on communication with other humans rather than direct observations, even on matters of facts, such as the shape of the globe or the effects of child vaccinations. Despite the fact that this is a well-known (not to say: trivial) observation, literature on opinion dynamics and opinion formation largely overlooks this circumstance. In the present paper we study the effects of limited access to information on the level of knowledge of members of groups embedded into an environment that can be observed. We also study the consequences of false information circulating within the group. We find that exposure to fake news makes intense communication counterproductive, but, at the same time, calls forth diversification of agents with respect to their information spreading abilities.
Keywords: Communication network, Optimal group structure, Limited access to information, Fake news, Disinformation, Diversity
Introduction
Humans believe in great many things. We have beliefs regarding history, art, proper and improper behaviour, law-systems, companies, climate change, child vaccination, etc. Many of these things are “social constructions” in the sense that they do not correspond directly to some kind of external reality, rather to some kind of shared abstract idea (for example ‘proper behaviour’ or ‘law-system’, from the above list) (Searle 2011). On the other hand, many of our ideas do refer to some kind of external reality (like climate change, the usefulness or harmfulness of child vaccination or the shape of the globe), which concepts are in intricate relations with the former ones (Berger and Luckmann
1991; Hacking2000). What is common in all beliefs is that humans form them mostly based on communication with fellow humans rather than direct observations (Sloman and Fernbach2017). This is a fundamental feature of all social constructions, but it firmly holds for scientific ideas as well: most of us have never measured or looked up statistical data regarding the effects of homeopathic medicament or the speed with which the polar ice layer attenuates, yet most of us have a clean-cut opinion in these matters.
The above examples refer to complex scientific problems in which the ratio of the data to which an average individual has access to is extremely small: observation data related to the climate change for example is far more abundant than being accessible for one person. Moreover, with the development of information technology, people are exposed to an ever increasing amount of data. By now, for an ordinary person under ordinary
conditions, it is basically impossible to check the source and dependability of every piece of the received information, partly due to inefficient access to the source of information, partly simply due to lack of time – not to mention other, psychological and social factors (O’Connor and Weatherall2018; Scheufele and Krause2019). On the other hand, not all factual questions are this complex, as many of them can be decided based on only a few aspects – these cause debate more rarely.
In the present paper we focus on the effect of limited information access, in groups aiming to achieve a clear idea regarding an “external reality” which can be observed. We study the optimal structure of such groups – described by the communication net-work and the observation/communication activities – under various exposure levels to fake news. This model refers more to scientific fake news rather than political ones since in the present model we assume that there exists an observable external real-ity. Agents placed into a randomly generated, but observable environment can modify their beliefs either by direct observation (which is a costly activity) or via communicat-ing with their fellow group members (which is a much less costly action). Agents are exposed to fake news during the entire run. The features of the most effective groups are then determined by optimizing the communication network and the activity levels (both communication and observation) for each agent, with a genetic algorithm. The fit-ness function is defined by the accuracy of the group after the run, minus the costs of the activities.
Although in the literature false information, fake news, misinformation and disinfor-mation mean different things (disinfordisinfor-mation contains intentionally distorted data while in case of misinformation the distortion can be unintended), in the present article we use them as synonyms, since from the point of view of our model, the reason why the infor-mation is false does not matter. We adjust the inforinfor-mation-accessing abilities of the agents by a parameter calledHwhich refers to the portion of the environment an agent is able to observe (see also Fig.1). Accordingly, it can be interpreted in two ways: the ability of the agents, assuming an environment with fixed complexity, or alternatively, the complex-ity of the environment, assuming that humans have (by and large) similar abilities (for example a simple “environment” can be comprehended by each agent individually, while if they are embedded into a more complex environment, then only a portion of it will be accessible).
Despite the fact that the limited nature of information access is a fundamental property of opinion dynamics and opinion formation, it has not gained attention up to now. In contrast, phenomena related to fake news have gained more and more attention recently. Fake news exists since humans do, but its spread has always been subject to the current technologies of information transfer. In recent times, along with the development of com-munication technology, newer and newer channels of information distribution appeared which in the meantime led to initiations aiming to preserve the solidity and verity of news – such as the fairness doctrine introduced in the US in the middle of the 20th
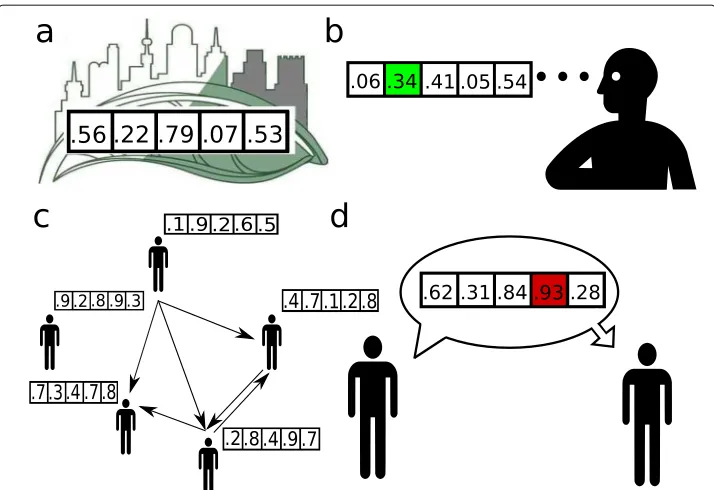
Fig. 1The basic properties of the modelaAn “external reality” (or “environment”), which can be observed by the agents, is given. This environment is represented by K randomly generated numbers taken from the [0,1] interval with uniform distribution. In the example of this figure K = 5.bEach agent-member of the group-maintains a K-long “belief vector” reflecting their information about the “external reality”. Agents are able to observe only a fraction H of the environment (marked green). In this example H = 0.2, that is, the given agent is able to observe 1 element of the environment vector.canddAgents can also communicate, during which a “source” individual shares the data of a randomly selected element of their belief vector (marked red) with the “target” individual. As a results, the corresponding element of the target individual’s belief vector gets closer to that of the agent sending the data. That is, their corresponding beliefs get closer to each other. This type of communication defines a one-directional information transfer
The spread of unreliable information can be traced back to various reasons: apart from the fact that people in general enjoy gossip (which often precedes news diffusion) (Szekf˝u and Szvetelszky2005) they are not particularly keen on creditable information either due to psychological factors such as theconfirmation bias(the preference to keep contact with people maintaining similar views, leading to the reinforcement of the original beliefs) or thedesirability bias(the tendency to accept pleasing information) (Garrett and Weeks
2017; Lewandowsky et al. 2012; van Prooijen2016) – just to mention two out of the many factors. Thus, decreasing the vulnerability of individuals to fake news, especially on social media is a major challenge, aggravated by other non-psychological factors such as the appearance of social bots or trolls who often speed up the process of spreading false information to the same order of magnitude as the propagation of reliable information (Vosoughi et al.2018; Shao et al.2018; Mitchell Waldrop2017; Pennycook and Rand2019; Bovet and Makse2019; Varol et al.2017).
2013), through elaborate models (Smets and Kennes1994; Smets1994; Rojas-Guzmán and Kramer2013), up to complex methods developed in the field of artificial intelligence (Bengio et al.2013). For example, in Ref. (Chung and Reynolds1996) the authors propose a dual inheritance evolutionary algorithm, called cultural algorithm, in which individuals maintain a shared belief system. Agent-based models tend to put an emphasis not only on the inner structure and/or behaviour of the units, but also on their interactions (Hare and Deadman2004; Epstein and Axtell1996; Bousquet and Le Page2004). The models also widely differ in the goals of the agents (Vedres and Scotti2012), such as reaching consen-sus (Olfati-Saber and Murray2004) or learning to forecast in an economic environment (Bullard and Duffy1999).
The model
Here we introduce an agent-based model in which agents are embedded into an envi-ronment that can be observed, the observation abilities of the agents are limited, and individuals can choose to modify their beliefs either by observation or communication. The “external reality” is represented by a vector ofKrandomly selected (with a uniform distribution), independent real numbers taking values from the [ 0, 1] interval, represent-ingKindependent pieces of information. We call this vector theenvironment. A group consists of N agents, each of which maintains an image (or idea) regarding the envi-ronment. These are thebelief vectors, which, along with the environment vector, are set randomly at the beginning of each run. Accordingly, the beliefs of a group at any moment can be described byNreal vectors, all of lengthK.
Each agent is able to “see” only a portion of the entire environment, which portion is defined by the parameterH(H ∈[ 0, 1]). In the present paper we focus on two cases: (i)
whenH=0.1, that is, when each agent has access only to 10% of the environment vector, and (ii)H=1, that is, when the agents can see the entire environment vector without any restrictions (see Fig.1). In caseH < 1, the specific elements of the environment vector that are observable for the various agents are set randomly at the beginning of each run.
During a run, agents modify their belief vectors due to two activities: communication and/or observation.Communicationis a one-directional information flow, during which the source agentishares a piece of information with the target agentj, who modifies their belief vector in a way that it becomes more similar to that of agenti’s. For example if agent
ishares the 5thelement of their belief vector (corresponding to the 5th element of the environment vector) with individualjthen the fifth element of the belief vector of agentj
will get closer to that of agenti’s with a random portion. That is, only the source individ-ual influences the beliefs of the target agent.In case agent i chooses to communicate, the probability of communication with agentjis defined by the elementaijof the adjacency matrix. However, agenticommunicates only with probabilityAiComm(≤1). Accordingly, the “true” probability of communication between agentsi→jiswij = aijAiComm. In the following, when we refer to the communication network, we consider this latter network, containing thewijvalues for all thei→jagent pairs. Whether the communication makes agentjbetter-informed or not, depends on the accuracy of the beliefs of the source agent
i.
and (ii) observation is much more costly than communication. Specifically, we assume that both activities have a cost, and that the cost of observationCobsis much higher than the cost of communicationCcomm. (Looking up the measurement data related to climate change takes much more time and energy than talking about this subject with others.)
Eachrunconsists of severalroundsduring which each agenti communicates and/or performs observations with probabilitiesAiCommandAiObs, respectively.
“Fake news” is represented by a vector whoseith element,fiis 1−ei, whereeiis theith element of the environment vector. For example, if the sixth element of the environment vector is e6 = 0.37, then the sixth element of the fake news vector will bef6 = 1− 0.37=0.63. Considering values near 0.5 as "neutral statements" and values near 0 and 1 "extreme", this definition can be interpreted as negating the original viewpoints/pieces of information. We study three levels of exposure to fake news,RFN=0%, 1% and 5%.
Exposure to fake news is incorporated into the model as next: at the beginning of each
round, a certain(RFN) percentage of the elements of the belief vectors maintained by the group members are set to the value of the corresponding element of the fake news vector. The elements to be modified are chosen randomly.
Our question is the following: What is the optimal group structure (described by the communication network and the activities of the agents, both observation and commu-nication) under the exposure to various levels of fake news, if by “optimal” we mean that the beliefs of the group members reflect the “reality” (represented by the environment vector)? In other words, a group is optimal, if its members can reach an accurate idea regarding their environment, despite the exposure to fake news or disinformation. We optimize the group and not the individuals, so our results reflect the interest of a group in case it aims to keep its members well-informed in the presence of disinformation.
The optimization is carried out by genetic algorithm in which the fitness function is defined as:
F=αGrp−CActv (1)
whereαGrpis the accuracy of the group (see Eq.2), andCActvis the sum of the activity costs (Eq.3). Since in case of uniformly distributed random values for both the initial belief vectors and the environment vector, the expected value of the initial error of the groupEGrpAvgInit (defined as the mean square deviation from the environment vector) is 1/6, the first term of the fitness function,αGrpis:
αGrp=
EGrpAvgInit −EFinalGrpAvg
EInitGrpAvg =
1
6−EFinalGrpAvg 1 6
=1−6EFinalGrpAvg (2)
That is, the accuracy of the group is defined as the ratio of the original expected error that has been worked off during the run. (We have also run optimizations in which the initial error of the group was specified as the belief vectors’empiricalmean square devi-ation from the environment vector, instead of the above definedexpectedmean square deviation. According to our results, these two approaches produce very similar outcome.) Regarding the second term of the fitness function, the activity costs, it is the average observation activity< AObs >multiplied by the observation costCobsplus the average communication activity<AComm>multiplied by the communication costCcomm:
Parameter settings
In the present study we focus on small groups, counting a few dozen members, in which face-to-face communication is possible. Specifically, the parameters for the results delin-eated in the present paper are the following:N=30, whereNis the size of the group, and
K = 20, whereKis the length of the environment and fake news vectors. These param-eters mainly typify families and friendship groups. Due to limitations on computational capacity, in the present paper we do not study the optimal structure of larger groups. Smaller groups have been studied (N=10 andK=10) providing similar results.
Regarding thecostparameters, we have sought to satisfy the following two conditions: (i) our original assumption (namely that the cost of observationCObs is considerably higher than the cost of communicationCComm), and (ii) staying within the boundaries of the [ 0, 1] interval, from which all elements constituting the fitness function take val-ues. The concrete results delineated in the present paper belong to the parameter pair
CComm =0.1 andCObs = 0.5, but the conclusions hold for more extreme parameters as well satisfying our requirements (see Fig.6b.)
The number of rounds in each run, that is, the number of rounds during which agents can communicate and/or observe their environment, is 50. The exact value of this param-eter does not matter as long as it is (i) large enough for the group error to get significantly closer to its asymptotic value, but, at the same time (ii) small enough to give room for improvement originating from better group structures. Furthermore, a technical consid-eration is that it should not slow down the simulations unnecessarily. Once it is set, the same value is used throughout the optimization.
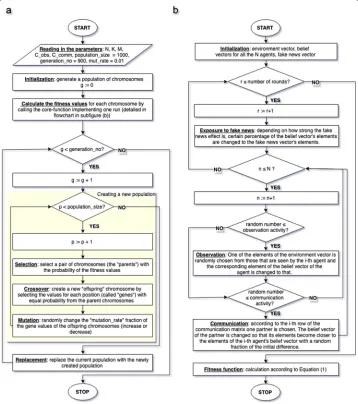
The detailed flowcharts of the model along with the genetic algorithm that we used for optimization are depicted in Fig.5in the “Methods” section.
Results
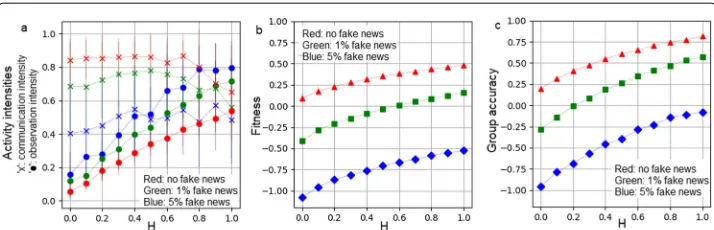
The first and most upfront observation is that exposure to fake news severely deteriorates the performance of the group. The decay is proportional to the amount of false informa-tion circulating within the group, and it holds for all values ofH (see Fig.2). However, better observation abilities (corresponding to higher values ofH), independently of the fake news ratio calls forth higher observation activities (Fig.2a) resulting in better group performances, reflected by both the fitness values (Fig.2b) and the group accuracy val-ues (Fig.2c). It is also clear from subfigures (b) and (c) that even high observation abilities can not compensate the exposure to false information, reflected by the constant distances among the curves.
Furthermore, according to Fig.2a, there is a clear inverse relation between the fake news ratio and the optimal amount ofcommunicationwithin the group: the more a group is exposed to false information the less communication is desirable among the members, reflected by the curves marked with blue and green ’x’ symbols, corresponding to 5% and 1% constant exposure rate, respectively.
Fig. 2aThe optimal amount of activities: observation (marked with filled ’o’ symbols) and communication (marked with ’x’ symbols),bthe fitness values, andcthe group accuracy values, as a function ofH, for three fake news ratios: 0% (marked with red), 1% (marked with green) and 5%(marked with blue).aThe observation activity monotonically increases as a function ofH, meaning that members of an optimal group observe proportionally to their abilities. At the same time, at higherHvalues, the communication activities decrease, at least in case of small fake news ratio. Under exposure to fake news, there is a clear inverse relation between the fake news ratio and the optimal amount of communication.bandcAsHincreases, the performance of the group also increases, but exposure to fake news deteriorates group-performance severely, for allHvalues
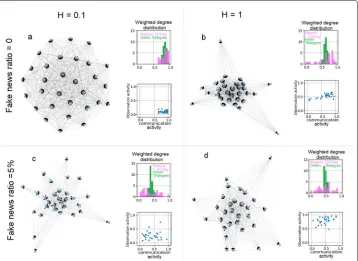
out-going from the given node). When inspecting these properties, the first striking fea-ture is that the weightedin-degree values are very similar for all nodes, independently of the values ofHor the level of false information circulating among the members (see the green bars in the insets entitled “Weighted degree distribution” in Figs.3 and4a). This means that all agents receive similar amount of data from their peers within an optimal group. However, the exact amount of the received data (referred to from the weighted in-degree values) does depend on the level of exposure (and also onH): along with the increment of the fake news ratio, the green bars shift towards the left, that is, towards smaller values in the insets entitled “Weighted degree distribution”, and in Fig.4a the box-plots representing higher exposure to false information (outlined with blue color) are located on significantly lower positions than the ones belonging to zero exposure ratio (outlined with red color). In other words, the amount of data flowing among members in an optimal group is inversely related to the group’s exposure to fake news. (Note that this feature is in agreement with the decreased communication activities, shown in Fig.2a).
In contrast, the out-degrees – reflecting the participation inspreadingthe information – behave very different: in caseH =0.1, that is, when each agents have access only to a small portion of the environment (10%, in this case) and there are no false information circulating, the best strategy to stay well-informed is to maintain a basically full graph in which everybody is connected to everybody else in both directions (receiving and sending data). This property is reflected by the uniformly high in-degree and out-degree values in the histogram entitled “Weighted degree distribution” in Fig.3a. However, as the ratio of the fake news increases (bottom row), the out-degree values start to disperse, marking a differentiation of the members regarding their activity inspreading the information. Specifically, a significant portion of the members cease to participate in circulating data, and remain connected to the group only via their in-coming edges (peripheral nodes on the graphs in Fig.3c and d) while others remain active.
Fig. 3Features of the optimal communication networks for differentHandRFNvalues. The three pictures in all the four subfigures are the following: (i) the graphic representation of the optimal communication network, (ii) the weighted in and out degree distribution of the optimal communication network, and (iii), the observation activity values as a function of the communication activity values. In order to retrieve a more intuitive representation of the optimal communication network, we have omitted the edges with very small weights (the ones smaller than0.3N =0.01). As it can be seen in the insets entitled “Weighted degree distribution”, the weightedin-degree values are very similar for all nodes, independently ofHor the fake news ratio (green bars). However, exposure to fake news (bottom row, subfigurescandd) results in smaller weighed in-degree values (the green bars are shifted towards smaller values). Furthermore, exposure to false information or high values ofH(subfiguresbandd) calls forth “blurred”out-degree distribution (magenta color), marking the differentiation of agents regarding their role in spreading the information, which phenomenon can not be observed in subfigurea. Agents with zero or close-to-zero communication activity values are the peripheral nodes on the graphs who are connected to the rest of the group only via in-coming edges
members, agents specialize with regard to their information spreading activity in case all agentshave fullaccess to the entire environment (H = 1), and maintain a full net-work in which everybody is connected equally to everybody else in case the access to information is limited (H = 0.1) (see the top row of Fig. 3). Although diversity has been reported to be advantageous from many points of views (Page2010), the above phenomenon is still remarkable, since here we have a case in which originally similar agents specialize themselves with respect to their function within the group, under certain conditions.
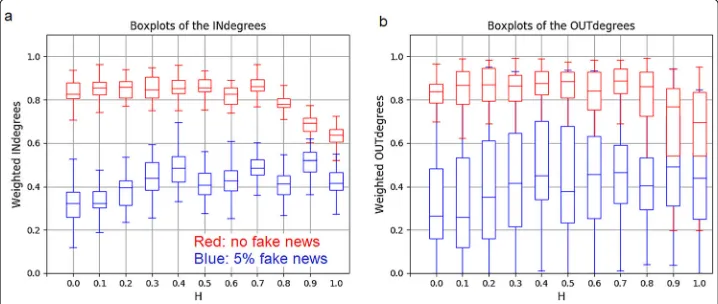
Fig. 4Box-plots of theain-degrees andbout-degrees of the nodes of the optimized communication networks as a function ofH, for 5% and 0% fake news ratios. In both subfigures blue represents 5% fake news ratio, and red denotes the case when there are no fake news. The weighted in-degree values of the agents are much more homogeneous than their weighted out-degree values independently ofHorRFN. As a general rule, exposure to fake news calls forth smaller in-degree and out-degree values, in agreement with the decreased communication activity. Exposure to fake news also disperses the out-degree values, marking the diversification of agents regarding their information-spreading abilities
The scope of the model and main results
In the present study we assume (i) small groups counting a few dozen members in which face-to-face communication is possible, (ii) that communication is information flow during which an agent modifies the beliefs of an other agent, (iii) equal informa-tion accessing abilities, (iv) the existence of an “external reality” that can be observed, and (v) in some cases, the presence of fake news, meanwhile we omit psychological fac-tors such as confirmation bias or desirability bias. In real life, these assumptions hold for small communities, such as families or smaller circles of friends aiming to be well-informed regarding some observable data within their environment. We show that in case of exposure to fake news, specialization with respect to information spreading activity among the members is beneficial, along with intensified observation and weakened com-munication activity. Furthermore, observation activity – independently of the level of fake news – should increase as a function ofH, that is, better access to information in general should give rise tomoreobservation. Regarding the communication activity, higher expo-sure to fake news makes intense communication counterproductive, even in the extreme case when CComm = 0, that is, when there is no cost associated with communication (see Fig.6b).
Methods
Fig. 5The flowchart of theagenetic algorithm andbthe routine assigning a fitness value for each chromosome.aGenetic algorithms – a popular and widely applied optimization approach – are designed to optimise a population of chromosomes with respect to a pre-defined fitness function.bA crucial part of all genetic algorithms is the way a fitness value is assigned to a chromosome: the input of this function is an instance of chromosome (AandBmatrices) and the output is the corresponding fitness value measuring the "quality" of the input. The first two decision boxes (diamond shapes) stand for two for-loops, while the second two decision boxes stand for two if-statements
• An adjacency matrixA:=(ai,j)NxNwhose values are taken from the [0,1] closed interval. In this matrix, element(ai,j)defines the probability of communication between agentsi→j, in case agenti chooses to communicate in a certain round. Accordingly – since these values define probabilities – the sum of each row is always normalized to 1, and the elements in the main diagonal are set to 0 (since agents do not communicate with themselves).
• A vectorAComm:=
AiCommN whosei th elementAiCommis the communication activity of agenti, and
• A vectorAObs:=
The elements of the vectorsACommandAObsare taken from the [0,1] closed interval
as well.
At the beginning of the optimization process, in the "Initialization step" (second box in Fig.5a) the values of the chromosome, that is, the elements of the matrixAand the vectorsACommandAObsare taken from the [ 0, 1] closed interval with uniform random distribution.
Throughout the optimization process these values become more and more "optimal" with respect to a so calledfitness function– this is what a genetic algorithm is designed for (Eiben and Smith2010). This fitness function returns a fitnessvaluefor each chromosome reflecting its quality, that is, it is a numeric measure designed to describe how well a certain chromosome solves the original problem. Figure5b shows the flowchart of the function we have used to assign a fitness value for each chromosome: its input is (i) a communication network and (ii) the activity values for all agents (both observation and communication), and its output is a fitness value. The exact formula of the fitness function is defined by Eq.1
Regarding theAi,jadjacency matrix, it is important to highlight that its elementaijrefers to the probability of communication between agentsi → j, in case agent i chooses to communicate in a certain round. However – as emphasized in “The model” section as well – agentidoes not necessary communicate in each round, but only in a portion of them, defined by theAiComm(≤1)communication activity. Hence, the real ("effectuating") probability of communication between membersi → jiswij = aijAiComm. The results reported in the manuscript refer to this latter "effective" communication network, defined by thewijvalues. Since there is a one-to-one mapping between graphs and matrices, the above adjacency matrix along with the communication activities unequivocally defines the communication network (Bollobás2002).
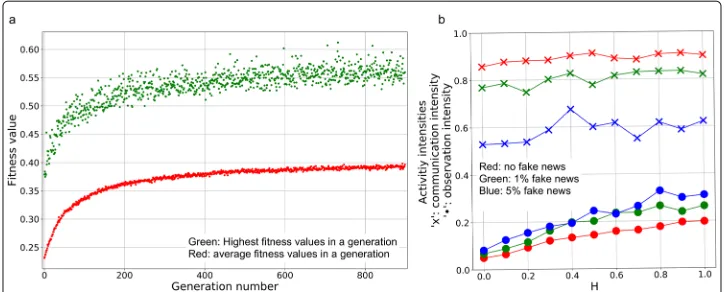
Fig. 6The progress of the optimization (a) and the optimal activity values for extreme cost values (b).aThe best (green dots) and the average (red dots) fitness values as a function of the generation number. Saturating fitness curve indicates that the chromosomes in the last generations are optimal solutions for the original problem.bOptimal activity values for as a function ofHforCComm=0 andCObs=1. According to our results, exposure to fake news calls forth intensified observation and weakened communication activity. Observation activities in optimized groups – independently of the level of fake news – increase as a function ofH. In contrast to the observation activities (marked by filled circles), higher exposure to fake news makes intense communication counterproductive, marked by the blue ’x’ marks which stay around 0.6, despite the fact that no cost is associated to it
the parameterspopulation_size=1000 andgeneration_no=900. The chromo-somes in the last generations converge, that is, they are very similar to each other. Due to this effect, it is reasonable to average them and definethesolution as the average of the population_size(=1000) chromosomes of the last generation. The reported results are obtained in this way.
Acknowledgements
Not applicable.
Authors’ contributions
AZ and ID designed the model and analyzed the results. AZ and EB made the code and run the optimization. AZ was a major contributor in writing the manuscript to which EB contributed with the literature overview in the Introduction. All authors read and approved the final manuscript.
Funding
The research was partially supported by the European Union through projects ’RED-Alert’ (grant no.: 740688-RED-Alert-H2020- SEC-2016-2017/H2020- SEC-2016-2017-1) and by the Hungarian National Research, Development and Innovation Office (grant no. K 128780). We acknowledge further partial support by the Bolyai János Research Scholarship, the Bolyai+ Research Scholarship (grant no. ÚNKP-18-4) founded by the New National Excellence Program of the Ministry of Human Capacities and the National Research, Development and Innovation Office.
Availability of data and materials
All data generated and analyzed during this study are included in this article. (See the “Parameter settings” subsection within the “The model” section, and the “Methods” section.)
Competing interests
The authors declare that they have no competing interests.
Received: 16 May 2019 Accepted: 22 October 2019
References
Alander JT (1992) On optimal population size of genetic algorithms. In: CompEuro 1992 Proceedings Computer Systems and Software Engineering. pp 65–70.https://doi.org/10.1109/CMPEUR.1992.218485
Albert R, Barabási A-L (2002) Statistical mechanics of complex networks. Rev Mod Phys 74:47–97.https://doi.org/10.1103/ RevModPhys.74.47
Bengio Y, Courville A, Vincent P (2013) Representation learning: A review and new perspectives. IEEE Trans Pattern Anal Mach Intell 35:1798–1828.https://doi.org/10.1109/TPAMI.2013.50
Bollobás B (2002) Modern Graph Theory. Springer, New York
Bousquet F, Le Page C (2004) Multi-agent simulations and ecosystem management: A review. Ecol Model 176:313–332. https://doi.org/10.1016/j.ecolmodel.2004.01.011
Bovet A, Makse AH (2019) Influence of fake news in twitter during the 2016 us presidential election. Nat Commun 10. https://doi.org/10.1038/s41467-018-07761-2
Bullard J, Duffy J (1999) Using genetic algorithms to model the evolution of heterogeneous beliefs. Comput Econ 13:41–60.https://doi.org/10.1023/A:1008610307810
Chung CC-J, Reynolds RG (1996) A testbed for solving optimization problems using cultural algorithms. Evol Program. Published in Evolutionary Programming 1996.http://citeseerx.ist.psu.edu/viewdoc/summary?doi=10.1.1.55.3116 Eiben AE, Smith JE (2010) Introduction to Evolutionary Computing. Springer, Heidelberg
Epstein J, Axtell R (1996) Growing Artificial Societies: Social Science from the Bottom Up, Vol. 76.https://doi.org/10.2307/ 20048043
Garrett RK, Weeks B (2017) Epistemic beliefs’ role in promoting misperceptions and conspiracist ideation. PLoS ONE 12:0184733.https://doi.org/10.1371/journal.pone.0184733
Gotshall SP, Rylander B (2002) Optimal population size and the genetic algorithm.https://www.semanticscholar.org/ paper/Optimal-Population-Size-and-the-Genetic-Algorithm-Gotshall-Rylander/
6eb8128b679348b5bef2729c56dd31f0f173a60b
Hacking I (2000) The Social Construction of What?. Harvard University Press, Cambridge
Hare M, Deadman P (2004) Further towards a taxonomy of agent-based simulation models in environmental management. Math Comput Simul 64:25–40.https://doi.org/10.1016/S0378-4754(03)00118-6
Iyengar S, Massey D (2018) Scientific communication in a post-truth society. Proc Natl Acad Sci 116:201805868.https:// doi.org/10.1073/pnas.1805868115
Lazer MJD, Baum M, Benkler Y, Berinsky JA, Greenhill MK, Menczer F, Metzger JM, Nyhan B, Pennycook G, Rothschild D, Schudson M, Sloman S, Sunstein C, Thorson AE, Watts JD, Zittrain LJ (2018) The science of fake news. Science 359:1094–1096.https://doi.org/10.1126/science.aao2998
Lewandowsky S, Ecker U, Seifert C, Schwarz N, Cook J (2012) Misinformation and its correction continued influence and successful debiasing. Psychol Sci Pub Interes 13:106–131.https://doi.org/10.1177/1529100612451018
Macal C, North M (2006) Tutorial on agent-based modeling and simulation part 2: How to model with agents. pp 73–83. https://doi.org/10.1109/WSC.2006.323040
Macal C, North M (2010) Tutorial on agent-based modelling and simulation. J Simul 4:151–162.https://doi.org/10.1057/ jos.2010.3
Mitchell Waldrop M (2017) News feature: The genuine problem of fake news. Proc Natl Acad Sci 114:201719005.https:// doi.org/10.1073/pnas.1719005114
Nepusz T, Vicsek T (2013) Hierarchical self-organization of non-cooperating individuals. PloS ONE 8:81449.https://doi.org/ 10.1371/journal.pone.0081449
O’Connor C, Weatherall JO (2018) The Misinformation Age: How False Beliefs Spread. Yale University Press, New Haven Olfati-Saber R, Murray R (2004) Consensus problems in networks of agents with switching topology and time-delays. IEEE
Trans Autom Control 49.https://doi.org/10.1109/tac.2004.834113 Page SE (2010) Diversity and Complexity. Princeton University Press, Princeton
Pennycook G, Rand D (2019) Fighting misinformation on social media using crowdsourced judgments of news source quality. Proc Natl Acad Sci 116:201806781.https://doi.org/10.1073/pnas.1806781116
Roeva O, Fidanova S, Paprzycki M (2013) Influence of the population size on the genetic algorithm performance in case of cultivation process modelling. In: Proceedings of the 2013 Federated Conference on Computer Science and Information Systems. pp 371–376.https://annals-csis.org/Volume_1/pliks/167.pdf
Rojas-Guzmán C, Kramer MA (2013) GALGO: A genetic algorithm decision support tool for complex uncertain systems modeled with bayesian belief networks. CoRR abs/1303.1498.1303.1498
Searle JR (2011) Making The Social World. Oxford University Press, New York
Scheufele DA, Krause NM (2019) Science audiences, misinformation, and fake news. Proc Natl Acad Sci
116(16):7662–7669.https://doi.org/10.1073/pnas.1805871115.https://www.pnas.org/content/116/16/7662.full.pdf Shao C, Luca Ciampaglia G, Varol O, Flammini A, Menczer F, Yang K-C (2018) The spread of low-credibility content by
social bots. Nat Commun 9.https://doi.org/10.1038/s41467-018-06930-7
Sloman S, Fernbach P (2017) The Knowledge Illusion: The Myth of Individual Thought and the Power of Collective Wisdom. Macmillan; Main Market edition, New York
Smets P (1994) The transferable belief model for quantified belief representation 1. https://doi.org/10.1007/978-94-017-1735-9
Smets P, Kennes R (1994) The transferable belief model. Artif Intell 66:191–234. https://doi.org/10.1016/0004-3702(94)90026-4
Szekf ˝u B, Szvetelszky Z (2005) Three degrees of inclusion: the gossip-effect in human networks. AIP Conf Proc.https://doi. org/10.1063/1.1985397
van Prooijen JW (2016) Why education predicts decreased belief in conspiracy theories: Education and conspiracy beliefs. Appl Cogn Psychol 31.https://doi.org/10.1002/acp.3301
Varol O, Ferrara E, Davis C, Menczer F, Flammini A (2017) Online human-bot interactions: Detection, estimation, and characterization. In: Proceedings of the Eleventh International AAAI Conference on Web and Social Media. pp 280–289 (2012) Networks in Social Policy Problems(Vedres B, Scotti M, eds.). Cambridge University Press, Cambridge UK Vosoughi S, Roy D, Aral S (2018) The spread of true and false news online. Science 359:1146–1151.https://doi.org/10.
1126/science.aap9559
Publisher’s Note