R E S E A R C H
Open Access
Degrees of tenant isolation for
cloud-hosted software services: a cross-case
analysis
Laud Charles Ochei
1*, Julian M. Bass
2and Andrei Petrovski
1Abstract
A challenge, when implementing multi-tenancy in a cloud-hosted software service, is how to ensure that the performance and resource consumption of one tenant does not adversely affect other tenants. Software designers and architects must achieve an optimal degree of tenant isolation for their chosen application requirements. The objective of this research is to reveal the trade-offs, commonalities, and differences to be considered when implementing the required degree of tenant isolation. This research uses a cross-case analysis of selected open source cloud-hosted software engineering tools to empirically evaluate varying degrees of isolation between tenants. Our research reveals five commonalities across the case studies: disk space reduction, use of locking, low cloud resource consumption, customization and use of plug-in architecture, and choice of multi-tenancy pattern. Two of these common factors compromise tenant isolation. The degree of isolation is reduced when there is no strategy to reduce disk space and customization and plug-in architecture is not adopted. In contrast, the degree of isolation improves when careful consideration is given to how to handle a high workload, locking of data and processes is used to prevent clashes between multiple tenants and selection of appropriate multi-tenancy pattern. The research also revealed five case study differences: size of generated data, cloud resource consumption, sensitivity to workload changes, the effect of the software process, client latency and bandwidth, and type of software process. The degree of isolation is impaired, in our results, by the large size of generated data, high resource consumption by certain software processes, high or fluctuating workload, low client latency, and bandwidth when transferring multiple files between repositories. Additionally, this research provides a novel explanatory framework for (i) mapping tenant isolation to different software development processes, cloud resources and layers of the cloud stack; and (ii) explaining the different trade-offs to consider affecting tenant isolation (i.e. resource sharing, the number of users/requests, customizability, the size of generated data, the scope of control of the cloud application stack and business constraints) when implementing multi-tenant cloud-hosted software services. This research suggests that software architects have to pay attention to the trade-offs, commonalities, and differences we identify to achieve their degree of tenant isolation requirements.
Keywords: Multitenancy, Degree of isolation, Cloud patterns, Global software development, Software development tools, Cloud-hosted software services, Application component, Case study research, Cross-case analysis
*Correspondence:[email protected]
1Robert Gordon University, School of Computing and Digital Media, Aberdeen AB10 7QB, UK
Full list of author information is available at the end of the article
Background
Cloud services are applications delivered over the Internet [1] that offer users on-demand access to shared resources such as infrastructures, hardware platforms, and software application functionality [2].
Cloud services provide a dedicated instance of applica-tions to multiple users using multitenancy. Multitenancy allows a single instance of a service to serve multiple users while retaining dedicated configuration informa-tion, application data and user management for each tenant [3].
A challenge when implementing multi-tenant ser-vices is to ensure that the performance demands and resource consumption of one tenant does not adversely affect another tenant; this is known as
tenant isolation. Specifically, software architects need to be able to control the required degree of isolation between tenants sharing components of a cloud-hosted application [4].
Varying degrees of tenant isolation is possible, depend-ing on the type of component bedepend-ing shared, the process supported by the component and the location of the com-ponent on the cloud application stack (i.e., application level, platform level, or infrastructure level) [3]. For exam-ple, the degree of isolation required for a component that cannot be shared due to strict laws and regulations would be much higher than that of a component that has to be reconfigured for some tenants with specific requirements.
We previously conducted separate case studies to empirically evaluate the degree of tenant isolation in three cloud-hosted software development process tools: con-tinuous integration (with Hudson), version control (with File SCM Plugin and Subversion), and bug/issue track-ing (with Bugzilla) [5–7]. The case studies allowed us to investigate instances (i.e., evaluating the degree of ten-ant isolation) of a contemporary software engineering phenomenon within its real-life context using real-world Global Software Development (GSD) tools deployed in a cloud environment [8]. To build an integrated body of knowledge from these individual case studies we decided to perform a case study synthesis. The case study synthe-sis allows us to extend the overall evidence base beyond the existing case studies. We can thus, make a new whole out of the parts, to provide new insights regarding degrees of tenant isolation.
As a consequence of these goals, we consider three research questions:
1. What are the commonalities and differences in the degrees of tenant isolation for our three case studies? 2. What are the deployment trade-offs for achieving the required degree of tenant isolation for our three case studies?
3. What are the key challenges and recommendations for implementing tenant isolation for our three case studies?
We conducted the case study synthesis by employing a cross-case analysis technique to identify commonalities and differences in tenant isolation characteristics across the previous case studies. The cross-case analysis allows us to triangulate evidence from each case study to build a more substantial body of knowledge on tenant isolation [8, 9]. The cross-case analysis study was carried out in three phases: data reduction, data display, and conclusion drawing and verification. These phases were conducted in an iterative manner during the analysis to reach the conclusion [9].
The main contribution of this article is to provide an explanatory framework and new insights for explaining the commonalities and differences in the design, imple-mentation and deployment of cloud-hosted services, and the trade-offs to consider when implementing tenant iso-lation [10]. The contributions of this article are sum-marised as follows:
1. Providing patterns of commonalities and differences across the existing cases studies:
(i) the study revealed five case study commonalities: disk space reduction, use of locking, low cloud resource con-sumption, customization and use of plugin architecture, and choice of multi-tenancy pattern. Two of these factors have a negative impact on tenant isolation. The degree of isolation is reduced when there no strategy to reduce disk space and customization and plugin architecture is not adopted. In contrast, the degree of isolation improves when careful consideration is given to handling a high workload, locking of data and processes is used to prevent clashes between multiple tenants, data transfer between repositories and selection of appropriate multi-tenancy pattern. (see “Results” section).
(ii) our research reveals five areas of case study differ-ences: size of generated data, cloud resource consump-tion, sensitivity to workload changes, the effect of the software process, client latency and bandwidth, and type of software process). The large size of generated data, high resource consumption processes, high or fluctuating workload, low client latency, and bandwidth when trans-ferring multiple files between repositories reduces the degree of isolation. The type of software process is chal-lenging because it depends on the cloud resource being optimised. (See “Results” section)
2. Providing a novel explanatory framework for: (i) mapping the degrees of tenant isolation to different software processes, cloud resources and layers of the cloud application stack (see “Results” and “Analysis” sections).
users/requests, customizability, the size of generated data, the scope of control of the cloud application stack and business constraints) to be considered for optimal deploy-ment of components with a guarantee of the required degree of tenant isolation (see “Results” and “Analysis” sections).
3. Presenting challenges and recommendation for implementing the required degree of tenant isolation. The challenges identified in this study are related to the type and location of components to be shared, customizability of the software tool, optimization of resources to cope with changing workload, hybrid cloud deployment con-ditions, tagging components with the required degree of isolation, error messages and security challenges dur-ing implementation. This study suggests among other things the following recommendations: (i) allowing the software architect to have more control over layers of the cloud infrastructure for configuration and provision-ing of resources; (ii) splittprovision-ing complex software processes into phases and isolation implemented for each phase in turn (ii) categorizing a cloud-hosted service into dif-ferent aspects that can or cannot be customised (see “Discussion” section).
The rest of the paper is organized as follows -“Related work on degrees of tenant isolation for cloud-hosted services” section gives an overview of related work on degrees of tenant isolation for cloud-hosted services. “Methods” section discusses the cross-case analysis methodology used in this paper and how it fits into the overall case study research process. “Summary of the case studies” section provides a sum-mary of the previous case studies. In “Results” section, presents the results of the cross-case analysis. “Analysis” section is a further analysis of the data produced from the cross-case analysis. “Discussion” section is the dis-cussion of the results of the study. The limitations and validity of the study are presented in “Threats to validity” section. “Conclusions” section concludes the paper with the direction of future work.
Related work on degrees of tenant isolation for cloud-hosted services
Research work on multitenancy has acknowledged that there are varying degrees of isolation tenants accessing a multitenant cloud-hosted service [11–14]. Chong and Carraro discuss three approaches to managing multi-tenant data, and it is stated that the distinction between the shared data and isolated data is more of a contin-uum, where many variations are possible between the two extremes [11]. Three multitenancy patterns have been identified which express the degree of isolation between tenants accessing a shared component of an application [3]. These patterns are referred to as shared component, tenant-isolated component and dedicated component.
The shared component represents the lowest degree of isolation between tenants while the dedicated component represents the highest. The degree of isolation between tenants accessing a tenant-isolated component would be in the middle.
Wang et al. explored key implementation patterns of data tier multi-tenancy based on different aspects of iso-lation such as security, customization and scalability [12]. For example, under the resource tier design pattern, the authors identified the following patterns: (i) totally iso-lated (dedicate database pattern); (ii) partially shared (ded-icate table pattern); and (iii) totally shared (share table pattern). These patterns are similar to the shared nent, tenant-isolated component and dedicated compo-nent patterns at the data tier, respectively [3]. Vengurlekar describes three forms of database consolidation which offer differing degrees of inter-tenant isolation as follows: (i) multiple application schemas consolidated in a single database, multiple databases hosted on a single platform; and (iii) a combination of both [13].
Mietzner et al. described how the services (or com-ponents) in a service-oriented SaaS application can be deployed using different multi-tenancy patterns and how the chosen patterns influence the customizability, multi-tenant awareness and scalability of the application [15]. These patterns are referred to as a single instance, single configurable instance and multiple instances. Although this work describes how individual services of a SaaS application can be deployed with different degrees of cus-tomizability, we believe that these concepts are similar to different degrees of isolation between tenants.
The three main aspects of tenant isolation are per-formance, stored data volume and access privileges. For example, in performance isolation, other tenants should not be affected by the workload created by one of the ten-ants. Guo et al. evaluated different isolation capabilities related to authentication, information protection, faults, administration, etc [16]. Bauer and Adams discuss how to use virtualization to ensure that the failure of one tenant’s instance does not cascade to other tenant instances [4].
Youngs et al. discussed the decomposition of applica-tion funcapplica-tionality into applicaapplica-tion components and later the summarization of these components to tiers to achieve isolation between tenants [19]. Varia’s research work gen-erally motivates why applications should be split into separate components when using the Amazon Web Ser-vices on the cloud to guarantee tenant isolation [20,21]. Varia has also discussed different migration scenarios for existing applications to Amazon Web Services (AWS) or other cloud storage [22].
At the very basic degree of multitenancy, tenants share application components as much as possible which trans-lates to increased utilisation of underlying resources. However, while some application components may ben-efit from a low degree of isolation between tenants, other components may need a higher degree of isola-tion because the component may either be too critical or needs to be configured very specifically for individual ten-ants because of their unique deployment requirements. Again, tenant-specific requirements, such as laws and cor-porate regulations, may even further increase the degree of isolation required between tenants.
A component-based approach to tenant isolation through request re-routing, (COMITRE), was developed in our previous work. This approach was then applied to three case studies that empirically evaluated the varying degrees of isolation between tenants enabled by multite-nancy patterns for three different Global Software Devel-opment (GSD) tools and associated processes: continuous integration with Hudson, version control with File System SCM plugin, and bug tracking with Bugzilla [5–7]. The GSD tools were deployed to the cloud using differ-ent cloud multitenancy patterns which represdiffer-ent varying degrees of isolation between tenants.
The aim of this paper is, therefore, to extend the over-all evidence beyond the existing case studies, by syn-thesizing the findings of the three primary case studies that have been conducted to evaluate the degree of iso-lation between tenants accessing different cloud-hosted
GSD tools deployed using different multitenancy patterns. The findings will provide the commonalities and differ-ences across the existing case studies, and an explana-tory framework for mapping degrees of tenant isolation to different software processes and explaining the trade-offs to be considered for optimal deployment of compo-nents with a guarantee of the required degree of tenant isolation.
Methods
In this section, we will first present the cross-case analy-sis method used in this paper and thereafter discuss how the cross-case analysis phase fits into the overall research procedure from the exploratory phase to the development of the explanatory framework.
Cross-case analysis
This study uses cross-case analysis to synthesize the find-ings of the three primary case studies. In a cross-case analysis, evidence from each primary study is summarised and coded under broad thematic headings, and then sum-marised within themes across studies with a brief citation of primary evidence. A cross-case analysis was selected because it involves a highly systematic process and allows us to include diverse types of evidence [9,23].
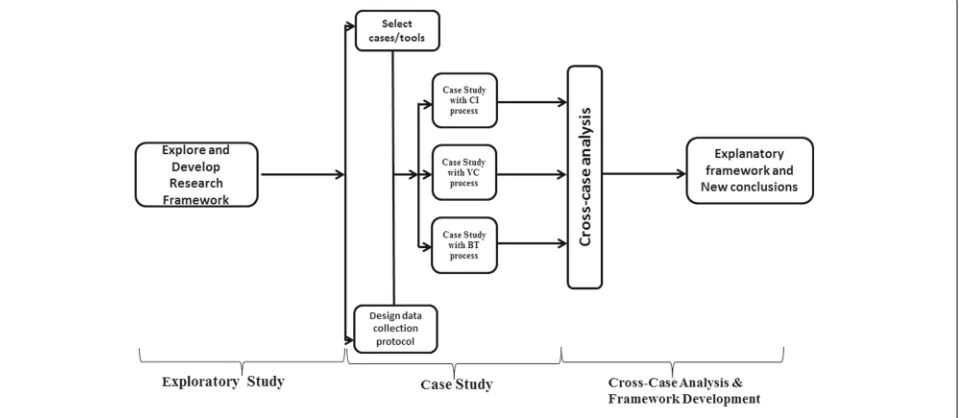
As shown in Fig.1, the methodology can be divided into three phases: gathering findings from primary case stud-ies, cross-case analysis and framework development. In the first phase the findings from the three primary case studies are gathered, summarised and pushed into the sec-ond phase which is the cross-analysis. In the cross-case analysis phase, we mobilise knowledge from individual case studies, compare and contrast the cases, and in doing so, produce a new knowledge. This knowledge is fur-ther refined to form an explanatory framework explaining the commonalities and differences in the design, imple-mentation and deployment of cloud-hosted applications and the trade-offs to consider when implementing tenant isolation [10].
This paper adopts Miles and Huberman’s approach for conducting the cross-case analysis. The approach con-sists of three mains steps: data reduction, data display, and conclusion drawing and verification [9].
Data reduction
This mainly involves the identification of items of evidence in the primary case studies such as the paired sample test, plots of the estimated marginal means of change, discus-sion of findings and recommendations from previous case studies [9].
Data display
This step involves organising and assembling information that allows the drawing of conclusions using tools such as meta-matrices/tables and cause and relationships graphs. The data display steps will be tackled from two approaches to cross-case comparisons [24]:
(i) Variable oriented approach:This approach focuses on the variables to explain why the cases vary. These variables are related to performance and resource con-sumption which are known to affect the varying degrees of isolation between tenants.
(ii) Case-oriented approach:This approach focuses on the case itself instead of the variables to explain in what ways the cases are alike. By knowing the aspects in which the cases are alike it is then possible to generalise our findings, for example, to identify factors that appear to lead to a high (or low) degree of tenant isolation with a corresponding effect on resource consumption.
Conclusion drawing
This step involves further refining the above steps to produce conclusions concerning a particular aspect of interest. The outcomes of this step are a summary of: (i)
key conclusions from the statistical analysis, and (ii) the recommended patterns for achieving the required degree of tenant isolation.
In summary, the focus of this paper is on a qualitative cross-case analysis of three quantitative case studies. We employed this approach because the context for each of the cases is rather different (for example, the requirements of bug tracking applications are not the same as those of version control applications) and because we are not try-ing to synthesise results here, but rather analyse the three cases and draw out commonalities and differences
Overall case study research process
The overall research procedure used in this study from the initial selection of the Global Software Development tools and processes up to the development of an explana-tory framework (after carrying out cross-analysis of the case studies) is shown in Fig.2. The overall research pro-cess can be regarded as a multimethod method research approach which entails combining different research methods: exploratory study, case study and cross-case analysis. The different research methods were chosen based on the qualities that each research method can con-tribute to answering our research question. For example, the exploratory study allowed us to carry out an empir-ical study to find out the type of software process and the supporting tools used in Global Software development projects and also explore the different cloud deployment patterns for deploying services to the cloud. The case study provided us with an in-depth understanding of the software processes and the effect of varying degrees of tenant isolation on the performance and resource con-sumption of tenants. The cross-case analysis allowed us to accumulate knowledge, compare and contrast cases,
and in doing so, produce new knowledge such as an explanatory framework for explaining the commonalities and differences in the case studies and the trade-offs to consider when implementing tenant isolation [10].
As shown in Fig. 2, the research process started with an exploratory study which entails reviewing related work on multitenancy and tenant isolation, carrying out empir-ical studies on widely used software tools, formulating research questions, and developing the scope of study. The next step involved selecting the software tools and sup-porting processes based on findings of the previous step, and then designing the experimental procedure, data col-lection and analysis of results of from the primary case studies. The third step, which is the focus of this study, involves carrying out the synthesis of findings of the pri-mary case studies in order to provide an explanatory framework and new insights on tenant isolation.
In the next section, we will provide a summary of the case studies. The summary is important for two main reasons: (i) to summarise the primary case studies and show how the cross-case analysis fits into the overall research process; (ii) to summarise the findings of the case studies.
Summary of the case studies
In this section, we summarise the overall research process with particular reference to how the cases studies were conducted.
Selection of GSD tools and processes
This study used the most-similar technique (i.e., pur-posive, non-random selection procedure) to select the cases, since random sampling is inappropriate as a selec-tion method [25]. The three GSD tools we selected were inspired by the dataset of GSD tools and processes derived from a previous exploratory study on how to create and use a taxonomy for selecting applicable deployment pat-terns for cloud deployment of GSD tools. In that study, we derived a set of five GSD tools - JIRA, VersionOne, Hudson, Subversion and Bugzilla [26]. Each of these tools supports different GSD processes such as continuous integration, issue tracking, bug tracking, version control, source code management and agile project management. From this dataset, we then selected three GSD processes that are widely used in Global Software Development: continuous integration with Hudson, version control with FileSystem SCM Plugin, and bug tracking. These GSD processes were chosen for three main reasons: (i) these processes are widely used in GSD; (ii)there are open-source tools and/or plugins that are specifically developed to support them; and (iii) they are flexible to be customize and extended.
We have to point out here that the emphasis of this study is not on the GSD tools or plugins themselves but on the
GSD process they support. There are different tools and plugins that can be used to trigger these processes. Our intention was to choose a tool or plugin that is specifically developed to trigger the GSD processes we have selected. For example, Hudson can be used to trigger several GSD processes but it was mainly developed to support con-tinuous integration. Therefore, we wanted to know how these processes and the data they generate impact on ten-ant isolation with respect to performance and resource utilization.
Conducting case studies
Case studies are well suited for software engineering research since they study contemporary phenomena in its natural context (i.e., real-world open-source GSD tools in our case) [27]. This study is based on three primary case studies (published separately [5–7]) which evalu-ated empirically the degree of isolation between ten-ants enabled by multitenancy patterns for Cloud-hosted GSD tools and processes under different cloud deploy-ment conditions. Software tools used for Global Software Development (GSD) are increasingly being deployed on the cloud, and therefore it is essential to properly isolate the code files and processes of tenants so that the required performance, resource utilization, and access privileges of one tenant does not affect other tenants.
Design of the case study
The specific design of the case study is multiple-case design with multiple embedded units of analysis. This case study design represents a form of mixed method research which relies on more holistic data collection strategy for studying the main case but then calls upon more quanti-tative techniques (in this case, experimentation) to collect data about the embedded unit(s) of analysis [25,27]. The experiments within the case study will enable us to collect data for evaluating the degree by which the performances of the different deployment architecture/patterns would differ under realistic cloud deployment conditions of GSD tools.
Fig. 3Multiple-case (embedded) design adopted for the study
The results of the study were analysed using relevant statistically techniques. We adopted the Repeated Mea-sures Design and Two-way Repeated MeaMea-sures (within-between) ANOVA for the experimental design and statistical analysis respectively [28,29].
COMITRE: a framework for implementing tenant isolation in the case studies
The implementation of the tenant isolation is done within the framework of COMITRE and its support-ing algorithms. We refer the reader to [5, 6, 30] for the architecture, implementation procedure and sup-porting algorithms for COMITRE that are integrated into the GSD tools to support the implementation of the vary-ing degrees of tenant isolation.
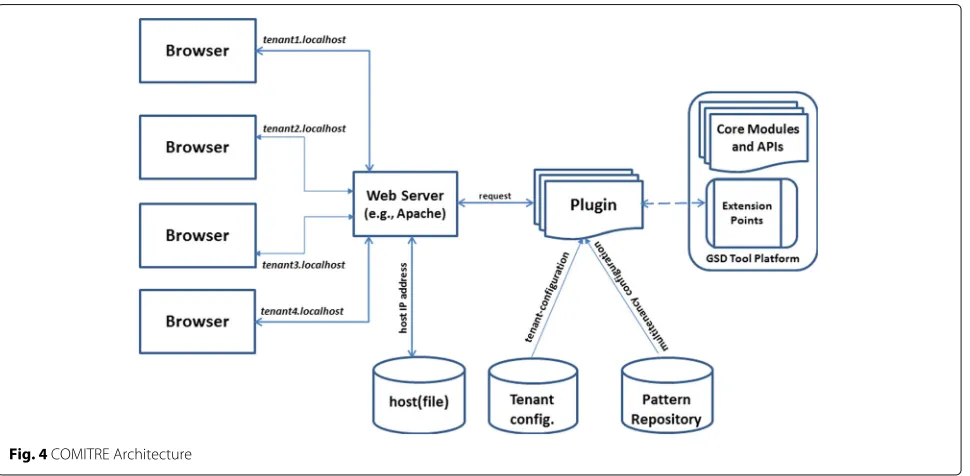
In a nutshell, the Component-based approach to Multitenancy Isolation through Request Re-routing (COMITRE) is an approach for implementing the vary-ing degrees of multitenancy isolation for cloud-hosted services/applications. It captures the essential properties required for the successful implementation of multite-nancy isolation while leaving large degrees of freedom to cloud deployment architects depending on the required degree of isolation between tenants. Figure4captures the architecture of COMITRE.
The actual implementation of the COMITRE is anchored on shifting the task of routing a request from the server to a separate component at the application level of the cloud-hosted GSD tool. For example, this compo-nent could be a program compocompo-nent (e.g., Java class file)
or a software component (e.g., plugin) which can be inte-grated into the GSD tool. Once the request is re-routed to a component and captured, then important attributes of the request can be extracted and configured to reflect the degree of isolation required by the tenant.
Implementation of tenant isolation
In this section, we present a short description of how the three case studies were implemented. The three pri-mary case studies have been published separately, and we refer the reader to [5–7] for details. The case studies are summarised below:
1. Case Study One - Continuous Integration with Hudson: Hudson is a continuous integration server, written in Java for deployment in a cross-platform environment [31]. Large organisations such as Apple and Oracle use Hudson for setting up production deployments and automating the management of cloud-based infrastructure [32]. Our main interest is in capturing the isolation of a tenant’s data and process during automated build verification and testing, an essential development practice when using a continuous integration system. Tenant isolation was implemented by modifying Hudson using the Hudson’s Files-Found-Trigger plugin, which polls one or more directories and starts a build if certain files are found within those directories [33]. This involved introducing a Java class into the plugin that accepts a filename as an argument. During execution, the plugin is loaded into a separate class loader to avoid conflict with Hudson’s core functionality. As the build process is being carried out, data is logged into a database every time a change is detected in the file.
2. Case Study Two - Version Control with File System SCM plugin: Filesystem SCM plugin can be used to simulate the file system as a source control
management (SCM) system by detecting changes such as the file system’s last modified date [33]. Our interest was in simulating the process on a local development machine by pointing a build configuration to the locally checked out code and modified files on a shared repository residing on a private cloud. The File System SCM plugin was integrated into Hudson to represent a scenario where a code file is checked into a shared repository for Hudson to build. Tenant isolation was then implemented by modifying this plugin within Hudson. This involved introducing a Java class into the plugin that accepts a file path and the type of file(s) that should be included when checking out from the repository into Hudson workspace. During execution, the plugin is loaded into a separate class
loader to avoid conflict with Hudson’s core functionality.
3. Case Study Three - Bug Tracking with Bugzilla: Bugzilla was modified using the recommended Bugzilla Extension mechanism. Extensions can be used to modify either the source code or user interface of Bugzilla, which can then be distributed to other users and re-used in later versions of Bugzilla. Bugzilla maintains a list ofhooks which represent areas in Bugzilla that an extension can hook into, thereby allowing the extension to perform any required action during that point in Bugzilla’s extension [34]. For our experiments, a special extension was written and then“hooked” into Bugzilla using the hook named
install_before_final_checks. This hook allows the execution of custom code before the final checks are done inchecksetup.pl, and so the COMITRE algorithm was implemented in this hook.
In this study, it is important to note that the use of plug-ins in the case study experiments is basically a mechanism for customizing, modifying and extending the GSD tools (e.g., Hudson and Bugzilla) to support the implementa-tion of multitenancy architectures and is not a limitaimplementa-tion to providing insights about the trade-offs across the dif-ferent multitenancy patterns. Most open-source tools are easily extensible using plugins by relying on a series of extension points provided to extend its functionality. For example, the extension points provided within Hudson plugin was customised to implement the three multite-nancy patterns (i.e., shared component, tenant-isolated component, dedicated component) and thus support mul-titenancy isolation. During execution, the plugin is loaded into a separate class loader which does not conflict with the core functionality of the GSD tool.
Evaluation of the case studies
The three case studies were evaluated using the same experimental design, setup, procedure and statistical anal-ysis. The evaluation of the case studies is summarised in the sections that follow.
Experimental design
The performance metrics (e.g., response times) and sys-tems resource consumption (e.g., CPU) of each tenant are measured before the treatment (pre-test) and after the treatment (post-test) was introduced. Thehypothesis of the experiment is that the performance and system’s resource utilisation experienced by tenants accessing an application component deployed using each multitenancy pattern changes significantly from the pre-test to the post-test.
Based on this information, a two-way repeated mea-sures (within-between) ANOVA was adopted as the experimental design. This experimental design is used when there are two independent variables (factors) influ-encing one dependent variable [29]. In our case, the first factor is multitenancy deployment pattern, and the sec-ond factor is time. Multitenancy pattern is the between factor because our interest is in looking at the differences between the groups using different multitenancy patterns for deployment. Time is the within factor because our interest is in measuring each group twice (pre-test and post-test). The data view of our experimental design is composed of a Group column that indicates which of the three groups the data belongs to, and 2 columns of actual data, one for the Pre-test and one for the Post-Test.
Experimental setup
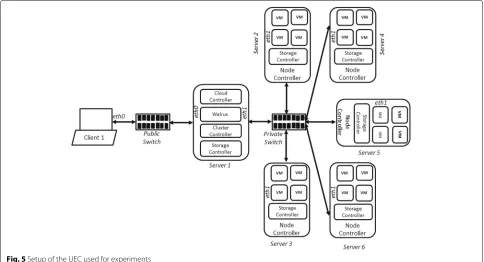
The experimental setup consists of a private cloud setup using Ubuntu Enterprise Cloud (UEC). UEC is an open-source private cloud software that comes with Eucalyptus
[35]. Figure5is the UEC configuration used for the experi-ment. It has six physical machines - one client node(i.e, the head node) and five server node (i.e., the sub-nodes). The experimental setup is based on the typical minimal Euca-lyptus configuration where all user-facing and back-end controlling components (Cloud Controller(CLC), Wal-rus Storage Controller (WS3), Cluster Controller (CC), and Storage Controller (SC)) are grouped on the first machine, and the Node Controller (NC) components are installed on the second physical machine. The guidelines for installing UEC as outlined in [36] were followed to extend the configuration by installing the NC on all the other sub-nodes to achieve scalability. The head node was also used as the client machine since it does not have to be a dedicated machine. Installing UEC is like installing Ubuntu server; the only difference is the additional config-uration screens for the UEC components. The hardware configuration of the head node and sub-nodes is sum-marised in Table1.
Setup of the UEC used for experiments Experimental procedure
An abstract summary of the experimental procedure used for all the case studies is captured in Fig. 6. We refer the reader to [5, 6] for specific details of how the GSD tools were modified for each case study, how the processes associated the GSD tools were simulated, and the exper-imental procedure, so these details will not be repeated here due to space limitations.
Table 1Hardware and Network Configuration of the UEC
HeadNode Sub-nodes
Hardware settings
CPU VT extension, 64 bit, multicore 2 x2 GHz
Memory 4 GB 2 GB
Disk 7200 rpm SATA/SCSI 7200 rpm SATA
Disk Space 80 GB 40
Networking 1 Gbps 1Gbps
Network settings
Functionality CLC,WS3,CC,SC NC
No of NICs 2 (eth0 and eth1) 1(eth0)
IP Addresses 10.85.56.4 10.85.56.5-10.85.56.9
Hostname nc1 n1, n2,n3,n4,n5
Name Servers 10.12.5.100-10.12.5.102 10.12.5.100-10.12.5.102
Gateway IP 10.85.56.3 10.85.56.3
In a nutshell, the GSD tool used for each case study is modified to support tenant isolation. This involved devel-oping a plugin and integrating it with the GSD tool so that it can be accessed by different tenants. The GSD tool is then bundled as a VM image and uploaded to a private cloud with a typical minimal UEC configuration.
To evaluate the degree of tenant isolation between ten-ants, four tenants (referred to as tenant 1, 2, 3, and 4) were configured based on access to the functional-ity/component of the GSD tool that is to be served to mul-tiple tenants. Accesses to this functionality is associated with a tenant identifier that is attached to every request. Based on this identifier, a tenant-specific configuration is retrieved from the tenant configuration file and used to
1. Prepare the Private Cloud for the Test Run (a) Create an Ubuntu Virtual Machine Image (b) Install the modified GSD tool on the image (c) Upload the Image to UEC
(d) Launch the instance and SSH to the instance 2. Execute the Test Run
(a) Start the GSD tool and view it on a browser (b) Start JMeter load test on the GSD tool (c) Start instance monitoring with SAR tool (d) Stop test run after all responses received 3. Collect Results
(a) Export JMeter and SAR result to text file (b) Clear previous JMeter and SAR results (c) Reboot instances for next test run (d) Repeat step 2 for more runs
Fig. 6Experimental procedure
adjust the behaviour of the GSD tool’s functionality that is being accessed.
A remote client machine was used to access the GSD tool running on the instance via its public IP address. Apache JMeter is used as a load balancer as well as a load generator to generate workload (i.e., requests) to the instance and monitor responses [37]. To measure the effect of tenant isolation, tenant 1 was configured to sim-ulate a large instant load by: (i) increasing the number of requests using the thread count and loop count; (ii) increasing the size of the requests by attaching a large file to it; (iii) increasing the speed at which the requests are sent by reducing the ramp-up period by one-tenth, so that all the requests are sent ten times faster; and (iv) creating a heavy load burst by adding the Synchronous Timer to the Samplers in order to add delays between requests, such that a certain number of requests are fired at the same time. This treatment type can be likened to an unpre-dictable (i.e., sudden increase) workload [3] and aggressive load [17].
Each tenant request is treated as a transaction composed of all types of request simulated. For example, the HTTP request triggers a build process while the JDBC request logs data into a database which represents an application component that is being shared by the different tenants. The transaction con-troller is used to group all the samplers in order to get the total metrics (e.g., response) for carrying out the two requests.
Table 2Setup parameters used in the experiments
Parameters Values for case study 1 Values for case study 2 Values for case study 3
No of threads 10 for tenant 1 (i.e., the tenant experiencing high load); 5 for all other tenants
2 for all tenants 5 for all tenants
Thread Loop count 2 5 for all tenants 2 for all tenants
Loop controller count 10 for HTTP requests of tenant 1, and 5 for all other tenants; 200 for JDBC requests of tenant 1, and 100 for all other tenants
4 for tenant 1, and 2 for all other tenants for each type of request (HTTP, BeanShell, FTP upload and FTP download samplers)
20 for tenant 1 and 10 for all other tenants for the HTTP and BeanShell samplers
Ramp-up period 6 seconds for tenant 1, 60 seconds for all other tenants
6 seconds for tenant 1, 60 seconds for all other tenants
6 seconds for tenant 1, 60 seconds for all other tenants
Size of request 1MB for tenant 1, and 200KB for other tenants.
1MB for tenant 1, and 200KB for other tenants.
1MB for tenant 1, and 200KB for other tenants.
(e.g., Hudson’s build processes) running on the private cloud before conducting the experiments.
Statistical analysis of the case studies
Based on the information about the experimental design, the two-way Repeated Measures (within-between) ANOVA was adopted for the statistical analysis because (i) it does not require many subjects since each subject would be measured twice. and (ii) it eliminates the dif-ficulty of trying to match subjects perfectly between the different conditions in all respects [38].
The tool used for statistical analysis is SPSS v21. The two-way (within-between) ANOVA was performed first to determine if the groups had significantly different changes from Pre-test to the Post-test. After that,planned comparisonswere carried out involving the following:
(i) a one-way ANOVA followed by Scheffe post hoc tests to determine which groups showed statistically signifi-cant changes relative to the other groups. The dependent variable (simply called “Change”), used in the one-way ANOVA test was determined by subtracting the Pre-test from Post-test values.
(ii) a paired sample test to determine if the subjects within any particular group changed significantly from pre-test to post-test were measured at 95% confidence interval. This would give an indication whether or not the workload created by one tenant affected the per-formance and resource utilisation of other tenants. The “Select Cases” feature in SPSS was used to select the three tenants (i.e., the T2, T3, T4 that did not experience large
instant loads) for each pattern which gives a total of 3 cases for each metrics measured [28,29].
After the first two steps outlined above, the plots of esti-mated marginal means were analysed in combination with ANOVA (plus post hoc test) and paired sample test results from SPSS output. These plots are referred to as the “Esti-mated Marginal Means of Change (EMMC)”. Note that the word “Change” refers to the transformed variable used as the dependent variable in the one-way ANOVA. The plot of EMMC is simply a plot of the mean value for each combination of factor level.
Results of the case studies
In this section, we present a summary of results of each case study.
Results for case study 1 - continuous integration
The results of the case study are analysed based on the results of the paired sample t-test shown in Table3, and supplemented with information from the plots of Esti-mated Marginal Means of Change(EMMC) 1. The key used in constructing the paired sample t-test table is as follows: YES - represents a significant change between the metrics measured from pre-test to post -test. NO - rep-resents some level of change which cannot be regarded as significant; no significant influence on the tenants. The symbol “-” implies that the standard error of the difference is zero and hence no correlation and t-test statistics can be produced. This means that the differ-ence between the pre-test and post-test values are nearly
Table 3Paired sample test analysis for case study 1
Pattern Response times Error% Throughput CPU Memory Disk I/O System load
Shared NO NO YES YES YES NO
-Tenant-isolated NO - YES NO YES YES
-constant with no chance of variability. Figures 8, 9, 10, 11, 12, 13 and 14 in the AppendixA show the plots of the estimated marginal means of change for the parameters measured2.
(1) Response times and Error%:Table3shows that the response times and error% of tenants did not change sig-nificantly except for the dedicated component. The plot of the EMMC revealed that the magnitude of change for response times showed a much larger change for the ded-icated component. This is due to the overhead incurred because of opening multiple connections to the database each time a JDBC request is made to a different database. For error%, the magnitude of change was larger for ten-ants deployed based on the shared component than for other patterns. A possible explanation for this is that there is resource contention since multiple connections are opened while sending requests that log all the data into the same component (i.e., database table) that is being shared. Overall, this causes delay in completion times thereby producing a negative effect on error%.
(2) Throughput:The paired sample test result showed that the throughput changed significantly, implying a low degree of isolation. In this situation, the shared compo-nentis not recommended for avoiding a situation where requests are struggling to gain access to the same applica-tion component, thereby resulting in some request either being delayed or rejected. For a tenant-isolated compo-nent and dedicated compocompo-nent, there would not be much change in throughput because requests are not concen-trated on one application component but instead are directed to the separate components reserved for different tenants. Throughput can be likened to bandwidth, and so it means that the bandwidth was not sufficiently large to cope with the size, number and frequency of requests sent to the CI system.
(3) CPU and System Load: The paired sample test showed that the CPU consumption of tenants did not change significantly for most patterns except for the
shared component. Therefore, once a reasonable CPU size (e.g., multiple CPUs or a multi-core CPU) is used, there should be no problem in performing builds. Builders are not known to consume much CPU. For example, Hudson does not consume much CPU; a build process can even be setup to run in the background without interfering with other processes [32].
One of the most significant findings of this study is that the system load did not influence any of the patterns. The paired sample test results were similar in all patterns; that is, the standard error difference was the same for tenants (or components) deployed using all the three mul-titenancy patterns. This result shows that the system load was nearly constant with no variability in the values from pretest to post-test. Therefore, in a real cloud deployment, the system load would not be a problem especially if CPU is reasonably large enough to allow the application to scale well.
(4) Memory:The paired sample test result showed that there was a significant change in memory consumption for all three patterns. Complex and difficult builds are those that are composed of a vast number of modular components including different frameworks, components developed by different teams or vendors, and open source libraries [39]. Compilers and builders consume a lot of memory especially if the build is difficult and complex [32]. In a large project, it is expected that multiple builds will interact with multiple components to create several dependencies and supported behaviour with each other thereby making builds difficult and complex.
(5) Disk I/O:Compilers and builders are known to con-sume disk I/O especially for I/O intensive builds [32]. The results show that only the shared component showed no significant change in disk I/O usage. This is under-standable because multiple transactions are channelled to the same component which would either be delayed or blocked because of sharing the components. Further analysis of the plot of the EMMC confirmed that the mag-nitude of change for the shared component was the least, and therefore is recommended for builds that particularly involve intensive I/O activity especially when locking is enabled.
Results for case study 2 - version control
The results of the case study are analysed based on the paired sample t-test (shown in Table4) and supplemented with information from the plots of Estimated Marginal Means of Change (EMMC). Figures 15, 16, 17, 18, 19, 20 and 21 in the AppendixBshow the plots of the estimated marginal means of change for the parameters measured.
(1) Response times and Error%:The paired sample test results showed that response times changed significantly
Table 4Paired sample test analysis for case study 2
Pattern Response times Error% Throughput CPU Memory Disk I/O System load
Shared YES NO YES YES YES YES
-Tenant-isolated NO NO YES YES YES YES YES
-for most of the patterns. As expected, the plot of the EMMC demonstrated that the magnitude of change for response times was much higher for the shared compo-nent and the tenant-isolated compocompo-nent. The results seem to show that there were no long delays that affected the error% rate. The error% showed no significant change based on the paired sample t-test. One aspect where error% (i.e., unacceptably slow response times) is known to have an impact is when committing a large number of files to a repository that is directly based on the native OS file system (e.g., FSFS). Delays usually arise when finalising a commit operation which could cause tenants requests to time out while waiting for a response.
(2) Throughput:The paired sample t-test results show that throughput changed significantly for all the patterns. Further analysis of the plots of the EMMC showed that the magnitude of change for the shared component was much higher than the other patterns. Since locking was enabled, it seems to show that it had an adverse impact on a tenant deployed based on ashared component. There-fore, the dedicated component would be recommended for tenants accessing bugs, especially if the bugs are stored in a database with locking enabled.
(3) CPU and System Load: The paired sample t-test showed that CPU changed significantly for all patterns. A possible reason for this is the overhead incurred in trans-ferring data from the shared repository based on FSFS to the database (i.e., MySQL). The plot of the EMMC showed that the magnitude of change in CPU increased steadily across the three patterns with the dedicated com-ponent being the most influenced. Therefore, if there is need to avoid high CPU consumption, then the dedicated component is therefore not recommended for version control. This is because storing or retrieving bugs could involve locking or blocking other tenants from accessing a component that is being shared.
Table 4 shows that system load was nearly constant with no chance of variability, and so this means that sys-tem load did not influence any of the patterns. Therefore, with a reasonably high-speed network connection and CPU size, there should be no problem with system load when sending data across a shared repository residing in a company’s LAN or VPN.
(4) Memory and Disk I/O: Memory consumption changed significantly for all patterns based on the paired
sample t-test result. The plot of the EMMC showed that the magnitude of change for the shared component was higher than the other patterns. Therefore, the shared com-ponent would not be recommended when there is a need for better memory utilisation. The paired sample t-test revealed that the usage of disk I/O by tenants changed sig-nificantly from pre-test to post-test for all the patterns. This is due to the intense frequency of the I/O activities in the disk because of the file upload and download opera-tions. The dedicated component would be recommended since this would allow each tenant to have exclusive access to the component being shared, thereby reducing a possi-ble contention for disk I/O and other resources when the number and frequency of request increase suddenly.
Results for case study 3 - bug tracking
This section presents a summary of the experimental results for case study 3. The results of the paired sample t-test are summarised in Table 5, while the plots of the estimated marginal means of change are shown in Figs. 22, 23, 24, 25, 26, 27 and 28 in the AppendixC.
(1) Response times and Error%: From the plots of the estimated marginal means of change (EMMC), it can be seen that the dedicated component showed a lower magnitude of change in response time, and it is recom-mended for achieving isolation between tenants accessing bugs in a database with locking enabled. However, the plots of EMMC show that the number of requests with unacceptable response times was much higher for shared components compared to tenant-isolated and dedicated components. This is possibly due to the effect of lock-ing on the database which causes a delay in the time it takes for requests to be committed. Using the dedicated component ensures a high degree of isolation, but with limitations of increased resource consumption (e.g., mem-ory and disk I/O). To address this challenge, it is suggested storing large bug attachments on the disk and then stor-ing the links to these files on the bug database to improve performance, especially when retrieving data.
(2) Throughput:The paired sample test result showed that there was no significant change in throughput for most of the patterns unlike two previous case studies. This result is similar to that of the two previous case studies where throughput was relatively stable. The impli-cation of this is that if the component being shared is
Table 5Paired Sample Test Analysis for Case Study 3
Pattern Response times Error% Throughput CPU Memory Disk I/O System load
Shared NO YES NO YES YES YES
-Tenant-isolated YES YES YES YES YES YES
-a d-at-ab-ase, then throughput should not be expected to change drastically. Based on the plot of the EMMC, the shared component would be recommended when bugs are stored in a database with locking enabled.
(3) CPU and System Load:The results of the paired sam-ple test show that there was a significant change in CPU for all the patterns. By analysing the plots of the EMMC, the results show that the dedicated component changed the most and so would not be recommended if optimis-ing CPU usage is a key requirement. As with other case study results, there was no influence on any of the patterns for system load. The plots of EMMC showed that system load increased steadily across the patterns from shared component to dedicated component.
(4) Memory and Disk I/O: The paired sample test for both the memory and disk I/O showed a highly signifi-cant difference from pretest to post-test both for memory and disk I/O. For memory, the plot of the EMMC similarly showed that the dedicated component had the highest significant change compared to the other patterns. This is possibly due to running Bugzilla in a mod_perl envi-ronment, and so using a dedicated component would not be a good option for optimising system resources. It is well known that running Bugzilla inmod_perl envi-ronment consumes a lot of RAM [34]. The significant change in disk I/O consumption is due to the intense fre-quency of read/write activities in the database. For disk I/O consumption, having enough storage space would be required, especially if a large volume of bugs with attach-ments is expected. If a large number of users are expected, then applying disk space saving measures such as purging unwanted error or log files regularly could reduce disk I/O consumption and improve the chance of having a higher degree of isolation.
Results
This section explains how the findings from the three case studies were synthesised. The case synthesis was done using cross-case analysis approach and then comple-mented with narrative synthesis.
Cross-case analysis
In this section, we present the results of the cross-case analysis that was applied in an iterative manner during the analysis to reach the conclusion.
Data reduction
In our previous case study, much of the data reduction process was already done in the primary case studies. For each case study the following details are presented: (i) the paired test sample test, (ii) plots of the estimated marginal means of change, (iii) discussion of the findings and recommendations for achieving the required degree of isolation between tenants.
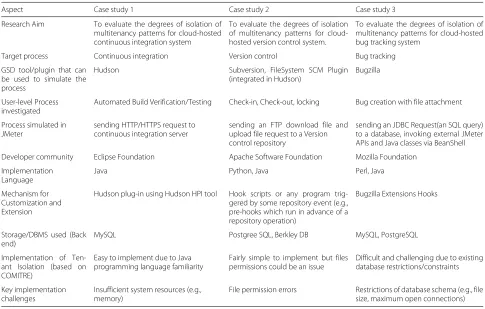
For each case study, we presented the paired sample test result plus the plots of the estimated marginal means of change (EMMC). In addition to this data, a table (i.e., Table 6) showing the characteristics of the three cases studies is presented in this paper. Table 6 shows the features that are related to each case study based on a selected set of different aspects of the study.
Data display
This step involves organising and assembling information that allows the drawing of conclusions using tools such as meta-matrices/tables and cause and relationships graphs. The data display steps will be tackled from two approaches to cross-case comparisons: variable -orientated and case-oriented [24].
(A) Variable oriented approach:The data derived at this stage is a table (see Table7) showing the factors in which the cases vary, to explain why there is variation in the degree of tenant isolation across the cases. It is assumed that factors such as performance, resource utilisation, that are known to affect isolation between tenants were already used to evaluate the three cases independently. These fac-tors are captured in the seven metrics used to evaluate the three cases: response times, error%, throughput, CPU, Memory, disk I/O, and system load. Knowing the vari-ous aspects in which the cases vary would enable us to explain the variation in the degrees of tenant isolation for different GSD processes. The synthesis identified five aspects in which the cases vary: size of data generated, the resource consumption of the GSD process, client’s latency and bandwidth, supporting task performed, and error messages due to sensitivity to workload changes. These aspects are summarised below.
1. Size of Data Generated: One of the most important factors that account for the variation in the degree of tenant isolation is the fact that some GSD tools generate more data than others. For example, several of the problems that occur in version control relate to the fact that version control systems usually create additional copies of files on the repository, especially the ones that use the native operating system (OS) file system directly. This adversely affects
performance because these files occupy more disk space than they actually use, and the OS spends a lot of time seeking across many files on the disk [40]. 2. Effect of GSD process on Cloud Resources: The
Table 6Characteristics of the Case Studies
Aspect Case study 1 Case study 2 Case study 3
Research Aim To evaluate the degrees of isolation of multitenancy patterns for cloud-hosted continuous integration system
To evaluate the degrees of isolation of multitenancy patterns for cloud-hosted version control system.
To evaluate the degrees of isolation of multitenancy patterns for cloud-hosted bug tracking system
Target process Continuous integration Version control Bug tracking
GSD tool/plugin that can be used to simulate the process
Hudson Subversion, FileSystem SCM Plugin (integrated in Hudson)
Bugzilla
User-level Process investigated
Automated Build Verification/Testing Check-in, Check-out, locking Bug creation with file attachment
Process simulated in JMeter
sending HTTP/HTTPS request to continuous integration server
sending an FTP download file and upload file request to a Version control repository
sending an JDBC Request(an SQL query) to a database, invoking external JMeter APIs and Java classes via BeanShell
Developer community Eclipse Foundation Apache Software Foundation Mozilla Foundation
Implementation Language
Java Python, Java Perl, Java
Mechanism for Customization and Extension
Hudson plug-in using Hudson HPI tool Hook scripts or any program trig-gered by some repository event (e.g., pre-hooks which run in advance of a repository operation)
Bugzilla Extensions Hooks
Storage/DBMS used (Back end)
MySQL Postgree SQL, Berkley DB MySQL, PostgreSQL
Implementation of Ten-ant Isolation (based on COMITRE)
Easy to implement due to Java programming language familiarity
Fairly simple to implement but files permissions could be an issue
Difficult and challenging due to existing database restrictions/constraints
Key implementation challenges
Insufficient system resources (e.g., memory)
File permission errors Restrictions of database schema (e.g., file size, maximum open connections)
when used with most of the patterns compared to version control and bug tracking. Under normal conditions, continuous integrations systems being compilers consume huge amounts of memory and disk I/O during high workload. Based on our results,
the dedicated component is recommended for performing builds when there is a sudden increase in workload.
3. Client Latency and Bandwidth: The variation in the degree of tenant isolation can also be explained based
Table 7Comparison of different aspects in which the Cases vary
Aspects Case 1- Continuous integration Case 2 – Version control Case 3 – Bug tracking system
Resource consumption High RAM and Disk I/O consumption (e.g., during the building of files)
Some native OS filesystem format (e.g., FSFS) consumes CPU (e.g., Delification, compressing data). Consumes memory during data caching
CPU and RAM consumption (could consume more CPU depending on runtime library used. Bugzilla consumes huge RAM if mod_perl is enabled), consumes memory during Caching DB transactions
Storage Space Requires large storage space to store build history
Requires large storage space to store additional copies of data
Limited (except large bug attachments are needed)
Latency and Bandwidth of client accessing the server
Transferring large data size across network; long distance between CI server and SCM server
Compressing data across, Migrating repository, Repository backup, Enabling file locking
Transferring large bug attachments across a network, Enabling Locking on DB transactions
Type of GSD process Long running build, large number of builds, complex and difficult builds
File locking Long running DB transactions with support for locking could consume more RAM
Storage format of the backend server
Portable across different OS. Storing massive builds on NFS mount reduces performance.
Some DBMS (e.g., Berkeley DB) might not be portable across different OS
Fairly portable across different OS
Interdependencies with other tools
Depends on Version control server for store archive data
Depend on a CI server to trigger polling before checkout data
on the latency and network bandwidth of the client accessing the GSD tool. If a client with a low bandwidth is trying to access a version control repository, then response time and error% will be negatively impacted. Compressing the data transmitted across the network can boost
performance, but the drawback is that it consumes much CPU. The results of case study one (i.e., continuous integration) showed that the magnitude of change for response time was more for the shared component compared to other patterns. This seems to suggest that a CI server (e.g., Hudson) should be configured close to an SCM server when polling a version control repository for changes.
4. Type of GSD Process and Supporting operations: There are several conditions associated with a GSD process that can result in different or varying degrees of isolation. Examples of such conditions include running long builds, a large number of builds and complex and difficult builds; and enabling file locking. For instance, a complex and difficult build involving lots of interdependencies will consume more resources (e.g., CPU) than an ordinary check-out process in a version control system. 5. Error Messages and Sensitivity of workload Changes:
The cases also vary in terms of their sensitivity to workload changes as manifested in the nature and type of error messages produced by the different GSD processes during the implementation of tenant isolation. The experimental results show that when a tenant experiences a high workload, different kinds of error messages are generated depending on the GSD process. The error messages are summarised as follows: for continuous integration, the most
common type of error was that of insufficient system resource (e.g., memory); for version control, the common error was that of directory and file
permissions; and for bug tracking the common error was database-related errors.
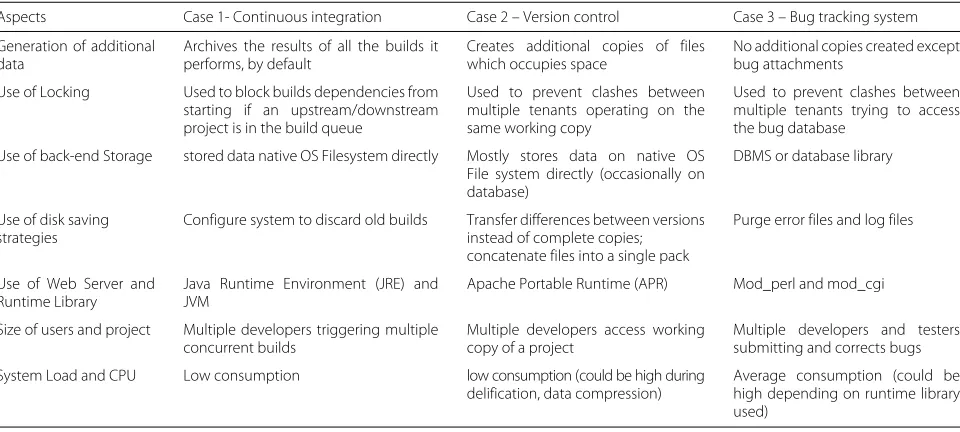
(i) Case-oriented approach: The data derived at this stage is a table (see Table8) showing the factors that are alike across the cases, and which appear to lead to similar outcomes when evaluating the varying degrees of ten-ant isolation in cloud-hosted GSD tools. The synthesis identified five aspects in which the cases are alike: a strat-egy for reducing disk space, locking, low consumption of some system resources, and use of plugin architecture for extending the GSD tool, and aspects of tenant isola-tion. The various aspects in which the cases are alike are summarised as follows.
1. Strategy for Reducing Disk Space: An interesting feature of all the GSD tools is that they have strategies for reducing disk space because of the possibility of the GSD tool generating a large volume of data due to the size, the number of artefact and number of users that may be involved in the project. For instance, CI systems can be configured to discard old builds. Version control systems can usedelification (i.e., a process for transferring differences between versions instead of complete copies) andpacking to manage disk space. For a bug tracking system, the error and log files can be purged from the database regularly. 2. Locking Process: All the GSD tools implement some
form of locking whether at the database level or filesystem level. For example, locking is used internally in version control systems to prevent clashes between multiple tenants operating on the
Table 8Comparison of different aspects in which the Cases are alike
Aspects Case 1- Continuous integration Case 2 – Version control Case 3 – Bug tracking system
Generation of additional data
Archives the results of all the builds it performs, by default
Creates additional copies of files which occupies space
No additional copies created except bug attachments
Use of Locking Used to block builds dependencies from starting if an upstream/downstream project is in the build queue
Used to prevent clashes between multiple tenants operating on the same working copy
Used to prevent clashes between multiple tenants trying to access the bug database
Use of back-end Storage stored data native OS Filesystem directly Mostly stores data on native OS File system directly (occasionally on database)
DBMS or database library
Use of disk saving strategies
Configure system to discard old builds Transfer differences between versions instead of complete copies; concatenate files into a single pack
Purge error files and log files
Use of Web Server and Runtime Library
Java Runtime Environment (JRE) and JVM
Apache Portable Runtime (APR) Mod_perl and mod_cgi
Size of users and project Multiple developers triggering multiple concurrent builds
Multiple developers access working copy of a project
Multiple developers and testers submitting and corrects bugs
System Load and CPU Low consumption low consumption (could be high during delification, data compression)
same working copy [41]. In Bugzilla, locking is used to prevent conflicts between multiple tenants or programs trying to access the Bugzilla database [34]. In continuous integration, locking can be used to block builds with either upstream or downstream dependency from starting if an
upstream/downstream project is in the middle of a build or the build queue [32]. When using a version control system that implements locking, fetching large data remotely and finalising a commit operation can lead to unacceptably slow response times (and can even cause tenants’ request to time out), and so having the repository together with the working copy located on your machine is beneficial. The results of case study two recommended a shared component to address the trade-off between resource utilisation and the speed of accessing or completing a version control process (e.g., checking out files from a repository). 3. Low Resource Consumption due to Workload
Changes: Most GSD tools do not consume much system resources like CPU and memory but can benefit from optimisations when there is a sudden change in workload. For continuous integration, memory and disk I/O will be mostly affected. For Bugzilla, it will be memory especially if locking and database transactions are enabled. For subversion, disk space and disk I/O are the obvious resources that will be most affected. System load and CPU consumption are generally low, and so using any of the patterns would not make much difference. System load showed no influence on all patterns. 4. Mechanism for customization and Use of Plugin
Architecture: All the GSD tools implement a "plugin architecture" for use in customising, modifying and extending the GSD tool. This means that other programs and components can be easily integrated with it [26]. For example, Hudson is easily extensible using plugins. A series of extension points are provided in Hudson that allows developers to extend its functionality [42]. These extension points are where the GDS tools can be customised to support tenant isolation.
5. Choice of Multitenancy Pattern for Required Degree of Tenant Isolation: The results generally showed that performance-related parameters such as response time, %error and throughput had changed significantly for shared pattern compared to system’s resources such as CPU, memory, disk I/O and bandwidth. For example, in version control and bug tracking, the dedicated component is recommended to improve response time while the shared
component is recommended to improve utilisation of memory and disk I/O. Because of this, the dedicated pattern (which is associated with a high degree of
isolation) is recommended to improve performance related parameters while the shared pattern (which is associated with a low degree of isolation) is
recommended to improve resource utilisation.
Conclusion drawing
This step involves further refining the above steps to pro-duce conclusions concerning a particular aspect of inter-est. The outcomes of this step are (i) key conclusions from the statistical analysis, and (ii) the recommended patterns for achieving the required degree of tenant isolation.
(A) Summary of Findings from Statistical AnalysisThe conclusions presented in this section are based on trends noticed in the statistical analysis performed to answer the hypothesis of the experiment which was to determine how tenants deployed using a particular pattern changed from pre-test to post-test.
1. For most of the GSD tools, the shared component changed significantly for performance-related parameters (e.g., response times, error% and throughput), while the dedicated component changed significantly for system’s resource-related parameters (e.g., CPU, memory and disk I/O). As the results show, the shared component would be recommended for improving systems resource consump-tion while the dedicated patterns would be recommended for improving performance. For example, the dedicated component was recommended to improve resource util-isation in bug tracking and CI systems under similar conditions. This is possibly due to the effect of locking which may have had an adverse impact on tenant isolation. 2. System load is nearly constant and no variability was found in almost all the case study results. A possible expla-nation for this is that the configuration of the deployed component, the nature of the tasks, and absence of a piled-up task queue for a long time being processed resulted in a reasonably good throughput. In most cases, if the load average is less than the total number of processors in the system, this suggests that the system is not overloaded and so it is assumed that nothing else influences the load average.
3. CPU changed significantly for version control and bug tracking systems, but not for continuous integration. This confirms what is already known about compiler/builders which is that it does not consume much CPU. However, it is important to note that certain operations or settings could increase CPU consumption regardless of the GSD tool used. Examples of such operations include enabling locking, data compression, and moving data between repositories in a different file format (i.e., FSFS).
simply do not add to the throughput. Furthermore, the small private cloud used for the experiments may have contributed to this fairly stable but significant change in throughput.
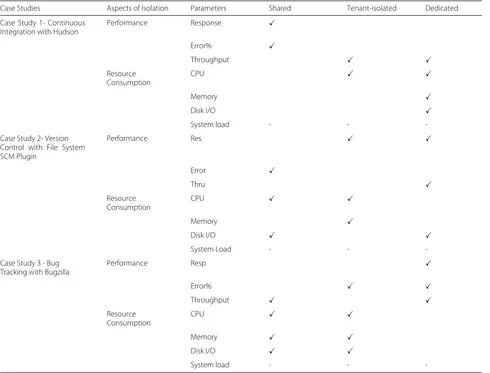
(B) Summary of Recommended Multitenancy Patterns for Deployment Table 9 shows a summary of the rec-ommended multitenancy patterns for achieving isolation between tenants when one of the tenants experiences a high load. These recommended patterns are derived by first checking the paired sample test result and then analysing the plots of the estimated marginal means of change (EMMC) to compare the magnitude of change in each pattern. The key used in constructing the table is as follows: (i) the symbol “”means that the pattern is rec-ommended; (ii) the symbol “x” means that the pattern is not recommended; and (iii) the symbol “-” implies that there is no difference in effect, and so any of the three patterns can be used.
For example, to ensure performance isolation in CI systems (e.g., regarding response time), the shared
component is recommended for performing builds gen-erally, and a dedicated component for performing version control especially when locking is enabled. The results generally showed no meaningful change for system load, and so any of the patterns can be used. For Bugzilla, the dedicated component was recommended to improve per-formance and the shared component to reduce resource consumption. This is based on our experience with Bugzilla which seems to suggest that bug trackers are very sensitive to increase workload especially if bugs are stored in the database with locking enabled. It was noticed that frequent crashes of the Bugzilla database occurred in our experiments which required recovery, and there were also numerous database errors related to restrictions on the maximum number of allowed queries, connections and packets, etc.
(C) Summary of the Effect of Performance and Resource Consumption on Multitenancy PatternsTo further enrich the case study synthesis we provide a condensed sum-mary to explain the effect of performance and resource
Table 9Recommended Patterns for optimal deployment of components
Case Studies Aspects of Isolation Parameters Shared Tenant-isolated Dedicated
Case Study 1- Continuous Integration with Hudson
Performance Response
Error%
Throughput
Resource Consumption
CPU
Memory
Disk I/O
System load - -
-Case Study 2- Version Control with File System SCM Plugin
Performance Res
Error
Thru
Resource Consumption
CPU
Memory
Disk I/O
System Load - -
-Case Study 3 - Bug Tracking with Bugzilla
Performance Resp
Error%
Throughput
Resource Consumption
CPU
Memory
Disk I/O

![Fig. 8 ResTime Changes [CS1]](https://thumb-us.123doks.com/thumbv2/123dok_us/848460.1582513/27.595.60.541.472.732/fig-restime-changes-cs.webp)
![Fig. 10 Throughput Changes [CS1]](https://thumb-us.123doks.com/thumbv2/123dok_us/848460.1582513/28.595.59.540.86.345/fig-throughput-changes-cs.webp)
