R E G U L A R A R T I C L E
Open Access
Instagram photos reveal predictive
markers of depression
Andrew G Reece
1*and Christopher M Danforth
2,3,4**Correspondence:
reece@g.harvard.edu; chris.danforth@uvm.edu
1Department of Psychology,
Harvard University, 33 Kirkland St, Cambridge, MA 02138, USA
2Computational Story Lab, Vermont
Advanced Computing Core, University of Vermont, 210 Colchester Ave, Burlington, VT 05405, USA
Full list of author information is available at the end of the article
Abstract
Using Instagram data from 166 individuals, we applied machine learning tools to successfully identify markers of depression. Statistical features were computationally extracted from 43,950 participant Instagram photos, using color analysis, metadata components, and algorithmic face detection. Resulting models outperformed general practitioners’ average unassisted diagnostic success rate for depression. These results held even when the analysis was restricted to posts made before depressed individuals were first diagnosed. Human ratings of photo attributes (happy, sad, etc.) were weaker predictors of depression, and were uncorrelated with
computationally-generated features. These results suggest new avenues for early screening and detection of mental illness.
Classification: psychological and cognitive sciences; computer science
Keywords: social media; depression; psychology; machine learning; computational social science
1 Introduction
The advent of social media presents a promising new opportunity for early detection and intervention in psychiatric disorders. Predictive screening methods have successfully an-alyzed online media to detect a number of harmful health conditions [–]. All of these studies relied on text analysis, however, and none have yet harnessed the wealth of psycho-logical data encoded invisualsocial media, such as photographs posted to Instagram. In this report, we introduce a methodology for analyzing photographic data from Instagram to predictively screen for depression.
There is good reason to prioritize research into Instagram analysis for health screening. Instagram members currently contribute almost million new posts per day [], and Instagram’s rate of new users joining has recently outpaced Twitter, YouTube, LinkedIn, and even Facebook []. A nascent literature on depression and Instagram use has so far either yielded results that are too general or too labor-intensive to be of practical signifi-cance for predictive analytics [, ]. In particular, Lup et al. [] only attempted to cor-relate Instagram usership with depressive symptoms, and Andalibi et al. [] employed a time-consuming qualitative coding method which the authors acknowledged made it ‘im-possible to qualitatively analyze’ Instagram data at scale (p.). In our research, we incorpo-rated an ensemble of computational methods from machine learning, image processing,
and other data-scientific disciplines to extract useful psychological indicators from pho-tographic data. Our goal was to successfully identify and predict markers of depression in Instagram users’ posted photographs.
Hypothesis Instagram posts made by individuals diagnosed with depression can be re-liably distinguished from posts made by healthy controls,using only measures extracted computationally from posted photos and associated metadata.
1.1 Photographic markers of depression
Photographs posted to Instagram offer a vast array of features that might be analyzed for psychological insight. The content of photographs can be coded for any number of characteristics: Are there people present? Is the setting in nature or indoors? Is it night or day? Image statistical properties can also be evaluated at a per-pixel level, including values for average color and brightness. Instagram metadata offers additional information: Did the photo receive any comments? How many ‘Likes’ did it get? Finally, platform activity measures, such as usage and posting frequency, may also yield clues as to an Instagram user’s mental state. We incorporated only a narrow subset of possible features into our predictive models, motivated in part by prior research into the relationship between mood and visual preferences.
In studies associating mood, color, and mental health, healthy individuals identified darker, grayer colors with negative mood, and generally preferred brighter, more vivid colors [–]. By contrast, depressed individuals were found to prefer darker, grayer col-ors []. In addition, Barrick, Taylor, & Correa [] found a positive correlation between self-identification with depression and a tendency to perceive one’s surroundings as gray or lacking in color. These findings motivated us to include measures of hue, saturation, and brightness in our analysis. We also tracked the use of Instagram filters, which allow users to modify the color and tint of a photograph.
Depression is strongly associated with reduced social activity [, ]. As Instagram is used to share personal experiences, it is reasonable to infer that posted photos with people in them may capture aspects of a user’s social life. On this premise, we used a face detection algorithm to analyze Instagram posts for the presence and number of human faces in each photograph. We also counted the number of comments and likes each post received as measures of community engagement, and used posting frequency as a metric for user engagement.
1.2 Early screening applications
Hypothesis Instagram posts made by depressed individuals prior to the date of first clinical diagnosis can be reliably distinguished from posts made by healthy controls.
If support is found for Hypothesis , this would not only demonstrate a methodological advance for researchers, but also serve as a proof-of-concept for future healthcare appli-cations. As such, we benchmarked the accuracy of our model against the ability of general practitioners to correctly diagnose depression as shown in a meta-analysis by Mitchell, Vaze, and Rao []. The authors analyzed studies that evaluated general practitioners’ abilities to correctly diagnose depression in their patients, without assistance from scales, questionnaires, or other measurement instruments. Out of , patient outcomes in-cluded across the pooled studies, .% were actually depressed, as evaluated separately by psychiatrists or validated interview-based measures conducted by researchers. General practitioners were able to correctly rule out depression in non-depressed patients % of the time, but only diagnosed depressed patients correctly % of the time. We refer to these meta-analysis findings [] as a comparison point to evaluate the usefulness of our models.
A major strength of our proposed models is that their features are generated using en-tirely computational means - pixel analysis, face detection, and metadata parsing - which can be done at scale, without additional human input. It seems natural to wonder whether these machine-extracted features pick up on similar signals that humans might use to iden-tify mood and psychological condition, or whether they attend to wholly different infor-mation. A computer may be able to analyze the average saturation value of a million pixels, but can it pick out a happy selfie from a sad one? Understanding whether machine learning and human opinion are sensitive to the same indicators of depression may be valuable in-formation for future research and applications. Furthermore, insight into these issues may help to frame our results in the larger discussion around human versus machine learning, which occupies a central role in the contemporary academic landscape.
To address these questions, we solicited human assessments of the Instagram pho-tographs we collected. We asked new participants to evaluate photos on four simple met-rics: happiness, sadness, interestingness, and likability. These ratings categories were in-tended to capture human impressions that were both intuitive and quantifiable, and which had some relationship to established depression indicators. DSM-IV [] criteria for Ma-jor Depressive Disorder includes feeling sad as a primary criterion, so sadness (and its anti-correlate, happiness) seemed obvious candidates as ratings categories. Epstein et al. [] found depressed individuals ‘had difficulty reconciling a self-image as an ‘outgoing likeable person’’, which prompted likability as an informative metric. We hypothesized that human raters should find photographs posted by depressed individuals to be sadder, less happy, and less likable, on average. Finally, we considered interestingness as a novel factor, without a clear directional hypothesis.
Hypothesis a Human ratings of Instagram posts on common semantic categories can distinguish between posts made by depressed and healthy individuals.
If human and machineapredictors show positive correlation, we can infer that each set of features tracks similar signals of depression. In this case, the strength of the human model simply suggests whether it is better or worse than the machine model. On the other hand, if machine and human features show little or no correlation, then regardless of human model performance, we would know that the machine features are capable of screening for depression, but use different information signals than what are captured by the affective ratings categories.
2 Method
2.1 Data Collection
Data collection was crowdsourced using Amazon’s Mechanical Turk (MTurk) crowdwork platform. Separate surveys were created for depressed and healthy individuals. In the de-pressed survey, participants were invited to complete a survey that involved passing a series of inclusion criteria, responding to a standardized clinical depression survey, an-swering questions related to demographics and history of depression, and sharing social media history. We used the CES-D (Center for Epidemiologic Studies Depression Scale) questionnaire to screen participant depression levels []. CES-D assessment quality has been demonstrated as on-par with other depression inventories, including the Beck De-pression Inventory and the Kellner Symptom Questionnaire [, ]. Healthy participants were screened to ensure no history of depression and active Instagram use. See Additional file for actual survey text.
Qualified participants were asked to share their Instagram usernames and history. An app embedded in the survey allowed participants to securely log into their Instagram ac-counts and agree to share their data.bUpon securing consent, we made a one-time col-lection of participants’ entire Instagram posting history. In total we collected , pho-tographs from Instagram users, of whom had a history of depression.
We asked a different set of MTurk crowdworkers to rate the Instagram photographs col-lected. This new task asked participants to rate a random selection of photos from the data we collected. Raters were asked to judge how interesting, likable, happy, and sad each photo seemed, on a continuous - scale. Each photo was rated by at least three differ-ent raters, and ratings were averaged across raters. Raters were not informed that photos were from Instagram, nor were they given any information about the study participants who provided the photos, including mental health status. Each ratings category showed good inter-rater agreement.
Only a subset of participant Instagram photos were rated (N= ,). We limited rat-ings data to a subset because this task was time-consuming for crowdworkers, and so proved a costly form of data collection. For the depressed sample, ratings were only made for photos posted within a year in either direction of the date of first depression diagnosis. Within this subset, for each user the nearest posts prior to the diagnosis date were rated. For the control population, the most recent photos from each user’s date of participation in this study were rated.
2.2 Participant safety and privacy
Figure 1 Comparison of HSV values. Right photograph has higher Hue (bluer), lower Saturation (grayer), and lower Brightness (darker) than left photograph. Instagram photos posted by depressed individuals had HSV values shifted towards those in the right photograph, compared with photos posted by healthy individuals.
of being personally identified, and assured them that no data with personal identifiers, including usernames, would be made public or published in any format.
2.3 Improving data quality
We employed several quality assurance measures in our data collection process to reduce noisy and unreliable data. Our surveys were only visible to MTurk crowdworkers who had completed at least previous tasks with a minimum % approval rating; MTurk work-ers with this level of experience and approval rating have been found to provide reliable, valid survey responses []. We also restricted access to only American IP addresses, as MTurk data collected from outside the United States are generally of poorer quality []. All participants were only permitted to take the survey once.
We excluded participants who had successfully completed our survey, but who had a lifetime total of fewer than five Instagram posts. We also excluded participants with CES-D scores of or higher. Studies have indicated that a CES-CES-D score of represents an optimal cutoff for identifying clinically relevant depression across a range of age groups and circumstances [, ].
2.4 Feature extraction
model. For the separate model fit on ratings data, we used only the four ratings categories (happy, sad, likable, interesting) as predictors.
2.5 Units of observation
In determining the best time span for this analysis, we encountered a difficult question: When and for how long does depression occur? A diagnosis of depression does not indi-cate the persistence of a depressive state for every moment of every day, and to conduct analysis using an individual’s entire posting history as a single unit of observation is there-fore rather specious. At the other extreme, to take each individual photograph as units of observation runs the risk of being too granular. De Choudhury et al. [] looked at all of a given user’s posts in a single day, and aggregated those data into per-person, per-day units of observation. We adopted this precedent of ‘user-days’ as a unit of analysis.c
2.6 Statistical framework
We used Bayesian logistic regression with uninformative priors to determine the strength of individual predictors. Two separate models were trained. The All-data model used all collected data to address Hypothesis . The Pre-diagnosis model used all data collected from healthy participants, but only pre-diagnosis data from depressed participants, to address Hypothesis . We also fit an ‘intercept-only’ model, in which all predictors are zero-weighted to simulate a model under a null hypothesis. Bayes factors were used to assess model fit. Details on Bayesian estimation, model optimization and selection, and diagnostic checks are available in Additional file .
We also employed a suite of supervised machine learning algorithms to estimate the pre-dictive capacity of our models. We report prediction results only from the best-performing algorithm, a -tree Random Forests classifier. As an informal benchmark for com-parison, we present general practitioners’ unassisted diagnostic accuracy as reported in Mitchell, Vaze, and Rao [].d
In evaluating binary classification accuracy, a simple proportion of correct classifications is often inappropriate. In cases where data exhibit a class imbalance, i.e. more healthy than depressed observations (or vice-versa), reporting naive accuracy can be misleading. (A classification accuracy of % seems excellent until it is revealed that % of the data modeled belong to a single class.) Additionally, naive accuracy scores are opaque to the specific strengths and weaknesses of a binary classifier. Instead, we report precision, recall, specificity, negative predictive value, and F scores for fuller context. Definitions for these terms are as follows:
Precision TP/(TP + FP)
Recall TP/(TP + FN)
Specificity TN/(TN + FP) Negative Predictive Value TN/(TN + FN)
F ∗(Precision∗Recall)/(Precision + Recall) TP = True Positive FP = False Positive TN = True Negative FN = False Negative
3 Results
Figure 2 Magnitude and direction of regression coefficients in All-data (N= 24,713) and Pre-diagnosis (N= 18,513) models. X-axis values represent the adjustment in odds of an observation belonging to the target class, per unit increase of each predictive variable. Odds were generated by exponentiating logistic regression log-odds coefficients.
Figure 3 Instagram filter usage among depressed and healthy participants. Bars indicate difference between observed and expected usage frequencies, based on a Chi-squared analysis of independence. Blue bars indicate disproportionate use of a filter by depressed compared to healthy participants, orange bars indicate the reverse. All-data results are displayed, see Additional file 1 for Pre-diagnosis plot.
confidence, and Pre-diagnosis posting frequency dropped to % confidence, suggesting a null predictive value in the latter case.
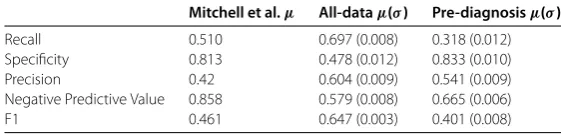
Table 1 Comparison of accuracy metrics for All-data and Pre-diagnosis model predictions
Mitchell et al.μ All-dataμ(σ) Pre-diagnosisμ(σ)
Recall 0.510 0.697 (0.008) 0.318 (0.012) Specificity 0.813 0.478 (0.012) 0.833 (0.010) Precision 0.42 0.604 (0.009) 0.541 (0.009) Negative Predictive Value 0.858 0.579 (0.008) 0.665 (0.006)
F1 0.461 0.647 (0.003) 0.401 (0.008)
General practitioners’ diagnostic accuracy from (Mitchell et al. [24]) is included for comparison. See see Additional file 1 for definitions of accuracy metrics.
A closer look at filter usage in depressed versus healthy participants provided additional texture. Instagram filters were used differently by target and control groups (χall= .,
p= .×–;χ
pre= .,p= .×–). In particular, depressed participants were less likely than healthy controls to use any filters at all. When depressed participants did employ filters, they most disproportionately favored the ‘Inkwell’ filter, which converts color photographs to black-and-white images (see Figure ). Conversely, healthy partici-pants most disproportionately favored the Valencia filter, which lightens the tint of photos. Examples of filtered photographs are provided in Additional file .
Our best All-data machine learning classifier, averaged over five randomized iterations, improved over Mitchell et al. [] general practitioner accuracy on most metrics (see Ta-ble ). Compared with Mitchell et al. [] results, the All-data model was less conservative (lower specificity) but better able to positively identify target class observations (higher re-call). Given observations, our model correctly identified % of all target class cases (n= ), with a relatively low number of false alarms (n= ) and misses (n= ).
Pre-diagnosis predictions showed improvement over the Mitchell et al. [] benchmark on precision and specificity. The Pre-diagnosis model found only about a third of actual target class observations, but it was correct most of the time when it did predict a target class label. By comparison, although Mitchell et al. [] general practitioners discovered more true cases of depression, they were more likely than not to misdiagnose healthy sub-jects as depressed.
Out of the four predictors used in the human ratings model (happiness, sadness, likabil-ity, interestingness), only the sadness and happiness ratings were significant predictors of depression. Depressed participants’ photos were more likely to be sadder and less happy than those of healthy participants. Ratings assessments generally showed strong patterns of correlation with one another, but exhibited extremely low correlation with computa-tional features. The modest positive correlation of human-rated happiness with the pres-ence and number of faces in a photograph was the only exception to this trend. Correlation matrices for all models are available in Additional file .
4 Discussion
media data are amenable to analysis of affect using scalable, computational methods. One avenue for future research might integrate textual analysis of Instagram posts’ comments, captions, and tags. Considering the early success of textual analysis in detecting various health and psychological signals on social media [, , ], the modeling of textual and visual features together could well prove superior to either medium on its own.
Our model showed considerable improvement over the ability of unassisted general practitioners to correctly diagnose depression. On average, more than half of general prac-titioners’ depression diagnoses were false positives []. By comparison, the majority of both All-data and Pre-diagnosis depression classifications were correct. As false diagnoses are costly for both healthcare programs and individuals, this improvement is noteworthy. Health care providers may be able to improve quality of care and better identify individ-uals in need of treatment based on the simple, low-cost methods outlined in this report. Given that mental health services are unavailable or underfunded in many countries [], this computational approach, requiring only patients’ digital consent to share their social media histories, may open avenues to care which are currently difficult or impossible to provide.
On the other hand, our Pre-diagnosis prediction engine was rather conservative, and tended to classify most observations as healthy. There is good reason to believe, however, that the Pre-diagnosis prediction accuracy observed represents a lower bound on perfor-mance. Ideally, we would have used the All-data classifier to evaluate the Pre-diagnosis data, as that model was trained on a much larger dataset. The fact that the Pre-diagnosis data was a subset of the full dataset meant that applying the All-data model to Pre-diagnosis observations would have artificially inflated accuracy, due to information leak-age between training and test data. Instead, we trained a new classifier for Pre-diagnosis, using training and test partitions contained within the Pre-diagnosis data, which left the Pre-diagnosis model with considerably fewer data points to train on. As a result, it is likely that Pre-diagnosis accuracy scores understate the technique’s true capacity.
Regarding the strength of specific predictive features, some results match common per-ceptions regarding the effects of depression on behavior. Photos posted to Instagram by depressed individuals were more likely to be bluer, grayer, and darker, and receive fewer likes. Depressed Instagram users in our sample had an outsized preference for filtering out all color from posted photos, and showed an aversion to artificially lightening pho-tos, compared to non-depressed controls. These results matched well with the literature linking depression and a preference for darker, bluer, and monochromatic colors [–]. Depressed users were more likely to post photos with faces, but they tended to post fewer faces per photo. This finding may be an oblique indicator that depressed users interact in smaller social settings, or at least choose only to share experiences of this sort on social media. This would be in accordance with previous findings that reduced social interactiv-ity is an indicator of depression [, , ].
A general limitation to these findings concerns the non-specific use of the term ‘depres-sion’ in the data collection process. We acknowledge that depression describes a general clinical status, and is frequently comorbid with other conditions. It is possible that a spe-cific diagnostic class is responsible for driving the observed results, and future research should fine-tune questionnaires to acquire specific diagnostic information. Additionally, it is possible that our results are in some way specific to individuals who received clin-ical diagnoses. Current perspectives on depression treatment indicate that people who are ‘well-informed and psychologically minded, experience typical symptoms of depres-sion and little stigma, and have confidence in the effectiveness of treatment, few concerns about side effects, adequate social support, and high self-efficacy’ seek out mental health services []. The intersection of these qualities with typical Instagram user demographics suggests caution in making broad inferences, based on our findings.
As these methods provide a tool for inferring personal information about individuals, two points of caution should be considered. First, data privacy and ethical research prac-tices are of particular concern, given recent admissions that individuals’ social media data were experimentally manipulated or exposed without permission [, ]. It is perhaps reflective of a current general skepticism towards social media research that, of the individuals who began our survey, (%) refused to share their Instagram data, even after we provided numerous privacy guarantees. Future research should prioritize estab-lishing confidence among experimental participants that their data will remain secure and private. Second, data trends often change over time, leading socio-technical models of this sort to degrade without frequent calibration []. The findings reported here should not be taken as enduring facts, but rather as promising leads upon which to build and refine subsequent models.
Paired with a commensurate focus on upholding data privacy and ethical analytics, the present work may serve as a blueprint for effective mental health screening in an increas-ingly digitalized society. More generally, these findings support the notion that major changes in individual psychology are transmitted in social media use, and can be iden-tified via computational methods.
Additional material
Additional file 1: Supplementary materials.(pdf )
Acknowledgements
The authors thank K Lix for conversations and manuscript review.
Funding
CMD acknowledges funding from the National Science Foundation under Grant No. IIS-1447634. AGR acknowledges support from the Sackler Scholar Programme in Psychobiology.
Availability of data and materials
Code associated with this study is available publicly on the github page of AGR: https://github.com/andrewreece/predicthealth.
Ethics approval and consent to participate
This study was reviewed and approved by the Harvard University Institutional Review Board, approval #15-2529 and by the University of Vermont Institutional Review Board, approval #CHRMS-16-135.
Competing interests
Consent for publication
N/A
Authors’ contributions
AGR and CMD designed the study. AGR performed the study and analyzed results. AGR and CMD authored the manuscript.
Author details
1Department of Psychology, Harvard University, 33 Kirkland St, Cambridge, MA 02138, USA.2Computational Story Lab,
Vermont Advanced Computing Core, University of Vermont, 210 Colchester Ave, Burlington, VT 05405, USA.
3Department of Mathematics and Statistics, University of Vermont, 210 Colchester Ave, Burlington, VT 05405, USA. 4Vermont Complex Systems Center, University of Vermont, 210 Colchester Ave, Burlington, VT 05405, USA.
Endnotes
a The term ‘machine’ (e.g. ‘machine predictors’, ‘machine model’) is used as shorthand for the computational feature
extraction process we employed. Significant human biases informed this process, however, as the initial selection of features for extraction involved entirely human decision-making.
b Data collection source code is available on Github, see Additional file 1.
c Occasionally, when reporting results we refer to ‘observations’ as ‘participants’, e.g. ‘depressed participants received
fewer likes’. It would be more correct to use the phrase ‘photographic data aggregated by participant-user-days’ instead of ‘participants’. We chose to sacrifice a degree of technical correctness for the sake of clarity.
d Comparing point estimates of accuracy metrics is not a statistically robust means of model comparison. However,
we felt it was more meaningful to frame our findings in a realistic context, rather than to benchmark against a naive statistical model that simply predicted the majority class for all observations.
Publisher’s Note
Springer Nature remains neutral with regard to jurisdictional claims in published maps and institutional affiliations.
Received: 28 March 2017 Accepted: 22 June 2017
References
1. Moreno M, Christakis D, Egan K, Brockman L, Becker T (2012) Associations between displayed alcohol references on Facebook and problem drinking among college students. Arch Pediatr Adolesc Med 166(2):157-163.
doi:10.1001/archpediatrics.2011.180
2. De Choudhury M, Counts S, Horvitz E (2013) Predicting postpartum changes in emotion and behavior via social media. In: Proceedings of the SIGCHI conference on human factors in computing systems. ACM, New York, pp 3267-3276. doi:10.1145/2470654.2466447
3. De Choudhury M, Counts S, Horvitz EJ, Hoff A (2014) Characterizing and predicting postpartum depression from shared Facebook data. In: Proceedings of the 17th ACM conference on computer supported cooperative work & social computing, ACM, New York, pp 626-638. doi:10.1145/2531602.2531675
4. De Choudhury M, Gamon M, Counts S, Horvitz E (2013) Predicting depression via social media. In: Seventh international AAAI conference on weblogs and social media
5. Katikalapudi R, Chellappan S, Montgomery F, Wunsch D, Lutzen K (2012) Associating Internet usage with depressive behavior among college students. IEEE Technol Soc Mag 31(4):73-80. doi:10.1109/MTS.2012.2225462
6. Moreno MA, Jelenchick LA, Egan KG, Cox E, Young H, Gannon KE, Becker T (2011) Feeling bad on Facebook: depression disclosures by college students on a social networking site. Depress Anxiety 28(6):447-455. doi:10.1002/da.20805
7. Coppersmith G, Harman C, Dredze M (2014) Measuring post traumatic stress disorder in Twitter. In: Eighth international AAAI conference on weblogs and social media
8. De Choudhury M, Kiciman E, Dredze M, Coppersmith G, Kumar M (2016) Discovering shifts to suicidal ideation from mental health content in social media. In: Proceedings of the 2016 CHI conference on human factors in computing systems. ACM, New York, pp 2098-2110. doi:10.1145/2858036.2858207
9. Christakis NA, Fowler JH (2010) Social network sensors for early detection of contagious outbreaks. PLoS ONE 5(9):e12948. doi:10.1371/journal.pone.0012948
10. Schmidt CW (2012) Trending now: using social media to predict and track disease outbreaks. Environ Health Perspect 120(1):a30-a33. doi:10.1289/ehp.120-a30
11. Paparrizos J, White RW, Horvitz E (2016) Screening for pancreatic adenocarcinoma using signals from web search logs: feasibility study and results J Oncol Pract 12(8):737-744. doi:10.1200/JOP.2015.010504
12. Instagram (2016) Instagram press release. Available at https://www.instagram.com/press/. Accessed July 26, 2016 13. Chaffey D (2016) Global social media research summary 2016. Available at bit.ly/1WRviEI. Accessed July 19, 2016 14. Lup K, Trub L, Rosenthal L (2015) Instagram #Instasad?: exploring associations among Instagram use, depressive
symptoms, negative social comparison, and strangers followed. Cyberpsychol Behav 18(5):247-252. doi:10.1089/cyber.2014.0560
15. Andalibi N, Ozturk P, Forte A (2015) Depression-related imagery on Instagram. In: Proceedings of the 18th ACM conference companion on computer supported cooperative work & social computing, ACM, New York, pp 231-234. doi:10.1145/2685553.2699014
16. Boyatzis CJ, Varghese R (1994) Children’s emotional associations with colors. J Genet Psychol 155(1):77-85 17. Carruthers HR, Morris J, Tarrier N, Whorwell PJ (2010) The Manchester Color Wheel: development of a novel way of
18. Hemphill M (1996) A note on adults’ color-emotion associations. J Genet Psychol 157(3):275-280
19. Barrick CB, Taylor D, Correa EI (2002) Color sensitivity and mood disorders: biology or metaphor? J Affect Disord 68(1):67-71. doi:10.1016/S0165-0327(00)00358-X
20. American Psychiatric Association (2000) Diagnostic and statistical manual of mental disorders, 4th edn. doi:10.1176/appi.books.9780890423349
21. Bruce ML, Hoff RA (1994) Social and physical health risk factors for first-onset major depressive disorder in a community sample. Soc Psychiatry Psychiatr Epidemiol 29(4):165-171. doi:10.1007/BF00802013
22. Cornford CS, Hill A, Reilly J (2007) How patients with depressive symptoms view their condition: a qualitative study. Fam Pract 24(4):358-364. doi:10.1093/fampra/cmm032
23. Karp DA (1994) Living with depression: illness and identity turning points. Qual Health Res 4(1):6-30. doi:10.1177/104973239400400102
24. Mitchell AJ, Vaze A, Rao S (2009) Clinical diagnosis of depression in primary care: a meta-analysis. Lancet 374(9690):609-619. doi:10.1016/S0140-6736(09)60879-5
25. Epstein RM, Duberstein PR, Feldman MD, Rochlen AB, Bell RA, Kravitz RL et al (2010) ‘I didn’t know what was wrong:’ how people with undiagnosed depression recognize, name and explain their distress. J Gen Intern Med 25(9):954-961. doi:10.1007/s11606-010-1367-0
26. Radloff LS (1977) The CES-D scale: a self-report depression scale for research in the general population. Appl Psych Manage 1(3):385-401. doi:10.1177/014662167700100306
27. Fountoulakis KN, Bech P, Panagiotidis P, Siamouli M, Kantartzis S, Papadopoulou A et al (2007) Comparison of depressive indices: reliability, validity, relationship to anxiety and personality and the role of age and life events. J Affect Disord 97(1-3):187-195. doi:10.1016/j.jad.2006.06.015
28. Zich JM, Attkisson CC, Greenfield TK (1990) Screening for depression in primary care clinics: the CES-D and the BDI. Int J Psychiatry Med 20(3):259-277. doi:10.2190/LYKR-7VHP-YJEM-MKM2
29. Peer E, Vosgerau J, Acquisti A (2013) Reputation as a sufficient condition for data quality on Amazon Mechanical Turk. Behav Res Methods 46(4):1023-1031. doi:10.3758/s13428-013-0434-y
30. Litman L, Robinson J, Rosenzweig C (2014) The relationship between motivation, monetary compensation, and data quality among US- and India-based workers on Mechanical Turk. Behav Res Methods 47(2):519-528.
doi:10.3758/s13428-014-0483-x
31. Cuijpers P, Boluijt B, van Straten A (2007) Screening of depression in adolescents through the Internet. Eur Child Adolesc Psychiatry 17(1):32-38. doi:10.1007/s00787-007-0631-2
32. Haringsma R, Engels GI, Beekman ATF, Spinhoven P (2004) The criterion validity of the center for epidemiological studies depression scale (CES-D) in a sample of self-referred elders with depressive symptomatology. Int J Geriatr Psychiatry 19(6):558-563. doi:10.1002/gps.1130
33. Dodds PS, Harris KD, Kloumann IM, Bliss CA, Danforth CM (2011) Temporal patterns of happiness and information in a global social network: hedonometrics and Twitter. PLoS ONE 6(12):e26752. doi:10.1371/journal.pone.0026752 34. Reece AG, Reagan AJ, Lix KLM, Dodds PS, Danforth CM, Langer EJ (2016) Forecasting the onset and course of mental
illness with Twitter data. arXiv:1608.07740
35. Detels R (2009) The scope and concerns of public health. Oxford University Press, London
36. Fiske ST, Hauser RM (2014) Protecting human research participants in the age of big data. Proc Natl Acad Sci USA 111(38):13675-13676. doi:10.1073/pnas.1414626111
37. Lumb D (2016) Scientists release personal data for 70,000 OkCupid profiles. Available at engt.co/2b4NnQ0. Accessed August 7, 2016
38. Lazer D, Kennedy R, King G, Vespignani A (2014) The parable of Google flu: traps in big data analysis. Science 343(6176):1203-1205. doi:10.1126/science.1248506
39. Gigerenzer G (2004) Mindless statistics. J Socio-Econ 33(5):587-606. doi:10.1016/j.socec.2004.09.03
40. Hubbard R, Lindsay RM (2008) Why p-values are not a useful measure of evidence in statistical significance testing. Theory Psychol 18(1):69-88. doi:10.1177/0959354307086923
41. Morey RD, Hoekstra R, Rouder JN, Lee MD, Wagenmakers EJ (2015) The fallacy of placing confidence in confidence intervals. Psychon Bull Rev 23(1):103-123. doi:10.3758/s13423-015-0947-8
42. Wasserstein RL, Lazar NA (2016) The ASA’s statement on p-values: context, process, and purpose. Am Stat 70(2):129-133. doi:10.1080/00031305.2016.1154108
43. Martin A, Quinn K, Park JH (2011) MCMCpack: Markov chain Monte Carlo in R. J Stat Softw 42(9):1-21 44. Link WA, Eaton MJ (2012) On thinning of chains in MCMC. Methods Ecol Evol 3(1):112-115.
doi:10.1111/j.2041-210X.2011.00131.x
45. Christensen R, Johnson W, Branscum A, Hanson TE (2011) Bayesian ideas and data analysis: an introduction for scientists and statisticians. CRC Press, Boca Raton
46. Jeffries H (1961) Theory of probability. Clarendon, Oxford
47. Geweke J (1992) Evaluating the accuracy of sampling-based approaches to the calculation of posterior moments. Vol. 196. Federal Reserve Bank of Minneapolis, Research Department, Minneapolis