R E S E A R C H
Open Access
Efficient resource allocation and
dimensioning of media edge clouds
infrastructure
Abdallah Jarray
*, Ahmed Karmouch, Javier Salazar, Jocelyne Elias, Ahmed Mehaoua and Faisal Zaman
Abstract
Media Edge Cloud Data Centers (MEC-DCs) that are interconnected by a Metro Network were selected as infrastructure to enhance the Quality of Experience (QoE) for end users of multimedia applications. Unlike the traditional Data Centers, MEC-DCs, which are kept closer to the user, have limited availability of resources at a given Data Center. Therefore, it is of paramount importance for Infrastructure service providers to efficiently dimension and use the media resources in an environment where the applications have high resource demand and the infrastructure has limited availability. To perform this task dynamically, we first propose a resource allocation strategy that considers the physical characteristics of the networking layer while minimizing the costs of deploying media applications. Second, we analyze the different configurations of the networking layer in order to enhance the use of MEC-DCs resources and the QoE for the end-users. Simulation results show a clear advantage of this proposed
optimization-based approach over the benchmarks in terms of provisioning costs, blocking ratio and resource use.
Keywords: Media cloud service, Media edge data center, Resource allocation, Cloud provider, Optical network, Linear programming, Column generation
Introduction
The evolution in network technologies is changing the way in which communications are designed. With the development of Web 2.0 that supports multimedia appli-cations, customer expectations of rich media provisioning have increased. Media applications are becoming essen-tial to our everyday life [1]; their popularity is increasing both because of the spread of social networks and the ease with which they can share audio, videos, and streaming services.
Media applications can vary from video sharing (such as YouTube and Netflix), to online radio (Spotify) or image sharing (Pinterest). Most of these services demand a significant amount of media processing and have strin-gent Quality of Service (QoS) requirements [2]. This is particularly the case with User Generated Content (UGC), with its huge volume of short videos and its significantly fluctuating user demand. Cloud computing is
*Correspondence: [email protected]
University of Ottawa, School of Electrical Engineering and Computer Science, Ottawa, Ontario, Canada
gaining enormous momentum as a cost-efficient solution for providing media services with storage and processing requirements [3]. Large-scale public clouds that offer their computing, storage, and network resources in the form of Infrastructure-as-a-Service (IaaS) have attracted Cloud Service Providers (CPs) [4–6].
A current area of rapid innovation is the use of Media Edge Cloud Data Centers (MEC-DCs) using several hun-dred servers [7, 8]. This MEC model allows CPs to reduce their capital costs and to benefit from the elasticity of the cloud by placing Virtual Machines (VM) running media processing tasks closer to the end-users.
The Edge Cloud infrastructure uses smaller DCs located in the last mile, closer to major population centers, in order to honor Service Level Agreement (SLA) contracts for the QoS requirements of highly interactive content delivery: online searching (such as Google), social net-working (such as Facebook), video streaming, and so on [8]. This requires a topology located in the metropolitan area that can transfer media data among DC locations. Metro optical fiber networks have been investigated as the best way to guarantee an efficient data transport
service among MEC-DC locations [9]. Metro optical net-works can indeed transport large files with short time delays, making for a suitable architecture for applications where avoiding delay is critical, such as on-line gam-ing, video streaming and image sharing. Advancements in optical communication have enabled the grooming of low-granularity traffic using optical Multi-service Provi-sioning Platform (MSPP) transponders [10]. Examples are the media applications in social networks, often in the form of small files like profile pictures or short videos.
To ensure the SLA of the hosted applications, it is important that the cloud substrate resources and the link latency constraints are satisfied. The presence of MEC-DCs closer to the user gives service providers two advan-tages over traditional DCs,(a)a reduction in the cost/bit, and (b) an increased performance and throughput of the application. On the other hand, compared to tradi-tional DC networks, MEC-DCs have limited resources at a given site. Smart site selection is important in order to ensure both QoS and a minimum cost for the CPs. It is our belief that overall substrate resource use is improved if the incoming media cloud request is mapped to the MEC-DCs simultaneously for both its networking and computing requirements. Our approach, proposed in “Media edge cloud resource allocation approach” section, has two crucial improvements over related works in the literature [11–20, 20]. The first improvement is a resource allocation strategy that uses the physical characteristics of the networking layer to reduce the deployment cost. The strategy, referred to as L-CG-MEC, uses Column Generation as a large-scale optimization technique for mapping media cloud requests to the MEC-DCs. L-CG-MEC defines a media cloud request as a Virtual Network (VN); a set of nodes and a set of links with QoS require-ments. The second improvement is to evaluate different networking configurations so as to determine which can provide better QoS.
The remainder of this paper is organized as fol-lows. “Related works” section describes other work related to our proposal. “Media cloud computing” section defines the MEC-DCs resources allocation problem. “Media edge cloud resource allocation approach” section presents the mapping solution of media cloud requests into MEC-DCs infrastructure. “Numerical results” section introduces benchmarks and simulation results to evaluate performance. “Conclusion” section concludes the paper.
Related works
The literature contains a number of approaches to effi-ciently solving the challenges of media cloud requests mapping. This can be defined as mapping a set of incom-ing media cloud requests on the MEC-DCs infrastructure so as to enhance goals such as reducing cost, increasing profit, or network use. It is important to ensure that the
QoS constraints of the incoming requests are satisfied. The challenges mainly result from the increased com-putational complexity when media cloud computing and the requirements of networking resources are considered jointly.
To overcome these issues, proposals in the literature have considered either relaxing networking QoS by focus-ing only on the computfocus-ing requirements [11, 13] or adopting a two-phase approach [14, 15, 18], which first pre-selects the mapping of hosting nodes and then maps virtual links.
The authors in [11] present a Bin-packing approach that dynamically maps Virtual Machines (VMs) into Physical Machines (PMs). As a result, networking requirements are not considered in the optimization model, which may mean that QoS requirements are not met.
In [12], the authors introduce an optimization algo-rithm based on a multi-objective formulation that opti-mizes the power used as well as the load balancing among DC servers. But the cost of networking equipment is not considered. The model therefore lacks a realis-tic evaluation of the economic benefits of cloud service requests and could also result in QoS requirements not being met.
In [13], the proposal is for two cloud VN embedding approaches using an optical network. The author’s focus is to minimize the power and spectrum used. The proposal does not detail the dimensioning of the optical layer and the impact of networking parameters on the quality of the services offered. The parameters of the optical networking layer are likewise not considered.
In [14], the authors use a two-phase mapping approach, which first preselects the mapping of hosting nodes and then maps virtual links. Node mapping and link mapping are performed independently. Hence, non-join node and link embedding may result in a high number of blocked requests and in underused resources, meaning less profit for the cloud provider. In addition, the mapping is done using heuristic approaches, which may make the solution less than optimal.
The authors in [15] propose a mathematical program-ming scheme in order to coordinate node and link mapping. The proposal handles online Virtual Network requests and introduces a better correlation between vir-tual node and virvir-tual link embedding phases. However, the solution seems less satisfactory than simultaneous mapping.
The authors of [19] study a joint optimization model that is geographically distributed and interconnected using an optical network. However, the resource alloca-tion applies more to a general IaaS request model. The impact of the networking layer on a higher QoS received much less attention.
The proposal in [20] is possibly the closest to our work. The light-trial approach adapts well for multi-casting applications. The proposal also considers the character-istics of the optical layer. However, the authors do not analyze the impact of the networking layer on the QoS for media cloud applications and their resource allocation proposal is better suited to general IaaS requirements.
In [21], the authors propose a next-generation, ubiq-uitous, converged infrastructure. The proposal connects fixed and mobile end users with Data Centers through a heterogeneous, network-integrating optical metro net-work, based on time-shared network technology and wireless access. The approach ensures allocation of the required resources across all technology domains to sup-port their specific characteristics such as end users’ mobility.
In [22], the authors provide a VN planning scheme with the development of Wavelength Division Multiplexing (WDM) techniques and cloud computing. The approach uses a united virtualization of optical and server resources that collaboratively incorporates the optical backbone into Data Centers. The authors demonstrate the effectiveness of their strategy in the context of power outages and evolving recovery.
In [23], the authors use compressive sensing (CS) tech-niques to support scalable service provisioning in con-verged optical/wireless clouds. They claim that the CS techniques achieve optimal service provisioning with significantly reduced control and less computational complexity.
In [24], the authors use a column generation approach for the VN embedding. Their focus is on ensuring resiliency for the accepted VN requests. The network is formed by interconnected, geo-distributed DCs that are not limited by their computing resources. In this paper, the network topology is composed of Edge DCs with limited resources. As a result, the focus of our work is on ensuring QoS even with those limited resources.
In [25], the authors propose a VN embedding approach on a wireless optical network. Incoming VN requests are mapped to a local Wireless Mesh Network (WMN) so as to reduce the transmission power. If a request is not satisfied by the WMN, it is mapped to the Optical Edge Network. The main constraints, however, are the computational power and the wavelength availability. In addition, the modeling ignored several optical network attributes such as node grooming capacity and different
optical architectures. In our work, we consider the opti-cal network characteristics in order to make an informed decision on the VNs’ mapping location and the availability of DC resource.
In [26], the authors propose an approach to determine the risk associated with a given Virtual Machine using threat and vulnerability factors. These factors identify which incoming VN requests can be risky. The main deci-sion on the location of VM is governed by how risky the VN requests are. In our work, by contrast, the decision is based on the characteristics and performance of the network.
Most of these works had the following common fea-tures: (1) the use of two-phase VN mapping, (2) the general Infrastructure as a Service (IaaS) requirements, and (3) the mapping of VN request one at a time (i.e., online). Our proposal differs as follows: (1) for each accepted media cloud request, we calculate the optimal one-shot networking and hosting scheme with respect to QoS requirements (latency, bandwidth, computing, and mapping location). This guarantees a better use of MEC-DCs resources and an increased number of accepted VN requests, (2) media cloud requests are served by batch (see “Small-batch MEC mapping” section) which allows us to calculate a better mapping solution over time.
Media cloud computing Media edge cloud architecture
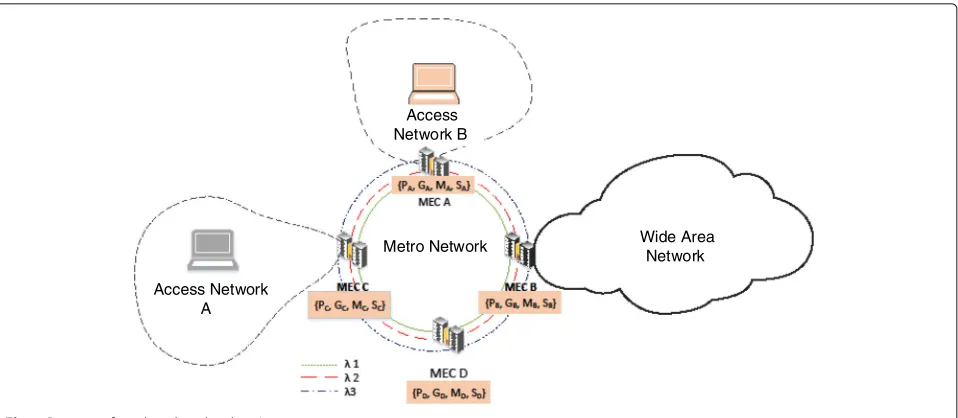
Two classes of DC-based cloud architecture can be iden-tified. They are (1) large, geographically distributed DCs, and (2) MEC-DCs as shown in Fig. 1. Large DCs are centralized and highly manageable, thereby providing an economy of scale. However, geographically distributed DCs have inherent limitations in service hosting. Sim-ple economic factors determine that they are built only in locations where capital and operational costs are low. Large DCs are therefore generally located far from end-users. This may result in failed QoS requirements (such as latency and bandwidth/throughput) as well as higher networking costs. To address these drawbacks, Edge DCs (such as Micro-DCs and Edge Cloud) have been proposed. This new class of small-scale DCs, known as MEC-DCs, is well suited to service hosting. In MEC architecture, media content and processing are pushed to the edge of the cloud based on user profile.
Networking transport architecture
Metro Network Wide Area Network
Access Network A
Access Network B
Fig. 1Position of media edge clouds in Internet
MSPP transponders. We provide details in the following sections on the transport architecture.
Light-Path transport architecture
Data flows among MEC-DC locations are transported using a set of light-paths built on wavelengths available on each fiber link that interconnects MEC locations. A light-path is an optical routing light-path that allows communication between the set of nodes along the path. A light-path uses only one wavelength between its end-nodes. A Multi-service Provisioning Access Platform (MSPP) transponder is used to add signals to or drop them from a wavelength at a given MEC-DC node.
Add/Drop media request in edge cloud node
A Multi-Service Provisioning Platform (MSPP) fabric is set up in each node of the interconnecting MEC-DC locations. MSPPs allow data flow to be added to or dropped from network transport signals according to traf-fic demand. Apart from the conventional SONET signals, MSPPs handle a wide variety of client signals (Gigabit Ethernet, ATM, IP, and so on). Furthermore, the MSPP equipment is modular and can be configured by select-ing the component appropriate for the desired network-ing task for a given node [10]. Of these components, transponders, the interfaces between the optical and the electrical domains, make up the main element of cost on a MSPP fabric. MSPP transponders are used to add/drop and groom low-client signals into wavelengths.
Media edge cloud resource allocation approach Resource allocation is one of the most important aspects of MEC-DCs management, since it is directly related to the cost and the QoS requirements of media cloud
services. Efficient resource allocation has a positive impact on the service provider’s profitability. The resource allocation problem is to minimize hosting and networking costs while preserving QoS constraints. The QoS require-ments are: (1) Specific data transfer capacity with a short latency, (2) Pre-defined computing and graphic processing capacities, (3) Storage and memory capacity, and (4) Spe-cific processing order of each task to compose the media cloud request. MEC-DCs Resources are allocated to the incoming media cloud requests in a batch-wise fashion, as described in the following section.
Small-batch MEC mapping
In a realistic scenario, media cloud requests usually do not arrive one after another at regular time intervals [15]. A realistic mapping scenario of MEC requests may therefore involve an approach, in which MEC requests are queued and then processed in small batches in order to opti-mize costs for the MEC provider over time [17]. To do so, we divide the mapping planning time into a set of consecutive short periods (windows) and we describe the demand with a set of MEC requests, one for each new win-dow. From one period to the next, we assume that most MEC requests remain the same, representing as an exam-ple the global steady-state of the long-term Service Level Agreement (SLA) between the provider and its customers. The change in demand can therefore be measured with a turnover rate, such as 20% of incoming (new) and 30% of leaving (drop or ending) requests. Expressed more pre-cisely, letPbe the set of mapping planning periods of time andM(0)the initial set of MEC requests. The set of MEC requestsM(p)indexed byp≥1 is defined as:
WhereM(p−1)is the set of accepted MEC requests at the end of periodp−1.MNEW(p)is the set of new incom-ing and MDROP(p) is the set of ending MEC requests at the start of periodp. WhereNEWandDROPare randomly selected between 10 and 40%, giving us a range of cases from slowly fluctuating (10%) to quickly changing (40%) of MEC demand.
Mathematical modeling
To evaluate the merits of the allocation approach of MEC-DCs resources, we propose a mathematical formulation as follows.
The MEC-DCs infrastructure is represented by a directed graphGm = (Hm,Em), whereHm is the set of
MEC-DCs locations, and Em is the set of optical fiber
links. The network topology is composed of either a Uni-directional Path Switching Ring (UPSR), consisting of one optical directional fiber, or a Bidirectional Path Switch-ing RSwitch-ing (BLSR), consistSwitch-ing of two fibers, one in each direction.
End-to-end delay between two MEC-DC nodes is also impacted by the number of MSPP transponders used in the light-path. Figure 1 shows an example of MEC-DCs, where each physical optical link e ∈ Em between two
MEC-DC locations offersW wavelengths, each of which has a bandwidth capacityB. We define a light-pathlas a set of consecutive optical links. We denote byLthe set of light-paths available to serve the networking require-ments of media cloud requests Mn,n ∈ N. Candidate
light-paths can be calculated using a K-shortest path algo-rithm [27] for all couples of MEC-DC locations that are connected using optical WDM links. Either ring or mesh topologies can be used in calculating the paths. The ring topology is evaluated in “Numerical results” section. It is considered because most current metro topologies are ring-based and still favored over mesh topologies because of their inherent simplicity of design and low OPEX.
Client signals can be added and dropped on any MEC-DC hosting nodeuusing MSPP transponders NMSPP(u). In addition, each MEC-DC hosting nodeu ∈ Hm offers
a Compute Processing Unit (CPU) capacityPu, a Graphic
Processing Unit (GPU) capacity Gu, a memory capacity Mu, and a storage capacitySu. Table 1 shows the generic
description of these parameters.
Similarly, a media cloud request is divisible into a set of interdependent atomic tasks modeled as a weighted, undi-rected Task Dependencies Graph (TDG)Mn = (Tn,An),
where n ∈ N = {1, 2,. . .,|N|}. Tn denotes the set of
Tasks and An the set of directional virtual networking
links between tasks that form media cloud requestMn.
Figure 2 shows an example of a TDG graph. A media cloud request could be, for example, a MapReduce request [32] where the input is a huge amount of data split into smaller parts. The Mapper code is executed on every part, and
Table 1Notation of MEC-DCs infrastructure
Parameters Description
Substrate network Gm(Hm,Em)
Hm Set of substrate nodes
Em Set of substrate bidirectional links
L Set of optical light-paths in susbtrate
W Number of wavelength per link
B Bandwidth wavelength capacity
NMSPP(u) Number MSPP transponders at node u
Pu CPU capacity of nodeu
Gu GPU capacity of nodeu
Mu Memory capacity of nodeu
Su Storage capacity of nodeu
csu Storage unit price of substrate nodeu
cpu CPU unit price of substrate nodeu
cmu Memory unit price of substrate nodeu
cgu GPU unit price of substrate nodeu
cb
e Bandwidth unit price of substrate linke
all the results after Sort/Shuffle are sent to one or more reducers that merge all the results into one. More specif-ically, according to the dependency graph, task T1 is the Splitter/initializer, T2, T3 and T4 are the Mapper, T5 is the Shuffle/Sorter and T6 is the Reducer that combines the results.
Each task t ∈ Tn has a set of VM cloud
comput-ing requirements: (a) CPU capacitypt, (b) GPU capacity gt , (c) memory processing requirement mt, (d) storage
capacity st, and (e) processing order ot with respect to
any t ∈ Tn. Similarly, each link a ∈ An has
network-ing requirements: (a) data transfer capacitybtt between
media service sub-taskstandt, and (b) maximum num-ber of Optical-Electrical-Optical (OEO) conversionshtt
of an optical path that links taskstandt, as the time delay in the transport signal is affected mainly by the number of conversions between electrical and optical domains. It should also be noted that loading client signals requires an OEO conversion of the transport signal (wavelength). Table 2 shows the description of these parameters.
Each media cloud requestMncan be divided into
host-ing and network mapphost-ing. Each virtual hosthost-ing nodet ∈ Tnfrom a media cloud requestnis mapped into substrate
hosting nodesu∈Hmby mappingMN:Tn→Hm.
Similarly, each virtual linka∈Anbelonging to a media
cloud request n is mapped to an optical light-pathl ∈ lau,v⊂Lby mappingML:An→L, where(u,v)are
MEC-DC nodes assigned to virtual nodes, respectively the(s,d)
source and destination nodes of virtual linka.
Fig. 2Task dependencies graph
is largely based on the QoS requirements of the request, the availability of MEC-DCs resources, and the economic cost of accepting the request. Since we are focusing on cloud computing and optical networking, we propose to calculate the mapping cost of each service request n,Gn=(Tn,An), as follows.
COST[Mn]=COST[MN(Tn),ML(An)] . (2)
Details of mapping cost calculation are provided in the following section.
Column Generation formulation for MEC-DCs resource allocation (L-CG-MEC)
To avoid the scalability issue identified in the Integer Linear programming formulation [28], we propose the
Table 2Notation for media cloud requests
ParametersDescription
Virtual Network Mn(Tn,An)
N Set of virtual network requests
Tn Set of tasks in requestn
An Set of directional links between tasks
sandd Source and destination nodes
pt Required CPU capacity of taskt
gt Required GPU capacity of taskt
mt Required memory capacity of taskt
st Required storage capacity of taskt
ot Processing order of taskt
btt Transfer bandwidth between taskstandt
htt Maximum number optical-electrical-optical conversions of a
light-path that links taskstandt
lau,v Set of optical light-paths between substrate nodesuandv
used for mapping of virtual linka.
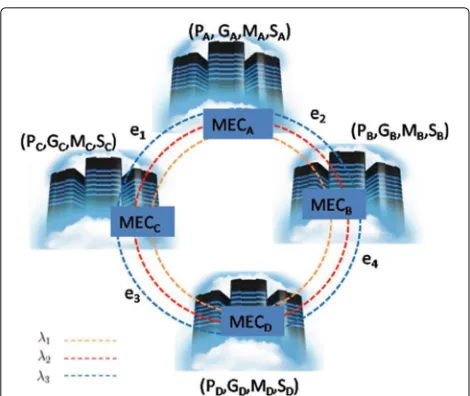
approach L-CG-MEC using the Column Generation tech-nique [29]. We reformulate the resource allocation prob-lem in terms of Independent Media Cloud Configurations (IMCCs). An IMCC configuration (Fig. 3) defines the mapping solution of at least one MEC request; it is rep-resented by the set of substrate nodes used to handle resource requirements (CPU, memory, GPU and storage) and the links/light-paths, all with the same wavelength, used to connect these nodes. We denote by C the set of all possible IMCCs. The resource allocation problem can then be formulated with respect to the variables
(λc),c ∈ C. Here, variable λc = 1 if IMCC c is used in the mapping solution and 0 otherwise. In the new formulation, the MEC mapping problem is to choose a maximum of W IMCCs, as W wavelengths are avail-able in each optical fiber link. Each IMCC is mapped on one WDM wavelength. The resulting configuration cor-responds to what is known as the master problem in a column generation approach [29], while each IMCC con-figuration corresponds to what is known as the pricing problem.
An IMCC configuration c ∈ C is defined by the vector (acn)n∈N such that: acn = 1 if IMCC c serves media cloud request Mn and 0 otherwise. We denote
by COSTc the cost of configuration c. This corre-sponds to the costs of the resources used (hosting and networking) for the set of MEC requests granted by IMCCc.
Fig. 3Combining IMCCs in order to build a mapping solution for media cloud requests
Master problem
The master problem, denoted by IMCC-ILP, is defined as follows:
Objective function:
min
c∈C
COSTcλc (3)
where
COSTc=
u∈Hm
Tc(u)×cMSPP+
e∈Em
Bc(e)×cbe
+
u∈Hm
Sc(u)×csu+Pc(u)×cpu+Mc(u)×cmu
+Gc(u)×cgu
(4)
cs u,c
p u,cmu,c
g
uandcbeare respectively unit costs of storage,
CPU, memory, GPU and bandwidth at MEC-DC loca-tionuand optical link e. Tc(u) is the number of MSPP
transponders used in nodeu by IMCCc. cMSPP denotes the unit cost of a MSPP transponder.Bc(e)is the band-width used on optical linkeby IMCCc. We also denote by Sc(u), Pc(u), Mc(u) and Gc(u) respectively the stor-age, CPU, memory and GPU in MEC-DC locationuused by IMCCc. We note that the objective function Eq. (3) minimizes the mapping cost of accepted MEC requests.
Constraints
c∈C
λc×Sc(u)≤Su; u∈Hm (αu) (5)
c∈C
λc×Pc(u)≤Pu; u∈Hm (βu) (6)
c∈C
λc×Gc(u)≤Gu; u∈Hm (γu) (7)
c∈C
λc×Mc(u)≤Mu; u∈Hm (ηu) (8)
c∈C
λc≤W; (u0) (9)
c∈C
λc×Tc(u)≤NMSPP(u);u∈Hm (ζu) (10)
c∈C
λc×anc ≥1; n∈N (ψn) (11)
Equations (5), (6), (7) and (8) guarantee the respect of available physical storage, CPU, GPU and memory capacity respectively. Equation (9) defines the number of WDM wavelengths available per optical link (fiber) l to guarantee the transport of data flows among MEC locations. Equation (10) defines the number of MSPP transponders available in optical network node u to add/drop/groom request flows to/from/with the wave-length available in the optical fibers connecting MEC-DC locations. Equation (11) guarantees that service requests can be satisfied with the available MEC-DCs resources.
Pricing problem
As mentioned previously, the pricing problem is to gen-erate an additional configuration (IMCC), an additional column, for the constraint matrix of the current master problem. It is defined as follows.
Letαu,βu,γu,ηu,u0,ζu,θuandψnbe the dual variables
associated with constraints (5), (6), (7), (8), (9), (10) and (11) respectively. Then, the reduced cost of variableλccan be written:
COSTc=COSTc+
u∈Hm
(αu×Sc(u)+βu×Pc(u)
+γu×Gc(u)+ηu×Mc(u)+ζu×Tc(u))+u0
−
n∈N
anc×ψn
(12)
We now express (12) in terms of the decision variables of the pricing problem. Those variables are defined as follows.
• zn=1if media cloud requestMnis served by IMCC c and 0 otherwise.
• xal =1if virtual linka∈Anis assigned to light-path l∈Laand 0 otherwise, whereLais the set of light-paths where their lengths do not exceed the number of OEO conversionhttallowed for a virtual linka=(tt)∈An,n∈N.
• xtu=1if taskt∈Tnis assigned to MEC-DC location u∈Hmand 0 otherwise.
Next, we derive the relations between the pricing vari-ables and the coefficients of the master problem. For each c∈Candn∈N,acn =zn, and for each nodeu∈Hm, we
have:
Sc(u)=
n∈N
t∈Tn
st×xtu (13)
Pc(u)=
n∈N
t∈Tn
pt×xtu (14)
Gc(u)=
n∈N
t∈Tn
gt×xtu (15)
Mc(u)=
n∈N
t∈Tn
mt×xtu (16)
Tc(u)=2∗yu (17)
Constraints:
Mapping of media cloud service tasks
i. Mapping is done for all tasks of an accepted media cloud requestMn.
zn≤
(u,u)∈H2
m
xtuxtu; (tt)=a∈An,n∈N. (18)
ii. A taskt of an accepted requestMnis assigned to only one MEC-DC location nodeu.
u∈Hm
xtu≤zn ; t∈Tn, n∈N. (19)
Mapping of media cloud request link
xtuxtu ≤
l=(u,u)∈Lau,u
xla ; (u,u)∈Hm2, (tt)=a ∈An.
(20)
Where Lau,u is the set of light-paths between node u andu having a number of O-E-O conversions less than allowed value htt for virtual link a = (tt). The
con-sideration of htt has the following two major roles in
determining the optimal solution:
1. It ensures that the number of O-E-O conversions are not more than the maximum allowed for each virtual link of any media cloud request. This is important because metro networks often are not composed of
optical amplifiers. The amplifiers are used mostly in Wide Area Networks, with a significant distance between source and destination.
2. It also ensures that data is placed in the closest MEC-DC, which can ensure QoS and cost requirements.
Accordingly, if request Mn is accepted, then at least
one light-pathlis assigned to allow data transfer between taskstandtassigned respectively to MEC-DC locationsu andu.
Number of MSPP transponders
n∈N
t∈Tn
xtu≤M×yu ; u∈Hm. (21)
An add/drop/grooming MSPP transponder port is set up in a MEC-DC location node u if at least one con-stituent task of a media cloud request is assigned to this location. We note thatMis constant and should be equal to or greater than the maximum number of vir-tual nodesa ∈Anthat can be mapped to substrate node u. M = G × NMSPP(u), where NMSPP(u) is the num-ber of available MSPP transponder in node u and Gis the grooming factor, i.e., the number of client signals that can be uploaded on each wavelength using a MSPP transponder.
Wavelength bandwidth capacity
n∈N
a∈An
l∈La
xal ×δle×ba≤B; e∈Lm. (22)
wherebais the bandwidth transfer requirement between
any pair of tasks (t,t) = a ∈ An. B is the bandwidth
capacity of the wavelength supporting all light-paths and
δel =1 if light-pathluses optical substrate linke. Wavelength grooming factor
n∈N
zn≤G. (23)
Gis the wavelength grooming factor that allows con-trol of the number of media cloud requests that can be loaded on a given wavelength (IMCC). By so doing, CP controls the load and congestion of optical network links. It allows the Cloud Provider to define a maximum use on the most congested links. In addition, it avoids an optical link becoming overloaded, thereby improving the latency experienced.
Linearization of quadratic terms Constraints (18) and
(20) include quadratic terms xt uxt
u. However, since this
a new binary variableytu,,tu where yt,t
u,u = xtuxt
u and by
adding the following constraints.
ytu,t,u ≥xtu (24)
ytu,t,u ≥xt
u (25)
Inequalities (24) and (25) ensure that ytu,t,u is zero if eitherxtuorxtuare zero.
ytu,t,u ≥xt
u+xtu−1 (26)
Inequality (26) ensures thatytu,,tu takes value 1 if both binary variablesxtu orxtu are set to 1. In our simulation, this linearization technique is done implicitly by the linear solver CPLEX [30].
Solving L-CG-MEC model:
This section discusses the steps involved in solving the L-CG-MEC model formulated in “Media edge cloud resource allocation approach” section.
Solving linear relaxation of the problem
We use the following Column Generation method to generate an embedding solution for media cloud requests.
ColumnGenerationProcedure():
1. Denote LP(M) the continuous relaxation of the master problem ILP(M) obtained by exchanging the integrality constraint (12) byλc∈[0, 1]for anyc∈C. 2. Initialize LP(M) by a dummy subset, that is, a set of
artificial IMCCs with a zero cost.
3. Solve the linear relaxation LP(M) of the master problem optimally using the CPLEX solver. Then go to step 4.
4. Solve optimally the pricing problem as follows:
(a) First, solve the pricing problem using a heuristic developed based on K- shortest path and the technique of node/link stress function proposed in [14].
(b) If this heuristic generates a new column with a negative reduced cost, go to step 5. (c) Otherwise, Solve exactly the pricing problem
using the CPLEX solver. Then go to Step 5.
5. If a column with a negative reduced cost has been found, add this column to the current master problem and repeat Steps 3 and 4. Otherwise, the master problem is optimally solved.
The optimal solution of LP(M) only provides a lower bound on the optimal integer solution ILP(M). To derive an integer VN embedding solution, we use the following approach.
L-CG-MEC-B&B approach
• Remove relaxation on variableλc.
• Apply the classic Branch-and-Bound CPLEX procedure on the optimal solution of the linear relaxation LP(M) generated using
ColumnGenerationProcedure().
Complexity analysis How often Cplex solver is used?
The use of the Column Generation technique means that the MEC mapping problem is divided [29] into a mas-ter problem (which includes constraints related to the availability of substrate resources) and a pricing problem (which includes the constraints related to the embedding resources used for granted MEC requests). The problem becomes one of generating an IMCC that improves the current value of the master objective function. To check the optimality of a solution of the LP(M) master model, a sub-problem called the pricing problem is solved to try to identify new columns (IMCC configurations) with negative reduced cost.
At each new iteration of the column generation pro-cess, the master problem is solved to optimality using a CPLEX solver to guarantee the optimality of the solution obtained at the previous iteration [29]. A CPLEX solver is used to solve the pricing problem only if the heuristic approach based on k-shorted path is unable to find a new IMCC configuration (column) with a negative reduced cost. Accordingly, CPLEX is used only very infrequently to solve the pricing problem at the last iterations of the Col-umn Generation process and to prove the optimality of the mapping solution. By so doing, we speed up the column generation approach and we guarantee the optimality of the LP(M) solution.
Would determining all IMCCs in an online manner incur significant latency?
Numerical results Simulation benchmark
To better illustrate the efficiency and superior per-formance of the Column Generation approach L-CG-MEC, we compare our proposal to the performance of three well-known virtual network embedding algo-rithms found in the literature, using a well defined set of metrics.
• Two-phase mapping approach (2-Phase-Mapping) [14], which first pre-selects the mapping of hosting nodes and then maps virtual links.
• Bin packing [11] (BP), where hosting and network requirements are mapped using a Bin per type of media cloud resource. The Bin packing in [11] introduces a method for forming and classifying Bins based on the resources available. Using the
information of Bin classification, the incoming requests are mapped accordingly. The pseudo code for mapping of incoming requests using Bin packing is shown in Algorithm 1.
• Greedy node mapping combined with a K-shortest path algorithm for the link mapping phase
(Multi-Site) [18]. The main difference between the greedy approach and Bin packing is that we classify Bins based on the resources. With the greedy approach, the model follows some of the well-known queue approaches such as First In First Out. We arrange the incoming requests in ascending order of their cost. Cost is defined by the function described in equation (2). The requests then are mapped to the MEC-DCs infrastructure. The pseudo-code for the resource allocation is shown in Algorithm 2.
Two main metrics differentiate our proposals from the benchmarks. These are(1)the applied MEC request map-ping approach, i.e., one-shot vs. two-phase embedding, and(2)small-batch vs. online mapping. To highlight the advantages of the one-shot node and link embedding approach, we compare our proposal to the 2-Phase-Mapping embedding approach. To evaluate the perfor-mance of small-batch vs. online embedding, we use BP and Multi-Site as benchmarks.
Experiment setup
To evaluate the efficiency of the L-CG-MEC model, we carried out experiments using IBM CPLEX solver [30]. The experiments were conducted with a physical infrastructure of 10 MEC-DCs interconnected through a ring metro WDM optical network topology [20]. For each media cloud request, virtual nodes, between 2 and 20 in number, are randomly but uniformly dis-tributed. The minimum connectivity degree is fixed to 2 links. QoS requirements are randomly determined
Algorithm 1:Adaption of Bin Packing proposed in [11]
for MEC-DCs resources allocation Input : Set of Bins B, virtual tasksTn
Letbi∈B represent the set of bins
AcceptedNode a set of nodes that can be hosted in B
SearchAndMapToBin(Tn,pt,gt,mt,st)
begin
foreacht in Tndo
Search a bin inBwhich satisfy pt,gt,mt,stoft.
end
Return {Binbi, SatisfiedTn}
end
foreach n∈Ndo
foreachTndo
AcceptedNode[]←
SearchAndMapToBin(Tn,pt,gt,mt,st)
end end
Output:biresponsible for hosting tasksTn, and set of
accepted tasks inTn
Algorithm 2:Adaption of Multi-Site in [18] for
MEC-DCs resources allocation
Input : Cost of resources at substrateHm,virtual
tasksTn,QoS requirements for tasksTn
Cost(pt,gt,mt,st)
begin
Costt= UnitCost(p) *pt+ UnitCost(g) *gt+
UnitCost(m) *mt+ UnitCost(s) *st
Return {Costt}
end
foreachn∈Ndo
foreacht∈Tdo
Costs[]←Cost(pt,gt,mt,st)
end end
Arrange Costs[] in Ascending order foreacht in Costs[]do
Not Possible to Map the request end
foreachAcceptedNode[]do
la
u,v←Calculate K- Shortest path b/nsanddfor t
end
foreach path∈lua,vdo if(path satisfied the QoS) AcceptedRequest[]←a Continue
else(Mapping Not Possible) end
Output: Accepted Tasks inTn, Path between hosting
by a uniform distribution among the following QoS classes [31]:
1. High-level delay sensitivity 1 (On-Line Gaming): requires High bandwidth and low latency. 2. High-level delay sensitivity 2 (High Definition
Telepresence): requires high bandwidth connection and storage due to high data volume and GPU for real-time audio-visual processing to support a high level of immersion and natural interaction between participants, as in face-to-face meetings.
3. Mid-level delay sensitivity 1 (Live video streaming e.g., sport event): requires minimum latency and high CPU/GPU powers.
4. Mid-level delay sensitivity 2 (Office applications e.g., CRM solutions): requires high storage capacity. 5. Loose-level delay sensitivity (Yahoo and Google
Mail): requires loose sensitive delay and high storage capacity.
Bandwidth/CPU/GPU/memory/storage unit cost, are expressed in terms of $X, which represents the price of 1 Mb of bandwidth or 1 unit of CPU/GPU/GB.
Performance evaluation metrics
In our experiments, we evaluated the following metrics.
1. Mapping Cost: The cost of the MEC-DCs resources used.
2. Media cloud demands’ blocking ratio: Blocking ratio measures the overall number of rejected MEC requests at each embedding period. It is the ratio of the number of rejected requests to the overall number of requests. While it gives a sense of how well an algorithm is performing, it cannot completely capture the performance and customer satisfaction, as these depend on the quality and the cost of the service. In fact, depending on the cost of MEC requests, it is possible for 10% of MEC requests, as an example, to provide a revenue equivalent to that offered by the remaining requests.
3. Wavelength utilization: The average ratio between the used and the overall amounts of available wavelength bandwidth.
4. CPU/GPU/Storage utilization: The ratio between the used and the overall available amounts.
5. Average number of hops: The average number of hops per mapped virtual link.
Evaluation results
This section describes the performance of the L-CG-MEC approach compared to related works in terms of resource usage. We also analyze the key factors that impact the optical transmission network among MEC-DC locations
(wavelength grooming factor, number of wavelengths, and the network linking topology (i.e., UPSR vs. BLSR)).
Efficiency of light-path resource allocation approach We first study the performance of the proposed L-CG-MEC model compared to the benchmarks in terms of mapping cost, media cloud blocking ratio, CPU, GPU storage and wavelength bandwidth usage.
Figure 4a plots the cumulative CP mapping cost against the allocation time periods. It compares the mapping cost for L-CG-MEC and for benchmark models BIN, 2-Phase-Mapping and Multi-site. The results show that the L-CG-MEC model provides the lowest cost by approxi-mately 37% compared to Multi-Site, which had the highest cost during the simulation run period 10. The cost for the greedy approaches, Multi-Site and BP, is high because they inherently map requests without optimizing. By contrast, the 2-phase-mapping solution is solved for optimization, resulting in minimal cost.
Figure 4b plots the blocking ratio of media cloud requests against the allocation time periods. The Bin and Two-Phase-Mapping approaches show a major blocking ratio on some periods and a higher cumulative cost. Multi-Site provides the lowest blocking ratio, but at the highest
cost. This is because, with the exception of L-CG-MEC, no approach performs global optimization. Therefore, the solution determined at the node phase cannot be satisfied during the light-path mapping phase because resources in the selected paths are not available. On the other hand, with L-CG-MEC, requests are blocked because the incoming request requirements were beyond those the infrastructure service provider could satisfy at that time.
For every period, several combinations of different classes of traffic are generated to mimic the real traffic. This explains the jagged nature of the substrate resource graphs (Fig. 5 and 6). In other words, if, in period one, 10% of the traffic is class 1 (online gaming traffic) and the remaining 90% of the traffic is class 2 (mail traffic), the resource requirement is lower and acceptance is higher compared to a scenario where 80% of the traffic is class 5 and remaining 20% is class 1.
Figure 5a shows the wavelength use of the selected approaches compared to L-CG-MEC. A higher wave-length use in an optical network can be related to higher link throughput. The higher the wavelength use, the bet-ter the system. At the same time, care needs to be taken that selected paths for the requests do not perform too many O-E-O conversions (more detail is given in Impact
Fig. 5MEC-DCs Resource utilization for L-CG-MEC vs. Benchmark approaches.aWavelength bandwidth usage.bCPU usage
Fig. 6Periodical MEC-DCs nodes resources usage.aGPU usage. bStorage usage
of number of wavelengths per optical Fiber section). From the results, it is clear that 2-phase mapping has the least bandwidth use. Although 2-phase had better acceptance, the wavelength use was poor. This is due to an improper selection of requests accepted for the embedding. The number of requests could be higher but the revenue gen-erated from the request leads to too much wastage of resources. The L-CG-MEC had the highest overall wave-length use because an initial global optimization was per-formed. This solution yielded the overall optimal solution in terms of the highest use of link resources at the low-est cost to the service providers. A similar conclusion can be drawn from the other approaches, BP and multi-site, where lack of optimization and a one-shot solution can lead to poor use of link resources. Hence, we can ascertain from Fig. 5a that a global optimization, if designed with proper constraints, provides better resource use and less complexity.
worst performance was by BP, because of its first-come-first-served approach.
Analysis of network dimensioning key factors
Below, we analyze the key factors that impact MEC-DCs resource utilization and uses QoE i.e., acceptance ratio, number of hops, and mapping cost.
Impact of grooming factor Figures 7a, b and c plot the
variation of mapping cost, the average number of hops and the wavelength bandwidth use against the grooming factor (the number of client signals that can be loaded on a given wavelength). The figures show the impact of the grooming factor on the L-CG-MEC model in terms of bandwidth wavelength use and the average number of hops. These two parameters have a big impact on latency, the most stringent QoS requirement. The grooming fac-tor, in fact, needs to be kept as low as possible in order to avoid congestion and to guarantee an acceptable degree of latency in multimedia applications. These figures show grooming factor values that provide the optimal aver-age number of hops per service request link as well as the optimal wavelength use. In other words, the results of the simulation illustrate the adjustment of the groom-ing factor with respect to expected wavelength bandwidth use and the average number of hops needed to keep the latency below accepted values.
Impact of number of wavelengths per optical Fiber Figures 7d, 8a and b plot the variation of blocking ratio, mapping cost and average number of hops against the number of wavelengths used per optical fiber link. First, the blocking ratio is clearly closely related to the number of wavelengths used to transmit service request data among MEC-DC locations. The blocking ratio actually decreases as the number of wavelengths increases. Second, these figures show that, for a given demand pattern, increasing the number of wavelengths beyond a certain value has no impact on mapping cost and the average number of hops. For example, when the number of wavelengths equals 5, the map-ping cost and the average number of hops are quite constant. These results help to optimize capital expendi-tures while honoring the QoS requirements inherent in media cloud demand. Also, the number of hops is cru-cial in an optical network as it might lead to O-E-O conversion. Care needs to be taken to reduce O-E-O conversion as the system strives to increase its link resource use.
Impact of linking topology Figures 9a, b and c plot
respectively the average number of hops, blocking ratio and mapping cost against the allocation time periods. The results show the impact of the network topology on the performance of the proposed L-CG-MEC approach.
Fig. 8Impact of number of wavelengths per fiber.aBlocking and number of hops.bMapping cost and Number of hops
UPSR and BLSR topology are the most widely used con-figurations in optical networks. We therefore studied mapping performances in comparison to UPSR vs BLSR topologies. The results show that BLSR topology reduces the average number of hops per mapped virtual link. How-ever, both topologies provide almost equal mapping costs and blocking ratios. We can conclude that the use of UPSR and BLSR has a minimal effect on the initial acceptance or performance of the user requests. On the other hand, UPLSR and BLSR have an impact in providing resilience to the accepted requests. Nonetheless, the proposed model can be used with both UPSR and BLSR metro networks.
Simulation CPU time
Only one network configuration is used in our simula-tion and this may limit the generalizasimula-tion of the results. It is hard to give a clear relationship between CPU time and network parameters (# nodes, # links) and traffic pat-tern/volume. However, although there might be a signifi-cant impact in increasing the network parameters (nodes, links) on simulation CPU time, our Column Generation approach calculates a feasible and near-optimal solution by heuristically solving the pricing problem with a large network and a large number of requests. As for any net-work design problem, it is expected that the larger the numbers of network nodes and links, the longer the CPU time. There is a certain trade-off between reducing the simulation CPU time and calculating the optimal solution. In addition, the current solution is suggested for metro
optical ring topology where the number of nodes/links and the number of requests are relatively less important than with meshed and large-scale networks. According to the simulation results, the L-CG-MEC decomposition approach showed a higher computation time than the benchmarks. The two benchmarks showed a computation time of a few seconds to a few minutes and L-CG-MEC a computation time varying from 10 to 20 minutes. How-ever, we showed that Column Generation L-CG-MEC decreased the MEC mapping cost by 37% and blocking ratio by 15% on average and that MEC resources are used more efficiently.
One might ask whether the significant difference in computation time between the benchmarks and L-CG-MEC is reasonable. Yes, it is. The benchmarks use a heuristic approach, which means using a local search algorithm to browse for feasible solutions. Only a small number of possible solutions are examined, so computa-tion time is short. But the heuristic approach is unable to indicate how far the solution obtained is from the optimal one. However, L-CG-MEC is based on an exact approach (ILP modelling) using a global search algo-rithm to browse for feasible solutions. Accordingly: (a) the computation time increases significantly with the size of the space, and (b) an exact algorithm can consume a lot of memory, also leading to a high computation time. Nevertheless, the L-CG-MEC approach provides the gap between the obtained solution and the opti-mal one, even when the algorithm is stopped before completion. It can even prove optimality, if the integer embedding solution is equal to the optimal lower bound provided by the linear relaxation of the master problem LP(M).
Computation times are obtained using a CPLEX solver 12.3 and an Intel Duo Core Dell machine running Win-dows 7 Enterprise. Since L-CG-MEC uses a Branch-and-Bound algorithm to find an integer solution, we cannot claim that we have calculated the optimal solutions. How-ever, the solutions are still satisfactory compared to those obtained using benchmark models. In addition, the differ-ence between the value of the incumbent integer solution of ILP(M) model and the optimal value of the linear relaxationLP(M)is smaller than 5%. This is satisfactory, given that most proposals in the literature are heuristic or based on two-phase mapping and that one-shot node and link embedding is a NP-hard problem. For an opti-mal solution, the L-CG-MEC approach can be combined with branch-and-price procedure, where branching rules can be properly defined to avoid generating a huge num-ber of pricing problems. Branching can be done either on the variables of the master problem using cuts, or on the variables of the pricing problem, using a classic branch-and-bound procedure or cuts. We propose to examine this technique in our future work.
Conclusion
Processing, transmitting and storing media data in MEC-DCs can enhance the QoE of an end user in terms of latency, acceptance ratio, reliability and cost. The use of MEC-DCs compared to traditional DCs for media requests has known limitations: limited resource avail-ability at a given DC, and a high resource require-ment. To efficiently manage both the network and the MEC-DCs resources, we proposed a CG-based one-shot model. For each accepted request, an optimal one-shot networking and hosting scheme is calculated to ensure QoS requirements. We also analyzed the key factors that impact the network among MEC-DC locations: wave-length grooming, wavewave-length bandwidth capacity, the number of wavelengths per optical link, the number of MSPP transponders and the impact of network topol-ogy (UPSR vs. BLSR). Simulation results proved that the L-CG-MEC approach performed significantly bet-ter compared to the benchmark approaches from the literature.
As a future improvement, we would like to consider Dense Wavelength Division Multiplexing factors and study their impact on QoE of multimedia application users.
Abbreviations
IaaS: Infrastructure as a service; CS: Compresssive sensing; CP: Cloud service providers; L-CG-MEC: Large scale column generation media edge cloud; MEC-DC: Media edge cloud data centers; MSPP: Multi service provisioning platform; QoE: Quality of experince; SLA: Service level agreement; SLA: Service level agreement; QoS: Quality of service; UGC: User generated content; VM: Virtual machine; VN: Virtual network; WDM: Wavelength division multiplexing; WMN: Wireless mesh network;
Funding
This work was supported by a Grant from Natural Sciences and Engineering Research Council of Canada. The funding agency is not involved in this research.
Availability of data and materials Not applicable.
Authors’ Contributions
This paper describes a collaborative project between the University of Ottawa, Canada, and the University of Paris Descartes, France. AJ: Design, modelling, analysis and interpretation of data, prepare first draft of the paper. AK: Design, revise and give final approval of paper. JS: Implementation, simulation, analysis and interpretation of data, drafted the paper. JE: Design and revise the paper. AM: Design and final approval of the paper. FZ: Draft and revise the paper. All authors have read and approved the final manuscript.
Competing interests
The authors declare that they have no competing interests.
Publisher’s Note
Springer Nature remains neutral with regard to jurisdictional claims in published maps and institutional affiliations.
References
1. Xu H, Li B (2012) A general and practical datacenter selection framework for cloud services. IEEE 5th International Conference on Cloud Computing (CLOUD), Honolulu, HI, USA. pp. 9–16
2. Fesaehaye D, Gao Y, Nahrstedt K, Wang G (2012) Impact of Cloudlets on interactive mobile cloud application. IEEE 16th Conference International Enterprise Distributed Object Computing (EDOC), Beijing, China. pp 123–132
3. Endo P, et al. (2011) Resource allocation for distributed cloud: concepts and research challenges. IEEE Network 25(4)
4. Zhang Q, Zhani M, Jabri M, Boutaba R (2014) Venice: Reliable virtual data center embedding in clouds. INFOCOM:289–297
5. Hou W, Guo L, Liu Y, Yu C, Zong Y (2015) Resource management and control in converged optical data center networks: survey and enabling technologies. Computer Networks 88:121–135
6. Bari DF, et al. (2013) Data-Center Network Virtualization: A Survey, Communications Surveys and Tutorials 15(2):909–928
7. Pillai P, Lewis G, Simanta S, Clinch S, Davies N, Satyanarayanan M (2013) The Impact of Mobile Multimedia Applications on Data Center Consolidation. IEEE International Conference Cloud Engineering (IC2E), Redwood City, CA,USA. pp 166–176
8. Zhu W, Luo C, Wang J, Li S (2011) Multimedia cloud computing. IEEE Signal Process Mag 28:59–69
9. Peng S, Nejabati R, Simeonidou D (2013) Role of Optical Network Virtualization in Cloud Computing. IEEE/OSA J Opt Commun Netw 5(10):162–170
10. Jarray A, Jaumard B, Houle AC (2010) Reducing the CAPEX and OPEX Costs of Optical Backbone Networks. IEEE International Conference on Communications (ICC), Cape Town, South Africa
11. Eyraud-Dubois L, Larcheveque H (2013) Optimizing Resource allocation while handling SLA violations in Cloud Computing platforms. IEEE 27th International Symposium on Parallel & Distributed Processing (IPDPS), Boston, MA, USA
12. Zeng LZ, Ye X (2012) Multi-objective Optimization Based Virtual Resource Allocation Strategy for Cloud Computing. IEEE/ACIS 11th International Conference on Computer and Information Science (ICIS), Shanghai, China 13. Nonde L, et al. (2014) Green Virtual Network Embedding in Optical OFDM
Cloud Networks. 16th International Conference on Transparent Optical Networks (ICTON), Graz, Austria
14. Zhu Y, Ammar MH (2006) Algorithms for Assigning Substrate Network Resources to Virtual Network Components. IEEE Infocom:1–12 15. Chowdhury NMK, Rahman MR, Boutaba R (2012) ViNEYard:Virtual
Network Embedding Algorithms With Coordinated Node and Link Mapping. ACM/IEEE Transaction on Networking 20(1):206–2019 16. Thompson K, Miller GJ, Wilder R (1997) Wide-Area Internet Traffic Patterns
and Characteristics. IEEE Network 11(6):10–23
17. Jarray A, et al. (2012) DDP: A Dynamic Dimensioning and Partitioning model of Virtual Private Networks resources. Comput Commun 35:906–915
18. Nan X, He Y, Guan L (2012) Optimal Resource Allocation for Multimedia Application Providers in Multi-site Cloud. IEEE International Symposium on Circuits and Systems (ISCAS), Beijing, China
19. Tzanakaki A, et al. (2011) Energy Efficiency in integrated IT and Optical Network Infrastructures: The GEYSERS approach. IEEE Conference on Computer Communications Workshops (INFOCOM WKSHPS), Shanghai, China
20. Gokhale P, Kumar R, Das T, Gumaste A (2010) Cloud computing over metropolitan area WDM networks: the light-trails approach. IEEE Global Telecommunications Conference (GLOBECOM 2010), Miami, FL, USA 21. Tzanakaki A, Anastasopoulos MP, Zervas GS, Rofoee BR, Nejabati R,
Simeonidou D (2013) Virtualization of heterogeneous wireless-optical network and IT infrastructures in support of cloud and mobile cloud services. IEEE Commun Mag 51(8):155–161
22. Hou W, Guo L, Liu Y, Song Q, Wei X (2013) Virtual Network Planning for Converged Optical and Data Centers: Ideas and Challenges. IEEE Network 27(6):52–58
23. Anastasopoulos MP, Tzanakaki A, Simeonidou D (2015) Scalable services provisioning in converged optical wireless clouds using compression techniques. OFC
24. Develder C, Buysse J, Dhoedt B, Jaumard B (2014) Joint dimensioning of server and network infrastructure for resilient optical grids/clouds. IEEE/ACM Trans Netw 22(5):1591–1606
25. Gong X, Guo L, Shen G, Tian G (2017) Virtual Network Embedding for Collaborative Edge Computing in Optical-Wireless Networks. in J Lightwave Tech 35(18):3980–3990
26. Hou W, Ning Z, Guo L, Chen Z, Obaidat MS (2017) Novel Framework of Risk-Aware Virtual Network Embedding in Optical Data Center Networks. in IEEE Syst J PP(99):1–10
27. Eppstein D (1998) Finding the shortest paths. SIAM J Comput 28(2):652–673
28. Anderson DG (2002) Theoretical approaches Approaches to Node Assignment. Unpublished Manuscript, available at: https://www.cs.cmu. edu/~dga/papers/andersen-assign-abstract.html. Accessed Dec 2017 29. Ubbecke ME, Desrosiers J (2005) Selected Topics in Column Generation.
Operations Res 53:1007–1023
30. IBM ILOG Cplex 12.6.1, User Manual. http://pic.dhe.ibm.com/infocenter/ cosinfoc/v12r4/topic/ilog.odms.studio.help/pdf/usrcplex.pdf. Accessed Dec 2017
31. Ceselli A, Premoli M, Secci S (2015) Cloudlet Network Design Optimization. IFIP
32. Dean J, Ghemawat S (2008) Magazine Communications of the ACM - 50th anniversary issue: 1958 - 2008 51(1):107–113