DOI 10.1007/s13173-010-0011-5 O R I G I N A L PA P E R
EvolTrack: improving design evolution awareness in software
development
Rafael da Silva Viterbo de Cepêda·Andréa Magalhães Magdaleno· Leonardo Gresta Paulino Murta·Cláudia Maria Lima Werner
Received: 20 December 2009 / Accepted: 23 April 2010 / Published online: 11 June 2010 © The Brazilian Computer Society 2010
Abstract Software differs from most manufactured prod-ucts because it is intangible. This characteristic makes it difficult to detect, control, and understand how it evolves. This paper presents an approach based on software visu-alization that can detect and externalize design evolution made in a software project during its initial development or at any further phase. By using this approach, a devel-oper can be aware of the current state of the software as a whole and can additionally verify if the current design, also called emerging design, is evolving according to the team expectations and leader guidance, preventing problems caused by misunderstandings of the expected software so-lution. The approach was evaluated with free/open source software (FOSS) projects. The results indicate that the ap-proach behaves as expected when applied to real software development projects, with minor performance bottlenecks.
Keywords Software evolution·Software visualization· Design evolution
R.S.V. de Cepêda (
)·A.M. Magdaleno·C.M.L. Werner COPPE/UFRJ—Systems Engineering and Computer Science Department, Zip 21945-970, P.O. Box 68511, Rio de Janeiro, RJ, Brazile-mail:[email protected] A.M. Magdaleno
e-mail:[email protected] C.M.L. Werner
e-mail:[email protected] L.G.P. Murta
IC/UFF—Instituto de Computação, Universidade Federal Fluminense, Niterói, RJ, Brazil
e-mail:[email protected]
1 Introduction
Software design is a problem-solving activity that links the problem domain with the solution domain [23]. In other words, it could be thought as a process that transforms the output of the requirements analysis phase into detailed spec-ification of the solution, which serves as input to program-mers. As it can be observed, the design process is also a communication instrument, usually employed as a guide to the programming activities. Due to that, any kind of mis-understanding or divergence (i.e., a failed communication) between the initial idea of the solution and the current im-plemented solution can lead to future problems. These is-sues are amplified when looking at a real programming dy-namics, that is, when software evolution is considered and also when distributed development takes place, leading to severely harmed communication.
In this context, software evolution can be defined as ‘the dynamic behaviour of programming systems as they are maintained and enhanced over their lifetimes’ [9]. Al-though the fact that this concept is usually applied to de-scribe a situation after the initial development, here we use the term broadly, i.e., also encompassing the initial devel-opment phase. Then since the software evolves over time, and because its design is an intrinsic part of it, the software design itself can evolve over time, too.
a less relevant problem (as communications can be usually done face-to-face). However, when distributed software de-velopment is present, that problem must be considered. That is why, in this scenario, face-to-face communication is usu-ally too expensive and usual communication made by email, phone, and instant messaging becomes less effective than it was in collocated scenarios when anyone can just pick up a white board and sketch whatever one judges necessary to make one’s point. Thus, what we mean by less effective, in this case, is that someone can easily talk about what has been just done, but cannot effectively show the consequences of that in the existing structure of the software being made.
To address this issue, we present an approach, called EvolTrack that, based on software visualization, captures and communicates with minimal human intervention each contribution made to a specific software project. Here, con-tribution means any action (in fact, this can be configured) resulting in a software evolution. EvolTrack can be deployed in collocated or distributed settings but its main focus is when distribution is in place. The communication is made to all members of the team using EvolTrack and is achieved si-multaneously, showing everybody the emerged design from each individual contribution. Actually, it keeps track of all intermediate designs generated until the most current one, enabling the user to navigate, if necessary, through all the evolution history. Moreover, it provides some visual features that enhance the awareness of what has been changed from one evolution to another and, with the zooming feature, also allows working with large projects.
Therefore, we believe that the EvolTrack approach can effectively supplement the regular communication done in ordinary software projects, especially when distributed de-velopment is being used. Note that we are not intending to eliminate communication; instead we hope to provide ad-ditional means to make this activity more effective and con-stant during the software development phase. In this context, to evaluate the feasibility of EvolTrack in real scenarios, we executed a qualitative study using free/open source software (FOSS) projects.
The rest of this paper is organized as follows. Section2 presents a motivating example to ground the remaining dis-cussions. Section3introduces the EvolTrack approach and some important aspects of its implementation. Section 4 shows a qualitative study referring to the approach evalua-tion in real projects. Secevalua-tion5discusses related work, and we conclude the paper in Sect. 6, summarizing what has been done so far and what our next steps should be.
2 Motivation
Suppose a situation in which a small geographically dis-tributed software team was hired by MediaTech to create
a version control system, called MediaTech-VCS, which is intended to manage artefacts other than source code. The team was divided as follows. One technical leader, called John, was responsible for gathering and analyzing the soft-ware requirements. In addition, he was also responsible for creating an initial conceptual software design representing the expected solution to the problem. The remaining of the team consisted of two categories of developers: main de-velopers and secondary dede-velopers. The first category was in charge of creating the main structure of the system, that is, those core features representing the software kernel. The second category, in turn, was asked to create auxiliary fea-tures, such as those that do not impose influence onto the system architecture but enhance its usability instead. Note that the main developers, in their majority, were the most experienced programmers, while the second category of de-velopers was less experienced in the adopted technology or in the software domain being developed.
Scenario 1: Elton is a software developer initially in-side the second category of developers. While refactoring his previous code, he received a request from John to cre-ate, ASAP, a feature where the user could enter information about the company clients. The result of this feature should be reflected on the already created client report. However, to implement this feature John informed Elton he would need to use the services of fifteen well-defined classes from the conceptual solution that, at this point, were being developed by three main developers of the project. John also empha-sized that the current refactoring activity should be held in favour of this new feature, and this should occur just after the necessary set of classes were made available by the main developers.
To be aware of this appropriate time to start coding the new feature, Elton devised two possible strategies. The first strategy is to periodically ask the main developers if the set of classes and services had already been created. However, Elton identified some very disturbing problems that could complicate the execution of this strategy. For instance, iden-tifying who was responsible for creating each class is usu-ally not an easy task, especiusu-ally if the project is developed in a distributed way, as it is the case. Another problem is that, in order to establish this kind of communication, he is also interrupting the work of other developers and, because of the frequency of it, delaying the whole development process. Moreover, an additional problem would be the mismatching between what the main developer says and what is really implemented.
noticed that by reading all the source codes, the task of un-derstanding the current implemented solution would prob-ably be complicated. A global view of the software being developed would also be compromised as only a subset of it would actually be under his review. Finally, despite not be-ing part of his duties, by usbe-ing this strategy, he would prob-ably not be able to identify divergences between what John said to him about the solution (i.e., the expected solution of the software) and what is really implemented by the main developers. As it can be seen, any of these strategies would probably cause problems to Elton, to the team, or even to the project itself when adopted.
Scenario 2: After one year of development, John asked Elton to create an important feature of the project. That is, despite of his post as secondary developer, a key set of evo-lutions should now be implemented by Elton. To implement it, Elton should first understand how the software structure has been implemented so far, indentifying the key elements of this structure and their relationships with the rest of the system. Putting the enthusiasm for this unique opportunity aside, he wondered how he could achieve this kind of knowl-edge in a reasonable time frame with the existing tools.
Once again, two strategies came up to his mind. He could ask John to schedule a meeting with all the main project developers to gather the information needed to understand the currently implemented solution and how this solution was conceived. However, there were some problems asso-ciated with this strategy that might be considered. In a dis-tributed development scenario, this kind of meeting could become very expensive to the project or even impossible to be executed due to budget or time constraints. Also, as it is a transfer of knowledge based on informal communication, characterized by a face-to-face meeting, as explained before, there are chances of misunderstanding. Additionally, there is no guarantee that all the important elements of the software structure will be fully remembered by their creators, as con-siderable time may have passed until then.
He could, instead, build that body of knowledge by read-ing current and past source code versions of the software as a whole. A similar strategy was suggested before when he wished to identify the creation of a specific set of classes among all the software artefacts. However, even in medium-scale projects, this kind of activity would use a large amount of time and, because of the software complexity, the abil-ity to understand it through this strategy might be severely harmed. Moreover, this kind of activity usually requires a degree of experience on both the technology used and the conceptual design created for this software. Unfortunately, this was not the case of Elton.
Scenario 3: In the same period, John decides that he should monitor the progress of the project concerning its de-sign. He wants to observe if the main developers were fol-lowing the conceptual design created by him. He thought
of two strategies to do it. He could periodically schedule a status meeting with the main developers to retrieve this information or he could try to periodically read the source code produced in the project. Besides all the problems re-lated to this last strategy, as presented before, a team leader like John does not often have the necessary skills to execute this task. Due to that, the expected time to execute this strat-egy becomes impractical in a real development situation. The first strategy, in which status meetings are scheduled, comes with the same problems of Elton’s proposed meet-ings with the main developers to understand the project as a whole. In addition, in this case, in order to understand the progress effectively, John should keep formal records of the results from all the meetings performed until this moment. He should also keep track of what changed in the project from one meeting to another. These kinds of bureaucratic tasks would involve a huge amount of time that could be used to really understand project dynamics and problems in-stead.
3 EvolTrack overview
EvolTrack is a software visualization tool that provides a time based approach to observe the emerging design [21] at different moments during the development life cycle. Basi-cally, it periodically extracts project information from a spe-cific data source and then, after doing some pre-processing and transformation, presents the corresponding software de-sign for that period of the project. This period of time can always be adjusted according to project needs and behav-iour.
In this context, a data source could be any kind of ex-ternal system capable of providing structural information on the project. In other words, it is a place where informa-tion about software artefacts, such as classes and packages, can be found. Examples of those places are Version Control Systems (e.g., Subversion, CVS, and ClearCase) and De-velopment Workspaces (e.g., Eclipse and NetBeans-based workspace).
other words, the person who triggered the last design evolu-tion.
As it can be noted, the main functionality provided by the tool is to visualize the evolution of software design during the whole development lifecycle. Another interesting func-tionality provided is the use of the design visualization to ob-serve metric and its evolution over time, using colour scales to represent each possible metric that can be visualized. This topic is better exemplified in Sect.3.2. Furthermore, a zoom-ing functionality can be used to explore large visualization contents.
This approach could be continuously or periodically in-troduced into a software development process during the construction phase. For instance, if a developer wants to keep track of every evolution being made to prevent rework-ing or to understand what is gorework-ing on with the project in real time (scenario 1 of Sect.2), he/she will probably take advan-tage of a side-by-side view of the code and of the software design being evolved, as illustrated by Fig. 1. This
config-Fig. 1 A two-monitor software visualization schema [20]
uration would enable the developer to be aware, while de-veloping, of any design evolution made to the project. On the other hand, if some developer or manager wants to learn about the design evolution only at specific time intervals (scenarios 2 and 3 of Sect.2), as for instance on a weekly basis, they could just turn on EvolTrack at the end of each work week, configuring it to generate each design evolution based on data about the entire week instead of creating one design evolution for each single change inside the project structure.
It is important to notice that EvolTrack does not intend to replace other communication tools such as email, wiki, phone, instant messaging, etc. It can and should be used as a supplementary tool for communication. Moreover, it does not suppress other software engineering techniques such as inspections, design reviews, and architecture evaluations. Actually, EvolTrack can be seen as a tool to help enacting these techniques in a distributed setting.
3.1 EvolTrack architecture
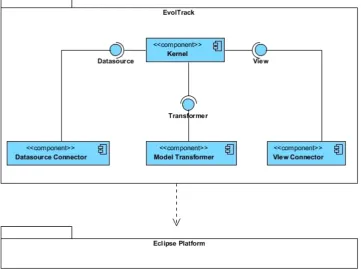
Figure2shows the main elements of the EvolTrack archi-tecture. It consists of four key components: Kernel, Data-source Connector, Model Transformer, and View Connec-tor. The Kernel component is still divided into four addi-tional, not displayed, modules: Datasource Manager, Model, Persistence, and View Manager. In general, the Datasource Connector is responsible for extracting project information from a specific kind of data source and transforming it on
the expected representation (i.e., a UML Model). Due to that, for each kind of data source, an appropriate Datasource Connector must be designed and implemented. For example, EvolTrack currently has Datasource Connectors for Subver-sion, Odyssey-VCS [12], and Eclipse workspaces.
Each of these connectors was implemented using the plug-in infra-structure provided by the Eclipse Platform. This infrastructure is based on the concept of extension points, on the provider side, and extensions on the client side. Using this approach, the Kernel module can automati-cally identify and select the appropriate components needed to execute the whole functionality. Moreover, it is possible to easily extend the approach by coding additional connec-tors.
The same idea also applies to the Model Transformer element. This optional component can add information or aggregate value to those models initially created by Data-source Connectors, usually enriching those models with de-tails about the project, such as, for example, metric.
Usually, the information flows from the data source to the Datasource Connector which, having performed a re-verse engineering action, creates a UML model represent-ing a specific state of the software design. The kernel then stores this information and, based on the observer [7] design pattern, notifies all View Connectors that an evolution in the software design occurred and that a new model has become available.
Currently, just one view connector is available in Evol-Track, the one based on the Eclipse platform as the basis
for the visualization mechanism. After receiving the notifi-cation, this connector translates the UML model into a UML Class Diagram with some annotation, such as the collected metric (produced by Model Transformers) and author and date (produced by the Kernel itself).
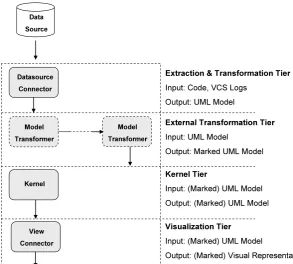
The previously described process is the basic usage sce-nario of EvolTrack. However, as it can be seen in Fig. 3, the Model Transformer component can change this flow by adding other annotations to the model before it is catalogued by the Kernel component. The resulting model is called Marked UML Model as it is actually marked with UML stereotypes and tagged values according to a specific UML Profile. Each stereotype or tagged value usually represents a metric or a measure associated to the project. For example, if someone wants to test a new method to calculate a coupling level for classes and visualize the results for each version of the design, a Model Transformer could be implemented, cre-ating, for instance, a UML stereotype called ‘coupling level’ and associating it with each class found in the model, using the new method to set the appropriate tagged value of the metric in each case.
At the other end, the View Connector is responsible for creating a visual representation of the design based on the UML Model retrieved from the Kernel. The idea is to have one connector for each kind of desired representation. As previously discussed, just one View Connector is currently available in EvolTrack. It uses a representation based on the UML Class diagram to translate the information into vi-sual data. Additionally, it offers a timeline mechanism where
the user can navigate through all design evolutions occurred during the development lifecycle.
The use of a UML class diagram stems from its compat-ibility with our internal data model, also based on a UML standard, and its relative consensus amongst the software community on describing design information. Another im-portant point in using UML is because it is a well-known modelling language used by software engineers and, there-fore, one that would probably save time as there is no need to learn a new notation.
The Kernel module orchestrates all this information flow and maintains all models created at the end of the transfor-mation phase. It uses a Datasource Manager to keep track of all installed Datasource Connectors. The process is as fol-lows: at the initialization time, this manager reads Eclipse plug-in records to find if some extension of type Datasource Connector is available. If one or more connectors are found, they are catalogued and the last running connector is started. If EvolTrack is being initialized for the first time, no con-nector is started and the user must choose one Datasource Connector from the Preferences menu. Thus, subsequent ex-ecutions will always keep the last choice of the user. The Datasource Manager is also responsible for checking which Model Transformers are available and what sequence they should be executed in.
Once the final model (obtained after the execution of all transformers) is obtained by the Datasource Manager, it is
recorded by the Model component as a new model or an evolution. This component then stores it in the file system using a Persistence module, indexing each model according to a linear sequence based on a creation date ordering. Due to that, every time EvolTrack is re-executed, and it does not need to extract and transform already-processed evolutions all over again.
3.2 Visualizing metric evolution
The visualization of metric behaviour over time is an im-portant feature provided by EvolTrack that, combined with other features discussed below, helps developers to be aware of what is going on with the project, possibly indicating some future problems or situations. Returning to the exam-ple discussed earlier, if we have a Model Transformer that enriches each model with coupling information for every single class, some problems that could occur in the future would probably be inferred by observing the colour varia-tion during a certain period of time. Figure4illustrates this behaviour.
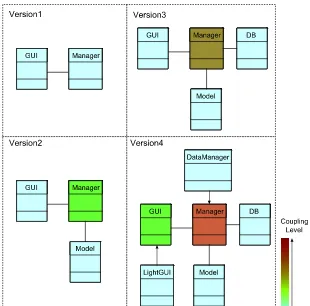
The figure presents a set of design evolutions made to a project and the corresponding application of those coupling metric as discussed before. Initially, in Version 1, just two classes exist in the project: GUI and Manager. Note that, based on the colour scale defined for this metric both have a low coupling level. However, as the project evolves over
Fig. 5 Metric configuration panel
time, it is possible to see in Version 3 that the class Manager increasingly becomes a strongly coupled element, just by observing that its colour rapidly reaches the top of the colour scale. This simple colour variation could be a sign indicating that the emerging design is probably becoming inadequate or that future problems may rise in the project due to the lack of maintainability of certain software elements.
In this context, project managers or even developers us-ing the EvolTrack metric visualization feature could quickly understand and respond to this situation by suggesting the application of some refactoring or reengineering procedure on the coupled elements. This mechanism constitutes an im-portant and useful source of awareness of the way software has been implemented. There are many possibilities. By us-ing this infrastructure, different information regardus-ing the project could be visualized from an evolutionary perspec-tive.
The tool, in turn, provides a simple way to import a list of metrics and associate a colour scale for each one. As the Model Transformer should create a UML Profile to apply metrics to the model (it is important to remind that a metric is implemented via UML stereotype and tagged values), the same UML Profile is used to import the metric in the GUI, as shown in Fig.5. Thus, the first step is to load the UML Profile in the tool. After that, the user has to configure each metric by selecting one of nine possible colour scales and defining a value range for it.
Each colour scale has advantages and disadvantages. For instance, one of the biggest advantages of the provided grey scale for representing a single scalar variable is the ef-fectiveness of the human visual system at making judge-ments about shape from lightness variation [18]. However, this colour scale offers a limited number of distinguish-able display values (approximately 100). To address this issue, EvolTrack also provides optimal colour scales [10], like OCS (Optimal Colour Scale) and LOCS (Linear Op-timal Colour Scale—used in the Fig. 4 example), which maximizes the total number of JNDs (Just Noticeable Dif-ferences) while preserving a natural order. In addition, the heated-object scale has a more strongly perceived natural ordering than a rainbow scale due to the monotonic increase in brightness and because there is a basis for remembering
the colour order that is based on experience. It increases monotonically with luminance, but not with any of the other opponent colour channels.
Actually, the user can associate a value range or spe-cific values to the colour scale. That is because some metric may have two or more nonconsecutive values or even non-numeric values. For example, the Model Transformer cre-ated for the Orion tool [15] provides metrics for each ele-ment regarding the concurrency level, merge effort, and sug-gested configuration management policy. The last one indi-cates if an element, in this case a class, should be subjected to a pessimistic (i.e., lock) or optimistic (i.e., merge) pol-icy. Consequently, the corresponding values for this metric are: ‘pessimistic’, ‘optimistic’, or ‘any’. This is a practical case where specific values were used. For each one of the three values, a different colour was associated according to a specific colour scale. Therefore, in this implementation, we were able to see over time whether a class is expected to be developed in a concurrent manner, indicated by an op-timistic policy, or not, as indicated by a pessimistic policy. The inconclusive cases are painted with the colour corre-sponding to the ‘any’ value. Again, the mechanism may im-prove awareness in a team that uses Orion suggestions to build its configuration management policies (Fig.6).
Fig. 6 Orion results in the EvolTrack tool
3.3 Perceiving design evolution
As the software development goes on, EvolTrack period-ically collects structural information about it. This struc-tural information includes class names, attributes, methods, packages, and relationships. All this information is used to reverse engineer the corresponding software design, also called emerging design. Each time a new design version is generated, it is stored in a data structure called project cle. Therefore, at a given moment in time, a project lifecy-cle contains a set of intermediate software design versions where each version represents a previous state of the soft-ware.
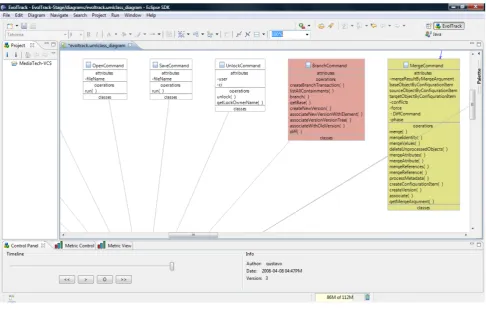
Resuming the example presented in Sect. 2, using the EvolTrack approach, Elton could be aware of any evolu-tion made to the project by simply observing the change on the state of the current model presented by EvolTrack (Scenario 1). In that case, he wanted to detect the correct time to start his new feature implementation. As explained before, this moment would be marked by the implementa-tion of fifteen well-defined classes and their services in the project. Each time a design evolution occurs in the project, EvolTrack detects it and produces a visualization. In this case, each element painted red was created from the previ-ous state of the project and elements painted yellow had just been changed. As it can be seen, our approach allows defin-ing fancy diff representations in the design at different points in time via the configuration of specific metric and colour
scales. Figure7 shows that the last evolution made to the project added three classes and modified four other classes. As it can be seen, the person responsible for such evolution was a developer named Gustavo. Suppose that the Branch-Command class is one of the fifteen classes Elton was wait-ing to develop. By just observwait-ing those red classes, Elton could easily detect that BranchCommand was created at the last evolution made (Fig.8). Exploring it with the zooming feature improves even further the ability to understand and navigate through the diagram.
Additionally, by using this approach Elton did not need to interrupt the work of anybody or even read any piece of code. He could also use EvolTrack to help him with the sec-ond task assigned to him by John (Scenario 2). This task involves the creation of an important feature in the project. Prior to doing that, Elton had to understand the current im-plemented solution and what the steps to achieve it were. Using EvolTrack he could reduce the amount of informa-tion to be understood and, therefore, reduce the complexity of doing such activity. However, EvolTrack is not supposed to solve the information overload problem that may emerge with a large amount of data displayed. One of the main goals here is to address the awareness problem when such scenar-ios appear, although we provide the zooming feature to help with visualizing the design.
in-Fig. 7 Current design of MediaTech-VCS project marked with the evolved and created elements
termediary steps used to build the current solution. Elton can explore this navigation manually or automatically. In the last case, he can define the beginning design version and click on the play button found below the bar. EvolTrack then starts to automatically present each evolution made up to the most current one. Again, by default, EvolTrack shows for each version which elements were created or changed from the previous evolution, according to the current metric view configuration.
The last situation presented in Sect.2shows a scenario where John, the technical leader, wanted to monitor the project progress focusing on its design (Scenario 3). He wanted to verify if the conceptual solution he conceived was truly being followed. Observing the current design of the project as visualized by EvolTrack and his conceptual model, he could identify the elements present in both and the elements present in just one of them. He could also use the timeline to investigate the moment where some concep-tual divergence was introduced into the project. Over again, this solution avoids the need of a regular status meeting to gather this information or even reading any source code, al-leviating project schedule and budget.
4 Feasibility evaluation
We conducted a qualitative study using free/open source software (FOSS) projects to evaluate the use of EvolTrack in a real scenario. The context of FOSS projects was cho-sen because they publish their development artefacts, in-cluding source code, freely through the Internet. Therefore, FOSS projects represent a unique research opportunity in software engineering, considering their diversity, complex-ity, and representativeness of global data. This data can be mined and visualized to help understanding the evolution of the project over time.
In general, FOSS projects are marked by unwaged and collaborative work of geographically distributed developers who spontaneously contribute to the software development effort. The core activities in the FOSS development process are massive parallel development and debugging [5]. Fur-thermore, these projects are characterized by the high qual-ity of the products generated, as assured by peer reviewing, which establishes a critical mass over the software, allow-ing for the fast identification and correction of defects, and restrictive integration policies [17].
Although FOSS projects have been subjected to extensive study, there is little common understanding of the policies that govern its evolution and architecture design. One estab-lished knowledge item is that the evolution of FOSS systems is not well planned, as they evolve in response to the need of users in the FOSS community [13]. Besides, there is usu-ally a person or a group responsible for deciding whether the change requests will be accepted or not.
One problem already identified with the FOSS architec-ture is that it is not clearly documented. Lack of documen-tation on the software architecture is a problem as it makes changing the software an error-prone and counterproductive activity. Thus, this study is also an opportunity to increase the awareness about it.
4.1 Study definition and planning
The definition phase provides the general direction of the study and its scope. The definition of the objectives can be presented in accordance with the structure proposed by Wohlin [24]:
Analyzethe use of EvolTrack in a real scenario With the purpose ofevaluating
With respect tofeasibility, performance, and usability From the point of view of software developers In the context of FOSS projects
The study planning entails three steps. Thefirststep con-sists of the initial selection of FOSS projects to be used in the study. These projects were randomly chosen from the SourceForge portal, according to two technical limita-tions: the source code must have been written in Java and the adopted version control system must be Subversion, as the available EvolTrack connectors are prepared to work with this programming language and repository. As a result, the seven selected projects are: Adempiere, Atunes, Floggy, Freecol, Jedit, JFreeChart, and PDF Split and Merge.
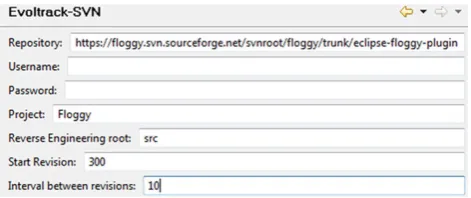
The second step is environment preparation, as it can
be seen in Fig. 9, which means manually configuring the project details in EvolTrack, specifying the following infor-mation: URL of the Subversion site, username, and pass-word (which are usually anonymous to read FOSS projects), project name, the path for the modules we would like to re-verse engineer, first revision to be explored, and the interval between revisions.
Finally, in thethirdstep, EvolTrack is responsible for ex-tracting project information through reverse engineering of its source code. During this phase, each design version of the UML class model is constructed and presented.
4.2 Study execution
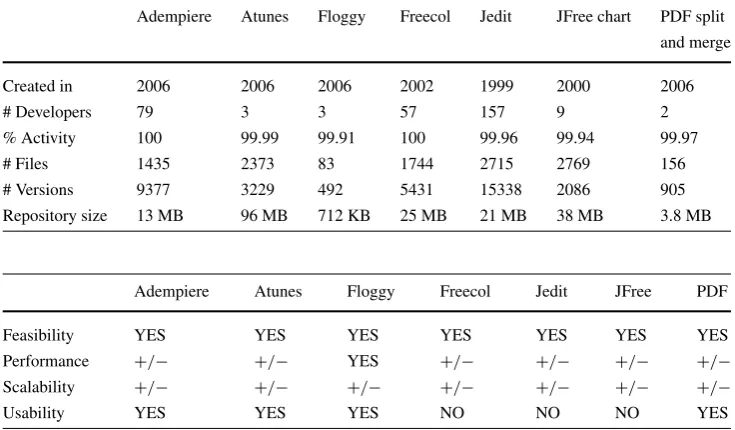
This study was conducted to ascertain the feasibility and us-ability of EvolTrack approach in real projects. The main is-sue we wanted to observe was whether the tool could work with a large amount of data and whether the resulting model could be understood (scalability in terms of performance and visualization, respectively). To perform the study, we gathered data in March 2009 from the seven projects hosted at the SourceForge portal. Table1provides some general in-formation on the projects analyzed, aiming to characterize it.
Based on the information shown in Table1, it is possible to see that the projects vary greatly in their number of de-velopers. Four of them have a small number of developers, two of them have a medium team size and one of them, the largest, has 157 developers in the team.
Besides, the number of developers usually influences the number of available versions. However, it is not possible to detect a correlation between the number of developers and the number of files or repository size. The information on the number of files, number of available versions, and repository size has significant variability among the selected projects. This diversity helps to amplify the scope of the study but can also threaten the study as it is not possible to focus on a specific type of project or generalize the results. According to the percentage of activity inside the project development, all of them are active projects.
This heterogeneity of projects is an interesting context to evaluate the EvolTrack approach as we can observe features such as feasibility, performance, scalability, and usability in a real scenario. However, even with the random choice of projects and the heterogeneity amongst their characteristics, due to the limited number of projects involved in the study,
it is not possible to say that they are representative enough to allow the generalization of the study results to any FOSS project.
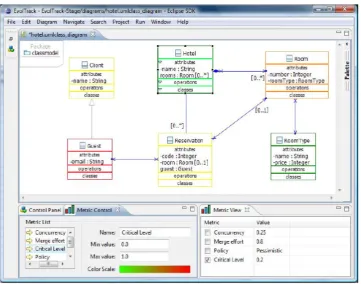
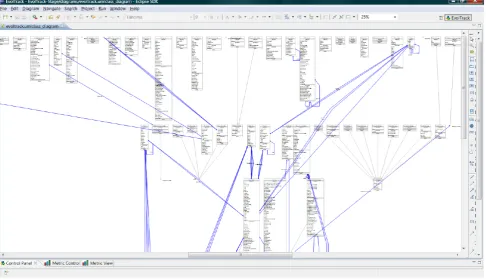
During the study, each project was individually config-ured and executed. The results obtained are summarized in Table 2. In regard to feasibility, the results show that EvolTrack correctly worked in all seven projects. In all cases, it was possible to conclude the three steps planned for the study and to obtain a complete class model. One exam-ple of a resulting model, based on the JEdit project is shown in Fig.10.
In regard to performance, the results indicate that some time consuming activities must be executed during the ini-tial design recovering phase. However, subsequent activities are executed in a reasonable time frame. In fact, this ini-tial design recovering phase took more than one hour in al-most all the projects for the first execution, except Floggy, which was very small. This delay is acceptable because, tak-ing JEdit as an example, this first load means checktak-ing-out each of the 15,338 configurations from the repository and, for each configuration, reverse engineering all 2,715 files presented in it. This represents a total reverse engineering effort of around 42 million files. Nevertheless, it is impor-tant to note that this time consuming processing is executed just once in the whole project lifecycle. From that moment on, we only need to add the diff information to retrieve the next versions of the model.
On scalability, in the first round of execution, when it was necessary to analyze different versions of each project as a whole, EvolTrack displayed some memory limitations. Thus, we needed to choose some specific modules to eval-uate. The analysis of this shortcoming brought the need to configure environment variables, such as memory allo-cation. After the environment preparation, in the second
Table 1 Project general
information Adempiere Atunes Floggy Freecol Jedit JFree chart PDF split
and merge
Created in 2006 2006 2006 2002 1999 2000 2006
# Developers 79 3 3 57 157 9 2
% Activity 100 99.99 99.91 100 99.96 99.94 99.97
# Files 1435 2373 83 1744 2715 2769 156
# Versions 9377 3229 492 5431 15338 2086 905
Repository size 13 MB 96 MB 712 KB 25 MB 21 MB 38 MB 3.8 MB
Table 2 Results of evaluation
execution Adempiere Atunes Floggy Freecol Jedit JFree PDF
Feasibility YES YES YES YES YES YES YES
Performance +/− +/− YES +/− +/− +/− +/−
Scalability +/− +/− +/− +/− +/− +/− +/−
Fig. 10 Project JEdit
round of execution, EvolTrack worked properly for all seven projects used.
Finally, on the subject of usability, the results of our sam-ple projects vary according to their size. The graph in Fig.11 demonstrates the variance in the number of classes ana-lyzed for each project. Considering the number of classes included in each model, the usability was satisfied in most of the projects. It was possible to visualize and understand the whole UML class model in these projects. However, in the biggest models (e.g., Fig.10), it is possible to notice the need of new features in EvolTrack to deal with this visu-alization complexity. In fact, these observations motivated the creation of the feature that uses red and yellow colours to highlight changes over time, as previously presented in Sect.3.3.
4.3 Result analysis
The goal of this section is to discuss the results achieved in the evaluation study, in contrast with study objectives. These results are analyzed according to two perspectives: the strengths and weaknesses identified in the EvolTrack ap-proach.
Considering the strength perspective, the results support the fact that the EvolTrack approach operated correctly, even with large amounts of data. It means that it appears to be
Fig. 11 Graph for number of classes
feasible to use in real projects, despite project size or com-plexity. However, as a future evaluation, it is still necessary to verify the confidence of the recovered design model from source code. We also argue that, after some initial time in-vestment, the performance of upcoming activities is not a risk for the project normal progress.
add navigation possibilities to the grouped elements. When combined, these features help improve the awareness of de-velopers and managers, thus being planned for the next ver-sion of EvolTrack.
Besides these obvious difficulties with large models, the usability also needs an evaluation that considers the point-of-view of several people to gather other potential limi-tations. In this sense, heuristic evaluation is an informal method for usability analysis where a number of evaluators are presented with an interface and asked to comment on it [14]. People can conduct this evaluation relying on a small set of heuristics such as the nine basic usability principles from [11]. The usability evaluation with Nielsen heuristics is planned as part of future work.
As a limitation, this evaluation study followed a qualita-tive observational approach and cannot be considered as a case study as defined by Yin [25]. Furthermore, the small amount of samples, consisting of only seven projects, pre-vents the generalization of the results. Although these initial findings cannot be considered as strong evidence, they help identify some adjustment opportunities in the EvolTrack ap-proach and to plan its future use.
In anticipating some perspectives for future research, it is possible to envision the development of a new datasource connector for Git that is a version control system with in-creasing use in FOSS development projects. Besides, we can also consider the idea of creating a generic datasource con-nector that could integrate with any version control system. This could be achieved using mechanisms such as Maven SCM API [1].
5 Related work
One of the first works made on the use of visualization tech-niques in order to explore software structure was that con-ducted by Ball and Eick in the mid-90s [2]. They showed that there are three basic software properties that can be visualized: software structure, runtime behaviour, and the code itself. Along with that, they demonstrated how to vi-sualize code version histories, difference between releases, static properties of code, code profiling and execution hot spots, and dynamic program slices. Virtually all views were based on what they called pixel representation, where each line of code is presented using a small number of colour-coded pixels, therefore, achieving a higher information den-sity.
Aiming at uncovering project structure and understand-ing how it changes over time, Froehlich and Dourish [6] de-veloped the Augur tool that helps exploring lines of code to create a visualization approach of the software structure. Therefore, the tool associates each line of code with a set of information of interest, such as what activity it relates to,
which method or class it belongs to, who was responsible for its creation, amongst other types of information.
Wettel and Lanza [22] use a 3D city metaphor to explore and visualize the evolution of object-oriented software sys-tems. They represent classes as buildings located in districts representing the packages where classes are defined. Metrics are used to define the visual properties of the artefacts dis-played, such as, for example, the number of methods of one class defining its height. Regarding the evolutionary aspect, they provide three visualization techniques: anAge Mapto depict the age distribution, aTime Travelto step through sys-tem history, and aTimelineto capture the entire evolution of a software artefact in a single view.
German et al. [8] define as software traces the informa-tion left by software contributors of a project throughout the development process, such as email lists, Web sites, records in the version control system, releases of the software, doc-umentation, and source code, amongst others. Then the softChange [8] tool was designed to transform these soft-ware traces, using CVS repositories and certain heuristics, into high level information that is presented to the end user.
EvoLens [16] enables a user to view the evolution of the software from multiple dimensions. This approach was de-veloped to work in object-oriented systems. The tool was designed to use versioning systems as the source of infor-mation used to collect data from the software. Specifically speaking, the tool supports data from software developed in Java and kept in a CVS repository. The time is discretized using the dates generated by the versioning system. That is, evolution happens when the check-in of the code happens in CVS whilst the hierarchy of the software is represented by its own structure. In this context, the mechanism used to visualize the structure of the software is based on graphs as a representation and colours, which are used to represent changes in parts of the software. Additionally, a visualiza-tion model characterized by lens [19] (lens-view) is used to reduce the amount of information presented to the user of the tool. Moreover, the EvoLens provides some diagram in-teraction and manipulation features, such as zooming and the filtering of items to display.
development with the appropriate data source connector (Eclipse workspace connector), allowing the playback of any period in the development of the software.
Another related work is the Fraunhofer SAVE tool [4]. It was developed as an Eclipse plug-in for static evaluations of software architectures. It uses software visualization tech-niques to first present the architecture, using visual elements such as UML components and packages, and secondly, to check the compliance of the architecture with some archi-tectural reference provided by the users. In order to do that, it offers three approaches: using reflection models, relation conformance rules, and component access rules. Moreover, for each component relation found in the architecture, the tool assigns one of the three types: convergence, divergence, and absence. The first is a relation between two components that is allowed, or was implemented as intended. The sec-ond means a relation that is not compliant with the planned architecture. The third is a relation that was intended but not implemented.
Carneiro et al. [3] created a tool called SourceMiner, also implemented as an Eclipse plug-in to support the study of how helpful visual interfaces are in supporting mainte-nance tasks. It integrates different visualization paradigms into the so-called views. Thus, the tool provides four kinds of view: a treemap view for showing packages, classes, and methods as nested rectangles; a polymetric view which en-ables the user to analyze and understand complex systems in terms of methods, lines of code, and inheritance hierarchies, without the need for reading source code; and a class and package dependency view, able to arrange classes and pack-ages in a radial graph, linking them as per their dependency links.
Similarly to the EvolTrack tool, the last two approaches were both implemented as Eclipse plug-ins, enforcing this feature (IDE integration) as an important requirement for any approach aimed at supporting software development ac-tivities. Each one has different purposes, although they are all based on software visualization. Nevertheless, it is worth to compare how these three tools (SAVE, SourceMiner, and EvolTrack) produce in the end an architectural snapshot of the system. Both SAVE and SourceMiner only work with data presented on each Eclipse workspace, therefore, pro-ducing local and individual results, whereas EvolTrack is able to produce global and unified results as it always uses one centralized data source (even if the data is retrieved from many individual workspaces). For instance, if a team chooses to use each workspace as a data source, EvolTrack will create a single and unified view representing the union of all this information and present the same result to all par-ties involved. Another interesting point is that those tools do not present a time-based perspective, that is, the evolution is not considered in both cases.
6 Conclusions and future work
This paper presented an approach based on software visu-alization to increase the awareness of design evolution in software projects. As explained, despite the amount of work made so far in the software evolution area, few works were really concerned with providing support to the understand-ing of this important and intrinsic part of the software, as seen from an evolutionary standpoint. Therefore, it is im-portant to state that the main contribution of this work is not to extract UML diagrams from software development projects but to gather scattered information on the project, from individual development workspaces (or from a central repository), into a concise and unified retrospective view of its evolving structure, represented via a uniform and well-known notation.
As a powerful abstraction mechanism, the emerging soft-ware design can be used to better comprehend the current state of software and how it evolves over time. It can dras-tically cut down the amount of information to be analyzed and can provide a less intrusive method to understand the work being done by the other parties. It can also enhance the ability to monitor the project progress, reducing the need to schedule frequent status meetings. Moreover, this kind of approach provides a constant formal communication chan-nel where everybody related to the project can have a single and uniform view of the whole software being developed.
In order to materialize all these ideas, a tool called EvolTrack was built and presented in this paper. It provides a time based approach to observe the emerging design at different points during the development lifecycle. Its exten-sible architecture enables to plug-in connectors to extract data (data source connector) and also to visualize data (view connector). Therefore, the tool is potentially able to interact with any kind of data source, ranging from version control systems to programming environments. In addition, model transformer connectors can be created to enhance the model generated by the data source connector with metrics or some other types of information. This feature enables the tool to be used with other approaches that aim at visualizing data re-lated to the project under a specific perspective. This kind of mechanism can represent a powerful environment to present more relevant information such as refactoring timing. For example, if the trigger to execute a refactoring in a class is a coupling threshold, atransformercan be built to compute this metric and show it via coloured diagrams. If one asso-ciates some specific colour to that threshold, the change in colours can easily point the correct moment to perform the refactoring procedure.
detected by EvolTrack, and a yellow colour is used to mark those elements that have just been modified from the previ-ous evolution. The need for these features was discovered during the qualitative study, as shown in Sect.4. The study shows that, although every single evolution has been suc-cessfully detected and visualized, an awareness loss was de-tected when dealing with medium to large diagrams. This occurred because it became very difficult to identify what changed from one evolution to another.
As it can be seen, there is a wide range of possibili-ties to enhance the proposed approach. Starting with the source of information, other types of data source might be implemented to retrieve data from other places than Sub-version, Odyssey-VCS, or Eclipse, connectors that already exist. The implementation of additional visualization tech-niques will probably enable the handling of larger data sets and increase the usability of the approach. Another very in-teresting point which is currently under development is the use of EvolTrack to create an automatic mechanism to com-pare the conceptual design, represented via watermark, with the emerging design. This activity was mentioned early in this paper but using a manual approach. By automating this, it will certainly save time and significantly increase one’s ability to be aware of the course the software project is tak-ing.
Acknowledgements This work was financially supported by CAPES and CNPq.
References
1. Apache Maven.http://maven.apache.org/
2. Ball T, Eick SG (1996) Software visualization in the large. Com-puter 29(4):33–43
3. Carneiro GDF, Magnavita R et al (2008) Combining soft-ware visualization paradigms to support softsoft-ware comprehen-sion activities. In: Proceedings of the 4th ACM symposium on software visualization. ACM, New York, pp 201–202. doi:10.1145/1409720.1409755
4. Duszynski S, Knodel J et al (2009) SAVE: software architecture visualization and evaluation. In: European conference on soft-ware maintenance and reengineering. IEEE Computer Society, Los Alamitos, pp 323–324. http://doi.ieeecomputersociety.org/ 10.1109/CSMR.2009.52
5. Feller J, Fitzgerald B (2000) A framework analysis of the open source software development paradigm. In: Proceedings of the 21th international conference on information systems. Association for Information Systems, pp 58–69
6. Froehlich J, Dourish P (2004) Unifying artifacts and activities in a visual tool for distributed software development teams. In: Pro-ceedings of the 26th international conference on software engi-neering. IEEE Computer Society, Los Alamitos, pp 387–396 7. Gamma E, Helm R et al (1994) Design patterns: elements of
reusable object-oriented software. Addison–Wesley, Reading 8. German DM, Hindle A (2006) Visualizing the evolution of
soft-ware using softchange. Int J Softw Eng Knowl Eng 16(1):5–22 9. Lehman M (1981) Correction to programs, life cycles, and laws of
software evolution. Proc IEEE 69(4):485
10. Levkowitz H, Herman GT (1992) Color scales for image data. IEEE Comput Graph Appl 12(1):72–80
11. Molich R, Nielsen J (1990) Improving a human-computer dia-logue. Commun ACM 33(3):338–348. doi:10.1145/77481.77486 12. Murta L, Corrêa C et al (2008) Towards odyssey-VCS 2:
improve-ments over a UML-based version control system. ACM, New York, pp 25–30. doi:10.1145/1370152.1370159
13. Nakakoji K, Yamamoto Y et al (2002) Evolution patterns of open-source software systems and communities. In: Proceedings of the international workshop on principles of software evolution. ACM, New York, pp 76–85. doi:10.1145/512035.512055
14. Nielsen J, Molich R (1990) Heuristic evaluation of user inter-faces. In: Proceedings of the SIGCHI conference on human fac-tors in computing systems: empowering people. ACM, New York, pp 249–256. doi:10.1145/97243.97281
15. Prudencio J, Murta L et al (2009) On the selection of concurrency control policies for configuration management. In: Brazilian sym-posium on software engineering (SBES), pp 155–164
16. Ratzinger J, Fischer M et al (2005) EvoLens: lens-view visu-alizations of evolution data. In: Eighth international workshop on principles of software evolution, pp 103–112. doi:10.1109/ IWPSE.2005.16
17. Raymond ES (2001) The cathedral & the bazaar. O’Reilly Media 18. Rheingans P (1999) Task-based color scale design. In:
Proceed-ings applied image and pattern recognition, pp 35–43
19. Sarkar M, Brown MH (1992) Graphical fisheye views of graphs. In: Proceedings of the SIGCHI conference on human factors in computing systems. ACM, New York, pp 83–91. doi:10.1145/142750.142763
20. Silva IAD, Chen PH et al (2006) Lighthouse: coordination through emerging design. In: Proceedings of the 2006 OOPSLA work-shop on eclipse technology eXchange. ACM, New York, pp 11– 15. doi:10.1145/1188835.1188838
21. Westhuizen CVD, Chen PH et al (2006) Emerging design: new roles and uses for abstraction. In: Proceedings of the 2006 inter-national workshop on role of abstraction in software engineering. ACM, New York, pp 23–28. doi:10.1145/1137620.1137626 22. Wettel R, Lanza M (2008) Visual exploration of large-scale system
evolution. In: Proceedings of the 2008 15th working conference on reverse engineering. IEEE Computer Society, Los Alamitos, pp 219–228
23. Winograd T (1996) Bringing design to software. ACM, New York 24. Wohlin C, Runeson P et al (1999) Experimentation in software
engineering: an introduction. Springer, Berlin