R E S E A R C H
Open Access
A multiplex financial network approach to
policy evaluation: the case of euro area
Quantitative Easing
Chiara Perillo
*and Stefano Battiston
*Correspondence:
FINEXUS Center for Financial Networks and Sustainability, Department of Banking and Finance, University of Zurich, Zurich, Switzerland
Abstract
Over the last decades, both advanced and emerging economies have experienced a striking increase in the intra-financial activity across different asset classes and increasingly complex contract types, leading to a far more complex financial system. Until the 2007-2008 crisis, the increased financial intensity and complexity was believed beneficial in making the financial system more resilient and less vulnerable to shocks. However, in 2007-2008, the advanced economies suffered the biggest financial crisis since the 1930s, followed by a severe post-crisis recession, questioning the adequacy of traditional tools in predicting, explaining, and responding to periods of financial distress. In particular, the effect of complex interconnections among financial actors on financial stability has been widely acknowledged. A recent debate focused on the effects of unconventional policies aimed at achieving both price and financial stability. Among these unconventional policies, Quantitative Easing (QE, i.e., the large-scale asset purchase programme conducted by a central bank upon the creation of new money) has been recently implemented by the European Central Bank (ECB). In this context, two questions deserve more attention in the literature. First, to what extent, the resources provided to the banking system through QE are transmitted to the real economy. Second, to what extent, the QE may also alter the pattern of intra-financial exposures and what are the implications in terms of financial stability. Here, we address these two questions by developing a methodology to map the multilayer macro-network of financial exposures among institutional sectors across financial instruments (i.e., loans and deposits, debt securities, and equity), and we illustrate our approach on recently available data. We then test the effect of the implementation of ECB’s QE on the time evolution of the financial linkages in the multilayer macro-network of the euro area, as well as the effect on macroeconomic variables, such as consumption,
investment, unemployment, growth, and inflation.
Keywords: Unconventional monetary policy, Expanded Asset Purchase Programme, Quantitative Easing, Real economy, Financial stability, Multilayer network,
Macro-network, Financial network
Introduction
Over the last decades, both advanced and emerging economies have experienced a strik-ing increase in the financial interactions among the different actors operatstrik-ing in the global economy, via different financial instruments. A large part of these interactions is intra-financial (D’Errico and Roukny2017), meaning that a great portion of banks’ financial contracts has as a counterparty another bank or another financial institution (such as
investment funds, insurance corporations, and pension funds). As a consequence, a large fraction of financial system’s assets is intra-financial (Allahrakha et al.2015). This growth in the financial activity was spread across different asset classes and contract types and went along a deep transformation of the intermediation system that connects end bor-rowers with end savers (Turner2017). In particular, this transformation was based on complex innovations of existing financial instruments leading to the emergence of com-plex financial activities (such as credit securitization1 and credit structuring2), as well
as the origin of new complex financial instruments (such as Collateralized Loan Obliga-tions3, Collateralized Debt Obligations4, and Credit Default Swaps5) and, therefore, to a far more complex financial system (Turner2017).
the credit demand side, firms and households may be able to borrow more and spend less to repay their debts, while, on the credit supply side, the availability of new liquid-ity may stimulate bank lending activliquid-ity. If so, consumption and investment may receive a boost and support economic growth and job creation and, as prices rise, the ECB achieves an inflation rate below, but close to, 2% over the medium term (European Cen-tral Bank2017c). Consequently, according to the ECB’s narrative, QE may generate the increase in bank credit to the real economy and all the subsequent aforementioned chain of effects. However, QE does not necessarily imply that the resources received by banks are going to be lent to the real economy. In fact, on the one hand, businesses and house-holds could be not willing or able to borrow more from banks. On the other hand, banks could either decide to i) keep the money in form of deposits at the ECB (with low or even negative rate of return, but risk-free), or ii) invest it in the stock market (whose returns may be more appealing compared to the decreased returns of the securi-ties purchased under the APP), as well as iii) increase the intra-financial interactions via different financial instruments (e.g., increasing intra-financial loan, bond, and equity con-tracts). This may lead to the alteration of the pattern of intra-financial exposures among financial actors (including banks, investment funds, insurance corporations, pension funds, and other financial institutions), with potential implications in terms of financial stability.
Despite there have been some efforts in the recent macroeconometric literature to investigate the effects of unconventional monetary measures, the exploration of the trans-mission of the recently implemented APP to the real economy and its implications on financial stability from a complex-network perspective would be of great importance. In particular, a financial network analysis would allow to account for the complex intra-financial interconnections and their potential effects on intra-financial stability, neglected by traditional tools. Network theory has been widely applied in the financial domain to provide useful insights and predictions on the interconnectivity of the financial system and on the propagation of shocks, especially with reference to the banking sector (Eisenberg and Noe2001; Elsinger et al.2006; Battiston et al.2012; Roukny et al.2013; Battiston et al. 2016). However, less attention has been devoted to the study of the interplay between monetary policy, macroeconomic variables, and network of finan-cial exposures, able to take into account both the interactions between the real and the financial sector and intra-financial interconnectedness (Perillo and Battiston2017). In particular, in the light of the above context, two fundamental questions deserve more attention in the literature:
1. To what extent, the resources provided to the banking system through QE are transmitted to the real economy?
2. To what extent, the QE may alter the pattern of intra-financial exposures among financial actors and what are the implications in terms of financial stability?
Households, Non-Financial Corporations, and General Governments) and the rest of the world. In particular, differently from Perillo and Battiston (2017), we regard this macro-network as a multilayer weighted macro-network in which the multiple layers correspond to different financial instruments. Second, we illustrate our approach on a novel hand-matched dataset, that we have built based on recently available data by extending our focus to i) loans and deposits, ii) private and public debt securities, iii) APP securities, and iv) shares and other equity. Third, we investigate the financial linkages in the multilayer macro-network of financial exposures both from a static and a dynamic perspective in an attempt to capture i) the transmission of QE to the real economy through the increase of the interactions between the banking sector and the real sector, and ii) the level of intra-financial interconnectedness of the euro area, through the increase of the intra-intra-financial interactions via loans and deposits, securities, and equity, since the implementation of QE. Finally, we extend the assessment of the macroeconomic effects of QE, by exploring the time evolution of i) private and public consumption, ii) private and public invest-ment, iii) Gross Domestic Product (GDP), iv) Harmonised Unemployment Rate (HUR), and v) Harmonised Index of Consumer Prices (HICP). The combination of network variables (i.e., financial linkages of the multilayer macro-network) and macroeconomic variables allows us to shed light on the implications of QE both in terms of stimula-tion of the real economy and intra-financial interconnectedness. This novel approach represents a tangible step ahead in the comprehensive analysis of the effects of uncon-ventional monetary policy, which until now involved macroeconomic effects or financial markets’ impact, neglecting network effects and their interplay with macroeconomic variables.
The remainder of this paper is organized as follows. In “Methodology” section, we intro-duce the methodology that we developed to map the multilayer macro-network of finan-cial exposures among the different institutional sectors operating in the euro area and the rest of the world, across the main classes of financial instruments. In “Data” section, we illustrate the employed network and macroeconomic variables. In “Exploratory results” section, we present the exploratory results both from a static and a dynamic perspective. Finally, “Conclusion” section concludes the paper.
Methodology
of the World (RW)includes the financial sector, the real sector and the non-financial pub-lic sector, at an aggregate level, operating in non-euro area countries, with an outstanding exposure to the institutional sectors operating in the euro area countries. The institutional sectors considered in our study with relative acronyms and definitions are summarized in Additional file1: Table SI1.
Building on Perillo and Battiston (2017), we regard the euro area economy described above as a macro-network of financial exposures, where nodes are the aforementioned institutional sectors operating in the euro area (i.e.,Eurosystem, Monetary Financial Insti-tutions excluding the Eurosystem, Other Financial InstiInsti-tutions, Non-MMF Investment Funds, Insurance Corporations and Pension Funds, Households, Non-Financial Corpo-rations, and General Governments) and the Rest of the World. It is worth mentioning that every node is the result of an aggregation on two dimensions: by country and by institutional sector. In particular, the euro area macro-network of financial exposures includes the nineteen macro-networks of financial exposures among the institutional sec-tors operating in the nineteen countries belonging to the Eurozone and their mutual interactions. Further, every node of the macro-network should be regarded as a network of micro-based granular financial exposures among the different institutions operating within every institutional sector (Perillo and Battiston2017). Figure1visually illustrates the aforementioned process of aggregation.
Differently from Perillo and Battiston (2017), we regard the euro area macro-network of financial exposures as a multilayer weighted network in which the multiple layers correspond to different financial instruments. In particular, our study focuses on four categories of financial instruments: i) loans and deposits; ii) private and public debt secu-rities; iii) APP securities (i.e., private and public securities massively purchased by the Eurosystem from the banking system for monetary policy purposes within the APP13), and iv) shares and other equity14. Links are the financial dependencies through which the different institutional sectors are tied to each other. More specifically, links start from the institutional sector that holds the financial instrument (source) and point to the sector that issued it (target). Weights correspond to our estimate of the direct financial exposures
existing among the different institutional sectors through the different financial instru-ments, based on the balance sheet amount at the end of the period (stock) and their weight on the total financial assets of the holding institutional sector. Formally, direct exposures among financial actors are estimated in the following way:
DEi= ⎛ ⎝n
j=1
βLoans&deposits
ij +βijSecurities+βijAPP securities+β Equity ij
⎞
⎠+Ri, (1)
whereβijdenotes the monetary value of the exposure of institutional sectorito the insti-tutional sectorsjvia the different considered financial instruments,nis the number of institutional sectors (or nodes) considered in our analysis, whileRiis a residual, account-ing for the exposures to sectors or via instruments that we are not consideraccount-ing in our analysis.
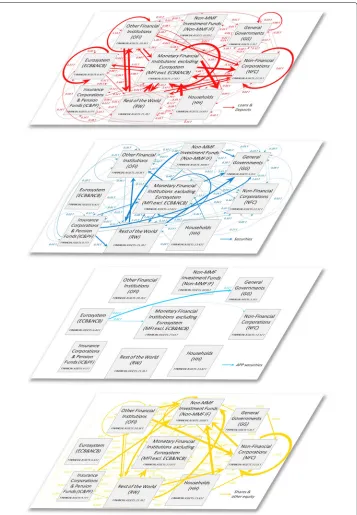
Figure 2 illustrates the multilayer macro-network of financial exposures among the different institutional sectors of the euro area and the rest of the world, via loans and deposits, private and public debt securities, APP securities, and shares and other equity, with reference to the second quarter of 2017.
The analysis of the euro area financial system as a multilayer financial network allows us to obtain relevant insights on the challenging problem of estimating the financial interde-pendencies existing between the banking sector and both the real and the financial sector. In fact, this approach enables to account for the relevant direct and indirect exposures via the different financial instruments considered together. Further, the multilayer macro-network analysis also provides us with a map of the potential channels through which distress may propagate as a consequence of shocks of different nature. These insights could not be obtained with a single-layer analysis, in fact, by looking at a single layer at a time, one may fail to detect instability, underestimating the systemic importance and the vulnerability of the nodes in the network.
In an attempt to demonstrate that a single-layer analysis may lead to the underesti-mation of the systemic importance and the vulnerability of the nodes in the network, we compute different network statistics both on the single-layer macro-networks and on the multilayer macro-network of financial exposures. In particular, building on Opsahl et al. (2010), we compute a generalization of the weighted and non-weighted version of the degree, closeness and betweenness centrality measures. These centrality measures are able to take into account both the number of ties, as typical for non-weighted net-work measures, and the tie weights, as common in weighted netnet-work metrics, allowing for attributing different relative importance to the number of ties compared to the tie weighs in contributing to the centrality of a node. More specifically, with reference to the degree centrality, (Opsahl et al.2010) proposed the following measures as a compromise betweeen the weighted and non-weighted degree metrics:
CwDα−out(i)=kiout(1−α)×souti α (2)
and
CwDα−in(i)=kiin(1−α)×sini α, (3)
links directed to nodei, respectively. Further,souti andsini correspond to the out-strenght and in-strenght centrality measures, firstly introduced by Barrat et al. (2004), which are computed on weighted networks, as they are defined as the sum of the weights attached to the outgoing links and to the incoming links of a generic nodei, respectively. Lastly,
α is a tuning parameter that allows for attributing different relative importance to the number of ties compared to the tie weighs in contributing to the centrality of a node. For example, whenα = 0,CDwα−out(i)andCDw−αin(i)values equal the node out- and in-degree
i.e.,kioutandkini , while whenα = 1, theCDwα−out(i)andCDw−αin(i)values equal the node out- and in-strengthi.e., souti andsini . Therefore, settingα = 0.5 implies that the same importance is attributed to number of ties and tie weights in contributing to the centrality of a nodei. Similarly to the degree centrality, (Opsahl et al.2010) proposed the following formulations for the closeness and the betweenness centrality measures, respectively:
CwCα(i)= ⎛ ⎝n
j=1
dwα(i,j) ⎞ ⎠
−1
, (4)
wheredwα(i,j)is shortest path between two nodesiandjdefined as:
dwα(i,j)=min 1
(wih)α + · · · + 1 whj α , (5) and
CwBα(i)= g wα
jk (i)
gjkwα , (6)
wheregjkwα is the number of shortest paths between two nodes (dwα(j,k)),gjkwα(i)is the number of those paths that go through node i, and α is the aforementioned tuning parameter.
Further, building on Kaushik and Battiston (2013) and Junker and Schreiber (2011), we compute the weighted version of the Katz centrality, able to measure the influence of nodes taking into account the total number of walks between a pair of nodes, given by:
CwK(i)= ∞
k=1
n
j=1
γkAk
ij, (7)
whereAis the weighted adjacency matrix of the network under consideration, the power ofAindicates the presence (or absence) of links between two nodes through interme-diaries, andγ is an attenuation factor15, employed to penalize connections made with distant neighbors.
hi(t+1)=min ⎧ ⎨
⎩1,hi(t)+ n
j=1
(1−RR)lbijhj(t)−hj(t−1) ⎫ ⎬
⎭, (8)
wherehi(t+1)andhi(t)correspond to the individual vulnerability of nodeiat timet+1 and at timet, respectively,RRis the recovery rate (i.e., the amount recovered through foreclosure or bankruptcy procedures in the event of a default, expressed as a percentage of face value),lbijis the leverage ratio of nodeiwith respect toj, given by the ratio between the assets of nodeiinvested in nodejand the equity (i.e., difference between assets and liabilities) of nodei, andhj(t)andhj(t−1)correspond to the vulnerability of nodejat timetandt−1, respectively.
Data
The empirical analysis has been conducted both from a static and a dynamic perspective, with regard to the second quarter of 2017, and the period spanning from the first quarter of 1999 to the second quarter of 2017 (1999Q1-2017Q2, both quarters included), respec-tively, considering eight institutional sectors operating in the euro area (i.e.,Eurosystem, Monetary Financial Institutions excluding the Eurosystem, Non-MMF Investment Funds, Insurance Corporations and Pension Funds, Households, Non-Financial Corporations, and General Governments) and theRest of the World17. In particular, we have analyzed balance sheet and macroeconomic data from various sources18, relative to the nineteen European Union’s Member States belonging to the EMU. Our analysis is based on two categories of variables: i) network variables, i.e., the financial exposures via loan, bond, and equity contracts, through which the euro area sectors are tied to each other; and ii) macroeco-nomic variables, i.e., i) private and public consumption, ii) private and public investment, iii) Gross Domestic Product (GDP), iv) Harmonised Unemployment Rate (HUR), and v) Harmonised Index of Consumer Prices (HICP). The combination of the network vari-ables and macroeconomic varivari-ables allows us to shed light on the implications of QE both in terms of stimulation of the real economy and financial stability. A detailed illustration and definition of the analysed variables, the way how we have computed them and the sources and limitations of row data are provided in the Additional file1(Section SI3).
Exploratory results
Overview of the euro area economy
Fig. 3Breakdown of the euro area institutional sectors’ and rest of the world’s financial assets by instrument type; June 2017. Breakdown of the euro area institutional sectors’ financial assets by instrument type, i.e., short-term and long-term loans and deposits (in red), short-term and long-term private and public debt securities (in blue), APP securities (in light blue), listed, unlisted, and investment fund shares and other equity (in yellow), and other financial assets (in grey). The residual category “other” includes i) monetary gold and Special Drawing Rights (SDRs) (totally held by Monetary Financial Institutions), ii) insurance and pension schemes (mostly, i.e., the 93.86%, held by Households), and iii) other accounts receivable and financial derivatives (mostly, i.e., the 50.66%, held by Non-Financial Corporations). Data source: (European Central Bank 2017b)
hand, loans and deposits granted in the euro area are mostly owed byMonetary Financial InstitutionsandNon-Financial Corporations. As regards debt securities held and issued in the euro area, whileMonetary Financial Institutions, Rest of the WorldandNon-MMF Investment Fundsare the main holders,General GovernmentsandRest of the Worldare the main issuers. With particular reference to the private and public securities purchased within the APP, not surprisingly, the only holder is theEurosystem, while the main issuer is the institutional sectorGeneral Governments. In particular, until December 2017, within the APP, the Eurosystem carried out public sector security purchases amounting to about 1.89 trillion euros, out of the total asset purchases amounting to about 2.29 trillion euros (European Central Bank2017a). The main players of the euro area equity market areRest of the World, Non-Financial Corporations, andOther Financial Institutionson the asset side (holdings), andNon-Financial Corporations, Rest of the World, Non-MMF Investment Funds,andOther Financial Institutionson the liability side (issuances). Lastly, concerning the residual category “other” of the liability side, it includes also the euro area institutional sectors’ net worth. In this regard, it is worth mentioning that it is positive for all the insti-tutional sectors, exceptNon-Financial Corporations, General Governments(significantly negative) andNon-MMF Investment Funds(slightly negative), with the highest net worth forHouseholdsand the lowest forNon-Financial Corporations.
The euro area multilayer macro-network of financial exposures
The static perspective
In an attempt to investigate the implications of QE both in terms of stimulation of the real economy and intra-financial interconnectedness, we first analyse the euro area multilayer macro-network of financial exposures from a static perspective. In particular, first, we separately investigate the different layers of the euro area multilayer macro-network of financial exposures, with a particular focus on direct exposures. Second, we focus on the comprehensive analysis of the euro area financial system as a multilayer macro-network, by considering direct and indirect financial exposures among institutional sectors across the different financial instruments. Figures5,6,7and8illustrate the macro-networks of financial exposures among the different institutional sectors of the euro area and the rest of the world, with reference to the second quarter of 2017, via loans and deposits, debt securities, APP securities, and shares and other equity, respectively, while Fig.9illustrates the euro area as a multilayer macro-network of financial exposures via all the aforemen-tioned financial instruments. Links are the financial dependencies through which the different institutional sectors are tied to each other. In particular, links start from the institutional sector that holds the financial instrument and point to the sector that issued it. Weights correspond to the balance sheet outstanding amount at the end of the period (stocks) of loan and deposit, debt security, APP security, and share holdings/issuances, and they are expressed in trillion euros in Figs.5,6,7and8, and as a percentage of the total assets of the source institutional sector in Fig.9. Due to the fact that our main aim is to investigate whether the resources received by banks through QE are actually stimulating the real economy via loans, bonds, and equity or they are staying into the financial sys-tem, our main focus is on the links starting from the nodeMonetary Financial Institutions excluding the Eurosystem.
Fig. 5The euro area macro-network of financial exposures via loans and deposits; June 2017. The macro-network of financial exposures among the different institutional sectors operating in the euro area (i.e., Eurosystem (ECB&NCB), Monetary Financial Institutions excluding the Eurosystem (MFI excl. ECB&NCB), Other Financial Institutions (OFI), Non-MMF Investment Funds (Non-MMF IF), Insurance Corporations and Pension Funds (IC&PF), Households (HH), Non-Financial Corporations (NFC), and General Governments (GG)), and the Rest of the World (RW), via short-term and long-term loans and deposits (represented with red links), with reference to the second quarter of 2017. Weights represent the outstanding financial exposures of a source institutional sector to a target institutional sector expressed in trillion euros. Data source: (European Central Bank2017b)
Fig. 7The euro area macro-network of financial exposures via APP securities; June 2017. The macro-network of financial exposures among the different institutional sectors operating in the euro area (i.e., Eurosystem (ECB&NCB), Monetary Financial Institutions excluding the Eurosystem (MFI excl. ECB&NCB), Other Financial Institutions (OFI), Non-MMF Investment Funds (Non-MMF IF), Insurance Corporations and Pension Funds (IC&PF), Households (HH), Non-Financial Corporations (NFC), and General Governments (GG)), and the Rest of the World (RW), via private and public debt securities purchased within the APP (represented with light blue links), with reference to the second quarter of 2017. Weights represent the outstanding financial exposures of a source institutional sector to a target institutional sector expressed in trillion euros. Data source: (European Central Bank2017b)
Households, followed by bank-to-bank loans and deposits and loans to Non-Financial Corporations, amounting to around 5.49, 4.48, and 4.32 trillion euros, respectively. More specifically, from the macro-network analysis of the financial exposures via loans and deposits, we can notice that, despite the fact that a large fraction of loans and deposits granted by Monetary and Financial Institutions is intra-financial (7.53 trillion euros), the most relevant portion is granted by the private banking sector to the real sec-tor (9.81 trillion euros), followed by loans and deposits to the Rest of the World and public sector (amounting to 2.65 and 1.05 trillion euros, respectively). Unfortunately, available data on the institutional sectorRest of the Worlddo not allow us to discrim-inate between real sector and financial sector of non-euro area countries receiving the aforementioned amount of loans and deposits by the euro area private banking sys-tem. Moreover, it is worth mentioning that, the disaggregation of Monetary Financial Institutions in Eurosystem andMonetary Financial Institutions excluding the Eurosys-tem, not only from the point of view of the sector granting the loans and deposits, such as in Perillo and Battiston (2017), but also from the perspective of the institutional sec-tor receiving them, allows us to discriminate among bank-to-bank loans and deposits (4.48 trillion euros), loans and deposits granted by the private banking system to the Eurosystem (1.72 trillion euros), and loans and deposits granted and received within the Eurosystem (2.27 trillion euros). The latter category belongs to the so-called TARGET bal-ances, i.e., intra-Eurosystem assets and liabilities of central banks’ balance sheet resulting from net cross-border payments in the form of central bank reserves, via the Eurosys-tem real-time payment sysEurosys-tem, which settles continuously euro-denominated payments on an individual transaction-by-transaction basis without netting (called TARGET2) (Eisenschmidt et al.2017).
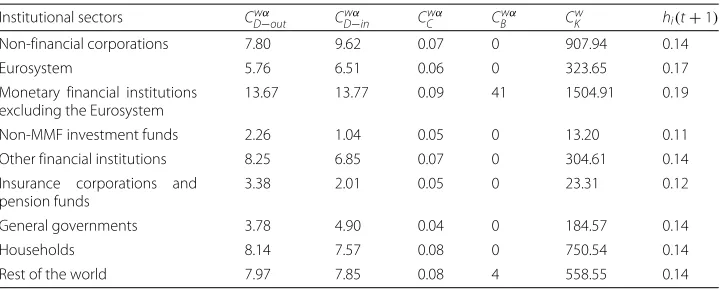
Table1reports some network statistics (see “Methodology” section) computed on the loan and deposit macro-network of financial exposures. In particular, we have computed the generalized version of the degree, closeness and betweenness centrality measures defined in Eqs.2–6, after setting the tuning parameterα equal to 0.5. Further, we have calculated the Katz centrality given by Eq.7, and a measure of nodes’ vulnerability coming from the generalized version of DebtRank defined by Eq.8, where we have set the initial shock equal to 0.1, and the recovery rate equal to its conventional value of 0.6. More-over, due to the fact that three of the institutional sectors under consideration exhibit a negative equity, we have estimated the financial distress propagation process (Eq.8) by replacing the leverage matrix with the matrix of the financial exposures via which the different institutional sectors are tied to each other relative to the total financial assets of the source institutional sector (Castrén and Rancan2014). As shown in Table 1,Monetary and Financial Institutions excluding the Eurosystemexhibit the highest out-degree and in-out-degree. This result is confirmed by the closeness, betweenness, and Katz centrality measures, according to which the most central node in the loan and deposit macro-network isMonetary and Financial Institutions excluding the Eurosystem. More-over, from the computation of the DebtRank financial distress propagation process, we can derive thatMonetary and Financial Institutions excluding the Eurosystemis also the most vulnerable node in the loan and deposit macro-network.
Table 1Network statistics - loan and deposit layer
Institutional sectors Cwα
D−out CwD−αin CwCα CBwα CwK hi(t+1)
Non-financial corporations 7.80 9.62 0.07 0 907.94 0.14
Eurosystem 5.76 6.51 0.06 0 323.65 0.17
Monetary financial institutions excluding the Eurosystem
13.67 13.77 0.09 41 1504.91 0.19
Non-MMF investment funds 2.26 1.04 0.05 0 13.20 0.11
Other financial institutions 8.25 6.85 0.07 0 304.61 0.14
Insurance corporations and pension funds
3.38 2.01 0.05 0 23.31 0.12
General governments 3.78 4.90 0.04 0 184.57 0.14
Households 8.14 7.57 0.08 0 750.54 0.14
Rest of the world 7.97 7.85 0.08 4 558.55 0.14
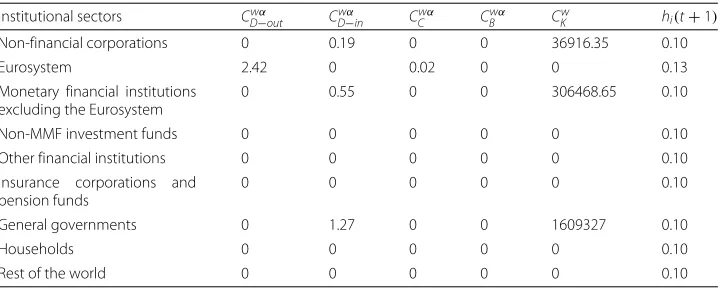
issued byMonetary Financial Institutions excluding the Eurosystem(1.13 trillion euros), Rest of the World (1.06 trillion euros), and Other Financial Institutions (1.00 trillion euros).Non-financial CorporationsandInsurance Corporations and Pension Fundsplay only a minor role as issuing counterparties of the securities held by Monetary Finan-cial Institutions excluding the Eurosystem. The fact thatGeneral Governmentsplay a key role as an issuing counterparty of the securities held byMonetary Financial Institutions excluding the Eurosystemcould be explained as follows. The expectation of the public security purchases by the Eurosystem and the subsequent increase in the prices of the purchased securities may have generated an increase in the purchases of public securi-ties by the private banking sector in order to sell them to theEurosystem. However, our data, being data on holdings and issuances, are not able to provide empirical evidence of the aforementioned speculation. On the other hand, with particular reference to the APP securities, as we can see from Fig.7, at the end of the second quarter of 2017, the largest fraction of APP securities held by theEurosystemwas issued by the institutional sector General Governments, amounting to 1.61 trillion euros, followed by securities issued by Monetary Financial Institutions excluding the Eurosystem(0.31 trillion euros), and Non-Financial Corporations(0.04 trillion euros). In fact, the majority of purchases carried out by the Eurosystem within the APP until now have been public sector security purchases (European Central Bank2017a).
Table 2Network statistics - debt security layer
Institutional sectors Cwα
D−out CDw−αin CwCα CBwα CKw hi(t+1)
Non-financial corporations 1.22 3.21 0.01 0 2434.44 0.10
Eurosystem 1.81 0 0.02 0 0 0.11
Monetary financial institutions excluding the Eurosystem
5.48 6.01 0.02 6 10074.38 0.12
Non-MMF investment funds 5.23 0.12 0.04 0 60.99 0.14
Other financial institutions 2.52 5.66 0.02 7 12313.89 0.11
Insurance corporations and pension funds
4.97 0.74 0.04 0 192.56 0.14
General governments 1.63 8.18 0.01 0 21109.68 0.11
Households 2.24 0 0.02 0 0 0.10
Rest of the world 4.73 6.34 0.03 17 8617.51 0.12
Fundsare the most vulnerable nodes in the debt security macro-network, theEurosystem exhibits the highest vulnerability in the APP security macro-network.
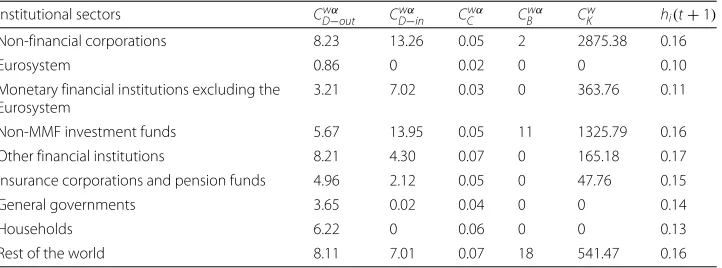
Concerning the equity layer, represented in Fig.8, at the end of June 2017, the largest exposure exhibited by Monetary Financial Institutions excluding the Eurosystem via shares and other equity was toNon-MMF Investment Funds, amounting to 0.61 trillion euros, followed by Rest of the World (0.49 trillion euros), Monetary Financial Insti-tutions excluding the Eurosystem(0.32 trillion euros), andNon-Financial Corporations (0.24 trillion euros). More specifically, from the macro-network analysis of the finan-cial exposures via shares and other equity, we can notice that a very large part of the equity held by the private banking system is intra-financial (0.99 trillion euros), followed by equity issued by theRest of the World20 and the real sector (amounting to 0.49 and 0.24 trillion euros, respectively). This result could be interpreted as concerning for the following reason. The larger fraction of bank equity investments in the financial sector compared to the real sector seems to suggest the private banks’ preference for investments in financial services rather than in non-financial goods and services. This is consistent with the process of financialization, according to which, a large fraction of bank resources are addressed to finance (Allahrakha et al.2015), that mostly funds the purchase of assets that already exist, rather than to businesses, that can employ them in financing new capital investments (Turner2017).
Table4reports some network statistics (see “Methodology” section) computed on the equity macro-network of financial exposures. As shown in Table 4, according to the
Table 3Network statistics - APP security layer
Institutional sectors CwD−αout CDw−αin CwCα CBwα Cw
K hi(t+1)
Non-financial corporations 0 0.19 0 0 36916.35 0.10
Eurosystem 2.42 0 0.02 0 0 0.13
Monetary financial institutions excluding the Eurosystem
0 0.55 0 0 306468.65 0.10
Non-MMF investment funds 0 0 0 0 0 0.10
Other financial institutions 0 0 0 0 0 0.10
Insurance corporations and pension funds
0 0 0 0 0 0.10
General governments 0 1.27 0 0 1609327 0.10
Households 0 0 0 0 0 0.10
out-degree and Katz centrality the most central node in the equity macro-network is Non-Financial Corporations. However, this result is not confirmed by the in-degree, the closeness, nor the betweenness centrality measures, according to which the most central nodes in the equity layer areNon-MMF Investment Funds, Other Financial Institutions, andRest of the World, respectively. Lastly, according to the DebtRank financial distress propagation process, the most vulnerable node in the equity macro-network is Other Financial Institutions.
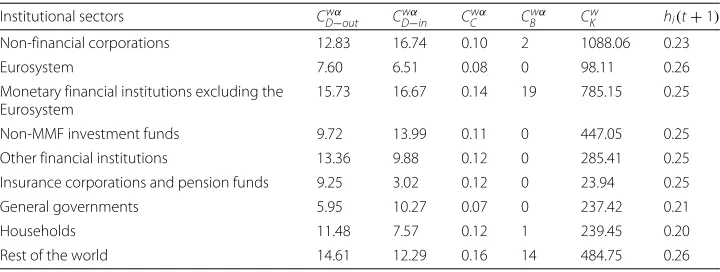
Lastly, Fig.9provides us with a comprehensive picture of the existing financial expo-sures among the different institutional sectors operating in the euro area and the rest of the world across the considered financial instruments. The comprehensive analysis of the euro area financial system as a multilayer macro-network allows us to obtain further insights on the challenging problem of estimating the financial interdependencies exist-ing between the bankexist-ing sector and both the real and the financial sector, enablexist-ing the consideration of the relevant indirect exposures via the different financial instruments considered together. Further, this analysis provides us also with a map of the potential channels through which distress may propagate as a consequence of shocks of differ-ent nature. Both the insights on the estimate of financial interdependencies and the map of the potential distress propagation channels could not be obtained with a single layer analysis. In order to make more homogeneous the different layers of the multilayer macro-network of financial exposures, we compute weights as percentages of the total assets of the source institutional sectors. Moreover, for the sake of clarity, we remove links with a weight below 1%. By focusing on the most relevant links (with a weight above 10%) connecting the different institutional sectors of the euro area via loans and deposits, debt securities, and equity, we can identify the existence of relevant indirect exposures of the banking system to the financial sector. In particular, as shown in Fig.9, Monetary Financial Institutions excluding the Eurosystem exhibit a direct exposure amounting to about 16% of their total financial assets toNon-Financial Corporations, via loans and deposits. In turn,Non-Financial Corporationsare exposed for about 10% of their total financial assets toNon-MMF Investment Fundequity. The chain continues both via equity and debt securities to theRest of the Worldarriving i) toOther Finan-cial Institutions via loans and toNon-Financial Corporationsvia equity, or ii) coming back toMonetary Financial Institutions excluding the Eurosystemvia loans and equity, or iii) toNon-Financial Corporationsvia equity, making restart the chain from the begin-ning in all three cases. Further,Monetary Financial Institutions excluding the Eurosystem
Table 4Network statistics - equity layer
Institutional sectors Cwα
D−out CDw−αin CwCα CBwα CKw hi(t+1)
Non-financial corporations 8.23 13.26 0.05 2 2875.38 0.16
Eurosystem 0.86 0 0.02 0 0 0.10
Monetary financial institutions excluding the Eurosystem
3.21 7.02 0.03 0 363.76 0.11
Non-MMF investment funds 5.67 13.95 0.05 11 1325.79 0.16
Other financial institutions 8.21 4.30 0.07 0 165.18 0.17
Insurance corporations and pension funds 4.96 2.12 0.05 0 47.76 0.15
General governments 3.65 0.02 0.04 0 0 0.14
Households 6.22 0 0.06 0 0 0.13
also exhibit a direct exposure amounting to about the 20% of their total financial assets to Households, via loans and deposits. In turn,Households, other than being exposed toMonetary Financial Institutions excluding the Eurosystemfor about 30% of their total financial assets via loans and deposits, are exposed for about 19% of their total financial assets toNon-MMF Investment Fundequity. From this point the chain starts to coincide with the previous one. These findings shed light on the existence of indirect exposures of the banking system to the financial sector, and in particular, toNon-MMF Investment Funds, andOther Financial Institutions, that could not be identified if the financial system was not regarded as a multilayer financial network, leading to an underestimation of the exposures of the banking sector to the financial sector and the potential associated risks. Table5reports some network statistics (see “Methodology” section) computed on the multilayer macro-network of financial exposures via loans and deposits, debt securities, APP securities, and equity, whose matrix of financial exposures has been obtained with Equation1. As shown in Table5, according to the out-degree and betweenness centrality measures the most central node in the multilayer macro-network isMonetary Finan-cial Institutions excluding the Eurosystem. However, this result is not confirmed by the closeness centrality measure, according to which the most central node in the multilayer macro-network isRest of the World, nor by the in-degree and the Katz centrality mea-sures, according to which the most influential node isNon-Financial Corporations.Lastly, from the estimate of the DebtRank financial contagion model, we can derive that the most vulnerable nodes in the multilayer macro-network of financial exposures areEurosystem andRest of the World. Although the aforementioned centrality measures did not always exhibit consistent results among each other, as they are supposed to capture different characteristics of the network structure contributing differently to the concept of central-ity, this network analysis allows us to further strengthen the rationale behind the choice of performing a multilayer macro-network analysis. In fact, the differences in the results pro-vided by all the network measures in the single-layer macro-networks and the multilayer macro-network of financial exposures confirm our view, according to which by looking at a single layer at a time, one can fail to detect instability by underestimating the systemic importance of the nodes in the network. Further, the results coming from the estimate of the DebtRank financial contagion model in the single-layer macro-networks and the multilayer macro-network of financial exposures, provide us with empirical evidence on the fact that a single-layer analysis, compared to the multilayer one, may also lead to the
Table 5Network statistics - multilayer macro-network
Institutional sectors Cwα
D−out CwD−αin CCwα CBwα CwK hi(t+1)
Non-financial corporations 12.83 16.74 0.10 2 1088.06 0.23
Eurosystem 7.60 6.51 0.08 0 98.11 0.26
Monetary financial institutions excluding the Eurosystem
15.73 16.67 0.14 19 785.15 0.25
Non-MMF investment funds 9.72 13.99 0.11 0 447.05 0.25
Other financial institutions 13.36 9.88 0.12 0 285.41 0.25
Insurance corporations and pension funds 9.25 3.02 0.12 0 23.94 0.25
General governments 5.95 10.27 0.07 0 237.42 0.21
Households 11.48 7.57 0.12 1 239.45 0.20
underestimation of the vulnerability of the nodes in the network and, therefore, of the potential associated risks.
The dynamic perspective
The multilayer macro-network analysis of the euro area from a static perspective provides us with empirical evidence on the pattern of financial exposures among institutional sectors and across financial instruments with reference to the second quarter of 2017. However, this analysis can only capture the current situation in terms of financial expo-sures. Therefore, in order to explore the stimulation of the real economy and the evolution of the pattern of intra-financial exposures since the implementation of QE, we inves-tigate the time evolution of the financial linkages in the multilayer macro-network of the euro area. In particular, first, we explore the impact of asset purchases, performed by the Eurosystem from the banking system (whose breakdown in the different pro-grammes included in the APP is represented in Fig.10), on the private banking system loan and deposit, debt security, and equity holdings, represented in Fig.11. Second, we investigate the time evolution of the breakdown of loans and deposits granted by Mon-etary Financial Institutions excluding the Eurosystemby receiving counterparty sector, over the reference period 1999Q1-2017Q2, represented in Fig.11. Third, we explore the time evolution of the breakdown of bank private and public securities, and shares and other equity by issuing counterparty sector, over the reference period 2013Q4-2017Q2,
represented in Figs.13and14, respectively. Our main focus is on the fraction of intra-financial loans, securities, and equity, compared to the fraction of intra-financial-real loans, securities, and equity for two main reasons. First, the fraction of financial-real loans, securities, and equity enables us to explore the stimulation of the real economy through the increase of the interactions between the banking sector and the real sector, via loans and deposits, securities and equity, since the implementation of QE. Second, the frac-tion of intra-financial loans, securities, and equity allows us to investigate the evolufrac-tion of intra-financial interconnectedness in the euro area, through the increase of intra-financial interactions via loans and deposits, securities and equity, since the implementation of QE. In Figs.11,12,13and14, the time series of bank holdings are normalized by Mon-etary Financial Institutions excluding the Eurosystemtotal financial assets, the vertical dashed line corresponds to the beginning of the first purchase programme included in the APP, started in the fourth quarter of 2014, and the percentages on the right-hand side of the graphs correspond to our estimate of the growth rates of bank financial exposures via the different financial instruments (Fig. 11) to the different euro area institutional sectors (Figs.12,13and14). In particular, the growth rates have been estimated in the following way:
gt=
Yt−Yt−τ Yt−τ ×
100 (9)
Fig. 12 Bank loan and deposit holdings - breakdown by counterparty sector; 1999Q1-2017Q2. Time series of the breakdown of loans and deposits granted by the euro area Monetary Financial Instutions excluding the Eurosystem by counterparty sector, i.e., Eurosystem (ECB&NCB, in light blue), Monetary Financial Institutions excluding the Eurosystem (MFI excl. ECB&NCB, in black), Other Financial Institutions and Non-MMF
Investment Funds (OFI & Non-MMF IF, in purple), Insurance Corporations and Pension Funds (IC&PF, in green), Households (HH, in red), Non-Financial Corporations (NFC, in yellow), and General Governments (GG, in blue), over the reference period 1999Q1-2017Q2. The aforementioned time series are normalized by Monetary Financial Institutions excluding the Eurosystem total financial assets. The vertical dashed line corresponds to the beginning of the first purchase programme (3rd Covered Bond Purchase Programme, CBPP3) included in the APP, started in 2014Q4, while the percentages on the right-hand side of the graph correspond to our estimate of the growth rates of bank exposures in terms of loans and deposits to the different institutional sectors of the euro area, since the initiation of QE. Data source: (European Central Bank2017b)
Fig. 13 Bank security holdings - breakdown by counterparty sector; 2013Q4-2017Q2. Time series of the breakdown of debt securities (including short-term and long-term private and public securities) held by the euro area Monetary Financial Instutions excluding the Eurosystem by issuing counterparty sector, i.e., Monetary Financial Institutions excluding the Eurosystem (MFI excl. ECB&NCB, in black), Other Financial Institutions (OFI, in pink), Insurance Corporations and Pension Funds (IC&PF, in green), Non-Financial Corporations (NFC, in yellow), and General Governments (GG, in blue), over the reference period 2013Q4-2017Q2. The aforementioned time series are normalized by Monetary Financial Institutions excluding the Eurosystem total financial assets. The vertical dashed line corresponds to the beginning of the first purchase programme (3rd Covered Bond Purchase Programme, CBPP3) included in the APP, started in 2014Q4, while the percentages on the right-hand side of the graph correspond to our estimate of the growth rates of bank exposures in terms of debt securities to the different institutional sectors of the euro area, since the initiation of QE. Data source: (European Central Bank2017b)
Fig. 14 Bank equity holdings - breakdown by counterparty sector; 2013Q4-2017Q2. Time series of the breakdown of equity (including listed, unlisted, and investment fund shares) held by the euro area Monetary Financial Instutions excluding the Eurosystem by issuing counterparty sector, i.e., Monetary Financial Institutions excluding the Eurosystem (MFI excl. ECB&NCB, in black), Other Financial Institutions (OFI, in pink), Non-MMF Investment Funds (Non-MMF IF, in dark blue), Insurance Corporations and Pension Funds (IC&PF, in green), and Non-Financial Corporations (NFC, in yellow), over the reference period 2013Q4-2017Q2. The aforementioned time series are normalized by Monetary Financial Institutions excluding the Eurosystem total financial assets. The vertical dashed line corresponds to the beginning of the first purchase programme (3rd Covered Bond Purchase Programme, CBPP3) included in the APP, started in 2014Q4, while the percentages on the right-hand side of the graph correspond to our estimate of the growth rates of bank exposures in terms of equity to the different institutional sectors of the euro area, since the initiation of QE. Data source: (European Central Bank2017b)
other hand, bank equity holdings issued byNon-MMF Investment Funds,Non-Financial Corporations, andInsurance Corporations and Pension Fundshave decreased by 1.11%, 22.42%, and 22.41%, respectively. Further, with reference to bank-financial interactions versus bank-real interactions via equity, it is worth mentioning that, while bank exposures to the financial sector have increased by 1.03%, bank exposures to the real sector have decreased by 22.42%. All in all, the empirical evidence coming from our investigation of the time evolution of financial linkages in the multilayer macro-network of the euro area reveals two main findings. First, since QE, there has been a comprehensive increase in the extent of bank interactions via loans and deposits, debt securities and equity with the different institutional sectors operating in the euro area. In particular, while both bank debt security and equity holdings have decreased, only bank lending activity has slightly increased. However, this increase is mainly due to the increased bank loans and deposits to the Eurosystem, rather than to the increased lending activity addressed to the real economy. Second, since QE, there has been an increase in bank exposures to the financial sector (by 3.56%) and a very slight increase in bank exposures to the real sector (by 0.55%).
Macroeconomic effects
In an attempt to test the macroeconomic effects of QE, we lastly investigate the time evolution of the euro area private and public consumption (represented in Fig. 15), private and public investment, proxied by the increase in non-financial corporation and government gross fixed assets (represented in Fig. 16), Harmonized Unemploy-ment Rate (HUR) (represented in Fig. 17), Gross Domestic Product (GDP) (repre-sented in Fig. 18), and Harmonized Consumer Price Index (HICP) (represented in Fig. 19). Similarly to the figures included in “The dynamic perspective” section,
Fig. 16 Non-Financial Corporation and General Government gross fixed assets; 1999Q1-2017Q2. Time series of the euro area non-financial corporation and general government gross fixed assets, over the reference period 1999Q1-2017Q2. The vertical line corresponds to the beginning of the first purchase programme (3rd Covered Bond Purchase Programme, CBPP3) included in the APP, started in 2014Q4, while the percentages on the right-hand side of the graph correspond to our estimate of the growth rate of euro area non-financial corporation and general government gross fixed assets, since the initiation of QE. Data source: (European Central Bank2017b)
Fig. 18 Euro area GDP; 1999Q1-2017Q2. Time series of the euro area Gross Domestic Product (GDP) at market prices, over the reference period 1999Q1-2017Q2. The vertical line corresponds to the beginning of the first purchase programme (3rd Covered Bond Purchase Programme, CBPP3) included in the APP, started in 2014Q4, while the percentage on the right-hand side of the graph corresponds to our estimate of the growth rate of euro area GDP, since the initiation of QE. Data source: (European Central Bank2017b)
in Figs. 15, 16, 17, 18 and 19, the vertical dashed line corresponds to the begin-ning of the fist purchase programme included in the APP, started in the fourth quarter of 2014. We estimated the growth rate of the aforementioned macroeco-nomic variables (reported in the right-hand side of Figs. 15, 16, 17, 18 and 19), since the implementation of QE. It is worth noting that, since the APP programme has been implemented, bothprivate and public consumption, andnon-financial corporation and government gross fixed assetshas raised by 5.37%, 3.92%, 3.21%, and 3.21%, respec-tively. Further, since QE, there has been a decrease in the unemployment rate by 21.74%. In particular, the HUR among the “under 25” has dropped by 21.36%, while the HUR among the “over 25” has decreased by 21.26%. Lastly, our data provide us with empirical evidence that both theGDP, and inflation have increased. In particular,GDPhas raised by 5.83%, while theHICPhas increased by 1.45%. Consequently, despite the macroeconomic effects of QE are probably not fully materialized yet, as the transmission mechanism may be subject to long lags (Joyce et al.2011), our empirical evidence seems to be consistent with the chain of events included in the ECB’s narrative on QE (European Central Bank 2017c). However, our empirical analysis does not allow us to identify a causal relationship among the QE, the time evolution of financial linkages of the multilayer macro-network, and the aforementioned macro-variables.
Conclusion
equity. Our empirical results constitute a contribution to the debate on the effective-ness of unconventional policy tools, as they reveal three main findings. First, since the implementation of QE there has been a comprehensive increase in the private banking system interactions with the euro area economy, via loans and deposits, debt securi-ties and equity. In particular, while both bank debt security and equity holdings have decreased, only bank lending activity has slightly increased. However, this increase is mainly due to the increased bank loans and deposits to the Eurosystem, rather than to the increased lending activity addressed to the real economy. Second, since QE, there has been an increase in bank exposures to the financial sector and a very slight increase in bank exposures to the real sector. Third, since the implementation of QE, there has been an increase both in Gross Domestic Product and inflation, as well as a decrease in the level of unemployment. In a nutshell, our research has brought to light some important facts with regard to the effects of Quantitative Easing in the euro area. However, as in most serious debates, the truth lies somewhere in the middle. More specifically, on the one hand, since QE, there has not been a significant increase in the interactions between the private banking system and the real economy and, in particular, the bank-firm lending level has decreased, while the banking system is increasing its interactions with the finan-cial sector, and, on the other hand, the overall euro area economy is experiencing growth and addressing the risk of deflation.
Endnotes
1Credit securitization is a process that allows an issuer to pool loans to
homeown-ers, car buyhomeown-ers, students, or businesses into composite credit securities and sell them to end investors, rather than holding them to maturity on her balance sheet. Credit secu-ritization enabled the extension of bond-based finance from governments and major corporations to a wider set of borrowers (Turner2017).
2Credit structuring is a practice through which the risk and the return inherent in a
portfolio of loans can be divided, and allows for the creation of different tranches of credit securities, characterized by different level of risk and return (Turner2017).
3A collateralized Loan Obligation (CLO) is a securitiy backed by a pool of debt,
gener-ally consisting of low-rated corporate loans. A CLO grants the investor some scheduled debt payments from the underlying loans, typically associated with returns higher than average, in exchange for taking on the risk of default of the borrower.
4A Collateralized Debt Obligation (CDO) is a structured financial product through
which different assets (which serve as a collateral of the CDO) are pooled and repackaged into tranches that are separately sold to investors.
5A Credit Default Swap (CDS) is a credit derivative via which one party buys protection
against the default of a reference entity from another party. In particular, the protection buyer pays a fee to the protection seller who, in turn, promises to pay a notional amount to the protection buyer in the event that the reference entity defaults.
6In particular, the APP, announced on January 2015, encompasses the existing i)
3rd Covered Bond Purchase Programme (CBPP3, started on 20 October 2014), and ii) Asset-Backed Securities Purchase Programme (ABSPP, started on 21 November 2014), combining them with the new iii) Public Sector Purchase Programme (PSPP, started on 9 March 2015), and iv) Corporate Sector Purchase Programme (CSPP, started on 8 June 2016) (Gambetti and Musso2017).
7More specifically, from March 2015 until March 2016, and from April 2017 until
December 2017, the average monthly pace wase60 billion. From April 2016 until March 2017, the average monthly pace wase80 billion. From January 2018, the net purchases have been reduced to the monthly pace ofe30 billion (European Central Bank2017a).
8The European Union’s Member States that have adopted the euro in stage three
of Economic and Monetary Union (EMU) are Austria, Belgium, Cyprus, Estonia, Finland, France, Germany, Greece, Ireland, Italy, Latvia, Lithuania, Luxembourg, Malta, Netherlands, Portugal, Slovakia, Slovenia, and Spain.
9Saving and loan associations include companies resembling banks in many respects,
which by low must have the 65% or more of their lending in residential mortgages, though other types of lending are allowed.
10Credit unions are alternative institutions to regular commercial banks, almost always
organized as non-profit cooperatives.
11Shadow banks could be identified as a collection of non-bank financial institutions
that replicate some of the activities of regulated banks, but do not operate in the same regulatory environment.
12Islamic banks are institutions existing to fill the need for financial services that are
compliant with Islamic rules, which forbid the charging, or acceptance, of interest or other fees related to borrowing money.
13More specifically, the purchased securities include: i) corporate sector bonds
PSPP), and iv) asset-backed securities (purchased under the ABSPP), i.e., financial secu-rities collateralized (backed) by a pool of underlying assets (typically a group of illiquid assets, which are not easily tradable individually) (European Central Bank2017a).
14A detailed description of the financial instruments under consideration in the present
analysis is provided in the Additional file1(Section SI2)
15The attenuation factor has to be chosen such that it is smaller than the reciprocal of
the absolute value of the largest eigenvalue of the adjacency matrixA.
16The extension also allows to overcome the mathematical intractabilities connected
with the fact that the presence of a cycle in the network lead to an infinite number of reverberations of the impact of a node to the others and back to itself, thus allowing a full exploitation of the linearity underlying the model, with important consequences for the analysis of the stability of the system (Battiston et al.2016; Bardoscia et al.2015; 2017)
17It is worth mentioning that, thanks to the availability of new data, differently from
(Perillo and Battiston2017), we have been able to include in the analysis the institutional sectors i)Non-MMF Investment Fundsand ii)Rest of the World. However, data concern-ing theRest of the Worldallow us to consider this sector only from the static point of view for the purposes of our analysis.
18Please note that all data sources in this paper have been last accessed on January 2018.
19Unfortunately, data on insurance and pension schemes, and other accounts receivable
and financial derivatives are available only at an aggregate level. Therefore, this data don’t allow us to investigate the interactions among the different institutional sectors operating in the euro area and the rest of the world via the aforementioned categories of financial instruments.
20Unfortunately, available data on the institutional sector Rest of the World do not
allow us to discriminate between real sector and financial sector of non-euro area coun-tries issuing the aforementioned amount of equity held by the euro area private banking system.
Additional file
Additional file 1:Supplementary Information. (TEX 20 kb)
Acknowledgments See Funding section.
Funding
This work has been funded by the research project BigDataFinance. BigDataFinance project has received funding from the European Union’s Horizon 2020 research and innovation programme under the Marie Sklodowska-Curie grant agreement No 675044.
Availability of data and materials See Additional file1: Section SI3.
Authors’ contributions
CP conceived the project, gathered the data and built the dataset, performed the analyses, prepared the figures, and wrote the manuscript. CP and SB developed the methodology. SB supervised the work and contributed to the editing of the manuscript and the interpretation of the results. Both authors read and approved the final manuscript.
Competing interests
The authors declare that they have no competing interests.
Publisher’s Note
Received: 28 March 2018 Accepted: 6 September 2018
References
Aiyar S, Calomiris CW, Wieladek T (2014) Does macro-prudential regulation leak? evidence from a uk policy experiment. Journal of Money. Credit and Banking 46(s1):181–214
Allahrakha M, Glasserman P, Young HP, et al (2015) Systemic importance indicators for 33 US bank holding companies: an overview of recent data. Office of Financial Research
Baele L, Ferrando A, Hördahl P (2004) Krylova E. Measuring financial integration in the euro area, Monnet C Balasubramanyan L, VanHoose DD (2013) Bank balance sheet dynamics under a regulatory liquidity-coverage-ratio
constraint. J Macroecon 37:53–67
Bank of Latvia (2018) Non-MMF Investment Funds. https://www.bank.lv/en/your-profile/media/press-releases/555-statistics/statistics-terms/9348-non-mmf-investment-funds. Accessed Jan 2018
Bardoscia M, Battiston S, Caccioli F, Caldarelli G (2015) Debtrank: A microscopic foundation for shock propagation. PloS ONE 10(6):e0130406
Bardoscia M, Battiston S, Caccioli F, Caldarelli G (2017) Pathways towards instability in financial networks. Nat Commun 8:14416
Barrat A, Barthélemy M, Vespignani A (2004) Weighted evolving networks: coupling topology and weight dynamics. Phys Rev Lett 92(22):228701
Battiston S, Puliga M, Kaushik R, Tasca P, Caldarelli G (2012) Debtrank: Too central to fail? financial networks, the fed and systemic risk. Sci Rep 2:srep00541
Battiston S, Caldarelli G, D’Errico M (2016) The financial system as a nexus of interconnected networks. In: Interconnected networks. Springer. pp 195–229
Battiston S, Caldarelli G, D’Errico M, Gurciullo S (2016) Leveraging the network: a stress-test framework based on DebtRank. Stat Risk Model 33(3-4):117–138
Castrén O, Rancan M (2014) Macro-networks: An application to euro area financial accounts. J Bank Finance 46:43–58 Claessens S, Ghosh SR, Mihet R (2013) Macro-prudential policies to mitigate financial system vulnerabilities. J Int Money
Financ 39:153–185
De Haan J, Oosterloo S, Schoenmaker D (2009) European financial markets and institutions. Cambridge University Press D’Errico M, Roukny T (2017) Compressing over-the-counter markets
Eisenberg L, Noe TH (2001) Systemic risk in financial systems. Manag Sci 47(2):236–249
Eisenschmidt J, Kedan D, Schmitz M, Adalid R, Papsdorf P (2017) The Eurosystem’s asset purchase programme and TARGET balances
Elsinger H, Lehar A, Summer M (2006) Risk assessment for banking systems. Manag Sci 52(9):1301–1314
European Central Bank (2006) List of Monetary Financial Institutions in the Acceding Countries.https://www.ecb.europa. eu/stats/pdf/money/mfi/mfiac-aug2006.pdf?afaefece6d8850a234d77f55c94c892c. Accessed Jan 2018
European Central Bank (2017a) Asset purchase programmes.http://www.ecb.europa.eu/mopo/implement/omt/html/ index.en.html. Accessed Jan 2018
European Central Bank (2017b) ECB Statistical Data Warehouse.http://sdw.ecb.europa.eu/. Accessed Jan 2018 European Central Bank (2017c) How quantitative easing works.https://www.ecb.europa.eu/explainers/show-me/html/
app_infographic.en.html. Accessed Jan 2018
European Commission (ESA2010) (2017) Institutional sectors.http://ec.europa.eu/eurostat/web/sector-accounts/ concepts/institutional-sectors. Accessed Jan 2018
Eurostat (2017) Harmonised Unemployment Rate.http://ec.europa.eu/eurostat. Accessed Jan 2018 Freeman LC (1978) Centrality in social networks conceptual clarification. Soc Networks 1(3):215–239
Gambetti L, Musso A (2017) The macroeconomic impact of the ECB’s expanded asset purchase programme (APP) International Monetary Fund (IMF) (2006) IMF Global Financial Stability Report: Market Developments and Issues Joyce M, Lasaosa A, Stevens I, Tong M, et al (2011) The financial market impact of quantitative easing in the united
kingdom. Int J Cent Bank 7(3):113–161
Junker BH, Schreiber F (2011) Analysis of biological networks, vol 2. Wiley
Kaushik R, Battiston S (2013) Credit default swaps drawup networks: Too interconnected to be stable PloS ONE 8(7):e61815 Miles MB, Huberman AM, Saldana J (2013) Qualitative data analysis. Sage
Opsahl T, Agneessens F, Skvoretz J (2010) Node centrality in weighted networks: Generalizing degree and shortest paths. Soc Networks 32(3):245–251
Perillo C, Battiston S (2017) Real implications of quantitative easing in the euro area: A complex-network perspective. In: International Workshop on Complex Networks and their Applications. Springer. pp 1162–1173
Popoyan L, Napoletano M, Roventini A (2017) Taming macroeconomic instability: Monetary and macro-prudential policy interactions in an agent-based model. J Econ Behav Organ 134:117–140
Roukny T, Bersini H, Pirotte H, Caldarelli G, Battiston S (2013) Default cascades in complex networks: Topology and systemic risk. Sci Rep 3
Roukny T, Battiston S, Stiglitz JE (2018) Interconnectedness as a source of uncertainty in systemic risk. J Financ Stab 35:93–106
Turner A (2017) Between debt and the devil: Money, credit, and fixing global finance. Princeton University Press Visentin G, Battiston S, D’Errico M (2016) Rethinking financial contagion. Preprint athttp://ssrncom/abstract=2831143.
Accessed Jan 2018