R E S E A R C H
Open Access
Examining trends in cardiovascular disease
mortality across Europe: how does the
introduction of a new European Standard
Population affect the description of the
relative burden of cardiovascular disease?
Shiva Tadayon
1,2, Kremlin Wickramasinghe
1,3and Nick Townsend
1,4*Abstract
Background:Some mortality statistics are misleading when comparing between countries due to varying age distributions in their populations. In order to adjust for these differences, age-standardised mortality rates (ASMRs) are often produced. ASMRs allow for comparisons between countries as if both had the same standardised population. We examined whether the updating of the standard population for Europe affected the description of the relative burden between countries in cardiovascular disease (CVD) mortality across the continent.
Methods:Mortality and population data were obtained from the World Health Organization (WHO) mortality database. ASMRs were calculated using the direct method and two European Standard Populations (ESP): 1976 ESP and 2013 ESP. We investigated differences in ASMR76 (calculated using 1976 ESP) and ASMR13 (calculated using 2013 ESP), changes in rankings of countries between the two ASMRs and differences in trends in CVD mortality in each country for the two ASMRs.
Results:CVD rates calculated using the 1976 ESP were on average half the size of rates calculated using the 2013 ESP.
Spearman’s rank coefficient showed that the ranks of countries by ASMRs calculated using the two ESPs were different for
both sexes. Joinpoint analyses showed no difference in the direction of trend between ASMR76 and ASMR13 although differences in the magnitude of the change were found in some countries.
Conclusion:ASMRs are commonly used in studying the epidemiology of a disease. It is crucial that policy makers understand the effect of changes in standard populations on these rates. This includes how populations with different age distributions compare to each other. Similar effects may be seen in other diseases that are also more prevalent in older age groups, such as cancer and dementia.
Keywords:Cardiovascular disease, Epidemiology, European Standard Population, Mortality
© The Author(s). 2019Open AccessThis article is distributed under the terms of the Creative Commons Attribution 4.0 International License (http://creativecommons.org/licenses/by/4.0/), which permits unrestricted use, distribution, and reproduction in any medium, provided you give appropriate credit to the original author(s) and the source, provide a link to the Creative Commons license, and indicate if changes were made. The Creative Commons Public Domain Dedication waiver (http://creativecommons.org/publicdomain/zero/1.0/) applies to the data made available in this article, unless otherwise stated.
* Correspondence:N.P.Townsend@bath.ac.uk
1
Centre on Population Approaches for Non-Communicable Disease Prevention, Nuffield Department of Population Health, University of Oxford, Oxford, UK
4Department for Health, University of Bath, Bath BA2 7AY, UK
Introduction
Despite large decreases in cardiovascular disease (CVD)
mortality within Europe over the last four decades [1–3],
CVD remains the leading cause of mortality in the
continent [4]. More than 4 million deaths are attributed
to CVD in Europe annually, accounting for 46% of all deaths, with the number of CVD deaths higher in women
(2.2 million) than men (1.8 million) [2].
Despite decreasing trends in mortality from CVD found in most European countries, there is great variation in the extent of this decline between countries. For example, 10-year decreases in CVD age-standardised mortality rates (ASMRs) ranged from 1.3% and 6.3% for men and women respectively in Kyrgyzstan to 56.5% and
65.6% respectively in Kazakhstan [2]. It is no surprise
that large inequalities remain across Europe in the
relative and absolute burden of CVD [5, 6] with
CVD-related mortality generally higher in Central and
Eastern Europe [1, 2, 5, 7].
Comparing between countries and sexes can be prob-lematic due to differences in population structure. Since CVD is more common in older age groups, countries or sexes with a greater proportion of older individuals may be expected to suffer a higher proportion of CVD deaths
[8]. ASMRs are used to account for some differences in
age and population structure and have been used to com-pare between European countries in the burden of many CVD outcomes, including mortality. ASMRs are calcu-lated by applying age-specific mortality rates for different countries to the same standard population. Rates can differ depending on which standard population is used.
The European Standard Population (ESP) is recom-mended for the calculation of ASMRs in Europe. How-ever, Eurostat, the statistical office of the European Union, updated the 1976 ESP in 2013 to reflect better the current European population structure that had changed from 1976 due to an increase in life expectancy
[9]. The 2013 ESP has greater weighting on older age
groups and has an upper limit disaggregated to include age groups of 90 years and older, compared to the 1976
ESP upper age limit of 85 and over [10].
The introduction of the 2013 ESP has been shown to lead to ASMRs in CVD about twice as large as those
calculated using the 1976 ESP [2]. This increase may not
be the same for all countries and sexes as there is a greater emphasis on older age groups in the 2013 ESP. Those with a greater proportion of older age groups liable to show relatively larger increases. This may change how we view inequalities in CVD mortality within Europe. We know that the change in standard population will change the ASMRs calculated; if this change is uniform across all countries, then the description and presentation of inequalities across Europe are unaffected. However, if this change in standard population leads to heterogeneous
changes in ASMRs between countries, this may change the narrative around inequalities in CVD mortality across the continent.
In this study, we aimed to examine how updating the ESP changed the CVD ASMRs calculated for European countries and whether the extent of any relative diffe-rence varied by country. We calculated CVD ASMRs for each country and both sexes using both European Standard Populations, ESP13 and ESP76. We examined changes to ASMRs due to the change in ESP and exam-ined changes in the trends in CVD mortality expressed through ASMRs calculated using the 1976 and 2013 ESPs. Joinpoint analysis was used to analyse trends in CVD ASMRs for both ESPs in each country over time and by sex.
Methods
Data on cause-specific numbers of deaths and popula-tion numbers, by sex and in 5-year age groups (up to 85 and over) for European countries were extracted from the WHO global mortality database. The WHO database collates data reported by national authorities based on their civil registration systems and contains data for 51 of 53 European countries. Data for each country were extracted and analysed for the years of 1965 to 2014, where available. Countries were excluded if both popula-tion and mortality data for that year were not available (Andorra and Monaco).
Cardiovascular disease as a cause of death was defined according to the following International Classification of Disease codes: ICD-10 (International Classification of Diseases, tenth revision) codes I00-I99; ICD-9 codes 390-459, ICD-8 codes A081-A088 and ICD-7 codes A080-A086. Age and sex-specific mortality rates were calculated and the direct method was used to calculate age-standardised mortality rates for both the ESP76 (ASMR76) and ESP13 (ASMR13). These rates are
presented for the‘most recent year’, which are related to
the most recent data for which both mortality and popu-lation data were available.
Countries were ranked by CVD ASMRs with diffe-rences in rankings between ASMR76 and ASMR13
examined through Spearman’s rank test. All statistical
analyses were performed using STATA (version 14.0).
Trends in ASMRs for both ESPs were calculated. Join-point Trend Analysis Software (version 4.3.1.0) was used to perform joinpoint regressions to identify periods with statistically distinct log-linear trends in death rates from CVD over time within each age group, by sex and country. We used joinpoint to calculate the average annual per-centage change (AAPC) over the entire period of available data and the annual percentage change (APC) for indivi-dual trend segments. Segments are identified by inflexion
Table
1
Overview
of
data
availability
and
number
o
f
d
e
aths,
population
by
country
and
sex,
mos
t
recent
available
year
Count
ry
Data range (years) Total years
of
data available (%
of
total years
)*
Mal
es
Female
s
Tot
al
popu
lation
Total
no.
CVD
de
aths
(%
of
all
deaths
in
that
cou
ntry
that
are
from
CVD
)**
Total
popu
lation
Total
no.
CVD
deaths
(%
of
all
deaths
in
that
coun
try
that
are
from
CVD
)**
Alban
ia
1987
–
2004
37
(75)
1,
558,376
4679
(47)
1,568,8
87
4212
(54)
Arm
enia
1981
–
2012
25
(51)
1,
450,560
6494
(46)
1,573,5
67
6836
(51)
Austria
1965
–
2014
49
(100)
4,
176,550
13,964
(37)
4,367,3
82
19,172
(47)
Azerb
aijan
1981
–
2007
23
(47)
4,
231,550
13,534
(51)
4,349,7
50
14,110
(59)
Belaru
s
1981
–
2011
26
(53)
4,
403,227
35,509
(50)
5,069,9
45
34,678
(55)
Belg
ium
1965
–
2012
47
(96)
5,
451,780
14,299
(27)
5,643,0
70
17,157
(31)
Bosni
a
and
Herzego
vina
1985
–
2011
41
(84)
1,
875,931
8503
(47)
1,963,8
06
9887
(58)
Bulgaria
1965
–
2012
47
(96)
3,
555,925
34,456
(61)
3,749,9
73
37,188
(70)
Croat
ia
1985
–
2013
29
(59)
2,
053,788
10,445
(41)
2,201,9
01
13,787
(54)
Cypru
s
2004
–
2012
9
(18)
42
0,010
1015
(35)
443,932
1004
(38)
Czech
Repu
blic
1986
–
2013
28
(57)
5,
161,617
23,701
(24)
5,349,1
02
28,030
(52)
Denm
ark
1965
–
2012
49
(98)
2,
771,208
6442
(25)
2,815,8
77
6654
(25)
Estoni
a
1981
–
2012
29
(59)
62
0,643
3491
(46)
708,668
4848
(62)
Finland
1965
–
2013
48
(98)
2,
673,499
9575
(37)
2,765,4
85
10,079
(39)
France
1965
–
2011
46
(94)
30
,630,77
8
64,659
(24)
32,593,
667
74,025
(28)
Georgi
a
1981
–
2014
34
(69)
1,
776,700
9664
(39)
1,950,3
00
10,933
(45)
Germ
any
1990
–
2013
24
(49)
39
,469,10
5
153,309
(36)
41,176,
500
201,184
(43)
Gree
ce
1965
–
2012
47
(96)
5,
431,556
23,438
(39)
5,661,2
27
26,290
(46)
Hung
ary
1965
–
2013
48
(98)
4,
709,677
27,598
(45)
5,183,4
16
35,379
(55)
Icelan
d
1965
–
2009
45
(92)
16
1,548
381
(37)
157,698
348
(36)
Ireland
1965
–
2012
46
(94)
2,
269,612
4779
(32)
2,315,7
95
4701
(33)
Israel
1975
–
2013
39
(80)
3,
991,346
4819
(24)
4,068,1
10
5217
(25)
Italy
1965
–
2012
37
(76)
28
,808,10
3
99,659
(34)
30,731,
623
130,498
(41)
Kazakhstan
1981
–
2012
32
(65)
8,
100,113
24,533
(31)
8,691,3
15
18,542
(29)
Kyrgy
zstan
1981
–
2013
31
(63)
2,
827,672
9017
(46)
2,892,1
80
8610
(57)
Latvia
1980
–
2012
43
(88)
93
0,696
6877
(50)
1,103,6
23
9436
(62)
Lithuania
1981
–
2012
32
(65)
1,
376,201
9884
(48)
1,611,5
72
13,286
(66)
Luxem
bourg
1965
–
2013
48
(98)
27
1,765
523
(30)
271,595
650
(34)
Malta
1965
–
2014
49
(100)
21
3,607
577
(35)
213,814
654
Table
1
Overview
of
data
availability
and
number
o
f
d
e
aths,
population
by
country
and
sex,
mos
t
recent
available
year
(Con
tinued)
Count
ry
Data range (years) Total years
of
data available (%
of
total years
)*
Mal
es
Female
s
Tot
al
popu
lation
Total
no.
CVD
de
aths
(%
of
all
deaths
in
that
cou
ntry
that
are
from
CVD
)**
Total
popu
lation
Total
no.
CVD
deaths
(%
of
all
deaths
in
that
coun
try
that
are
from
CVD
)**
Mont
enegro
2000
–
2009
10
(20)
31
1,262
1518
(50)
320,282
1700
(60)
Netherl
ands
1965
–
2013
48
(98)
8,
320,868
18,026
(26)
8,483,5
77
20,437
(28)
Norw
ay
1965
–
2013
48
(98)
2,
551,676
5630
(28)
2,528,4
98
6455
(30)
Pola
nd
1965
–
2013
48
(98)
18
,411,12
6
82,518
(41)
19,620,
506
94,910
(51)
Portug
al
1965
–
2013
45
(92)
4,
976,865
13,980
(26)
5,480,4
41
17,546
(33)
Repu
blic
of
Mol
dova
1981
–
2013
31
(63)
1,
711,931
9994
(50)
1,846,6
46
12,136
(67)
Rom
ania
1969
–
2012
43
(88)
9,
770,353
71,117
(53)
10,289,
829
82,254
(67)
Russian
Fede
ration
1980
–
2011
32
(65)
66
,113,26
9
484,763
(49)
76,847,
639
589,956
(64)
San
Mar
ino
1995
–
2005
7
(14)
14
,637
49
(42)
15,205
50
(49)
Serbi
a
1998
–
2013
11
(22)
3,
488,466
24,499
(48)
3,675,6
66
28,859
(58)
Slovak
ia
1992
–
2010
18
(37)
2,
639,896
12,856
(47)
2,791,1
28
15,682
(61)
Sloveni
a
1985
–
2010
26
(53)
1,
014,709
3071
(33)
1,034,5
45
4260
(46)
Spain
1965
–
2013
48
(98)
22
,900,00
0
53,487
(27)
23,700,
000
63,997
(34)
Swed
en
1965
–
2013
48
(98)
22
,933,75
1
15,972
(37)
3,659,4
85
17,597
(38)
Swit
zerland
1965
–
2013
48
(98)
3,
995,315
9719
(31)
4,094,0
44
11,793
(35)
TFYR
Mace
donia
1991
–
2010
20
(41)
1,
029,724
5500
(54)
1,024,7
67
5566
(62)
Tajikis
tan
1981
–
2004
22
(45)
3,
365,837
6691
(46)
3,344,3
34
6448
(53)
Turk
ey
2009
–
2013
4
(8)
38
,164,87
0
70,476
(36)
37,889,
747
71,750
(45)
Turk
menis
tan
1981
–
1998
28
(57)
2,
337,600
6314
(38)
2,370,0
00
6847
(52)
The
UK
1965
–
2013
48
(98)
31
,532,87
3
79,935
(29)
32,572,
781
79,860
(27)
Ukraine
1981
–
2012
32
(65)
20
,969,72
8
186,857
(57)
24,443,
259
249,569
(74)
Uzbe
kistan
1981
–
2005
25
(51)
13
,069,36
0
39,235
(53)
13,097,
660
39,877
(60)
*Years
of
available
data
expressed
in
relation
to
a
total
of
1965
to
2014
**CVD
deaths
expressed
as
a
percentage
of
total
deaths
by
sex,
e.g.
percentage
of
all
deaths
in
males
that
were
caused
by
Table
2
Rates
(per
100,000)
and
rate
difference
for
most
recent
year
for
all
countries
by
ESP
and
sex
Count
ry
Males
Fema
les
1976
ESP
rate
20
13
ES
P
rate
Rate
diff
erenc
e
1976
ESP
rate
2013
ESP
rate
Rate
differ
ence
Alban
ia
490.
7
95
0.7
1.94
354.8
724.5
2.04
Arm
enia
524.
5
94
6.5
1.80
356.5
743.9
2.09
Austria
224.
5
4
5
7.1
2.04
156.3
348.0
2.23
Azerb
aijan
616.
8
10
78.1
1.75
488.9
944.7
1.93
Belaru
s
868.
0
14
48.0
1.67
394.0
726.9
1.84
Belg
ium
181.
1
35
7.1
1.97
118.7
252.9
2.13
Bosni
a
and
Herzego
vina
474.
7
91
8.6
1.93
385.4
805.2
2.09
Bulgaria
705.
5
1
2
99.5
1.84
469.1
959.6
2.05
Croat
ia
392.
8
76
1.4
1.94
269.0
581.2
2.16
Cypru
s
217.
7
42
8.8
1.97
155.2
343.9
2.22
Czech
Repu
blic
384.
7
74
7.6
1.94
251.0
538.2
2.14
Denm
ark
170.
1
33
7.6
1.98
107.6
229.9
2.14
Estoni
a
501.
0
92
0.2
1.84
269.3
572.4
2.13
Finland
250.
0
48
0.7
1.92
136.3
295.5
2.17
France
141.
0
2
7
5.2
1.95
81.0
174.1
2.15
Georgi
a
450.
0
89
1.6
1.78
302.6
608.7
2.01
Germ
any
239.
2
47
6.3
1.99
165.2
361.2
2.19
Gree
ce
257.
1
48
5.0
1.89
180.6
391.3
2.17
Hung
ary
494.
1
92
1.3
1.86
310.7
646.3
2.08
Icelan
d
218.
6
44
1.6
2.02
131.9
297.5
2.26
Ireland
214.
0
42
0.5
1.97
134.9
290.2
2.15
Israel
130.
0
25
5.0
1.98
90.3
194.9
2.16
Italy
193.
7
39
3.8
2.03
131.5
289.6
2.20
Kazakhstan
517.
0
7
7
9.9
1.51
262.9
437.5
1.66
Kyrgy
zstan
806.
1
14
43.9
1.79
545.3
1087
.4
1.99
Latvia
655.
0
11
56.8
1.77
353.4
718.6
2.03
Lithuania
616.
0
1
0
97.0
1.78
340.1
706.4
2.08
Luxem
bourg
167.
1
3
3
2.7
1.99
118.6
254.9
2.15
Malta
206.
0
4
0
7.7
1.98
147.8
317.0
2.15
Mont
enegro
510.
1
92
2.3
1.81
415.4
829.4
2.00
Netherl
ands
161.
3
32
2.0
2.00
109.1
233.5
2.14
Norw
ay
165.
8
33
4.3
2.02
107.1
235.1
Table
2
Rates
(per
100,000)
and
rate
difference
for
most
recent
year
for
all
countries
by
ESP
and
sex
(Co
ntinued)
Count
ry
Males
Fema
les
1976
ESP
rate
20
13
ES
P
rate
Rate
diff
erenc
e
1976
ESP
rate
2013
ESP
rate
Rate
differ
ence
Pola
nd
410.
4
75
6.0
1.84
241.9
505.6
2.09
Portug
al
174.
8
34
7.0
1.99
119.8
259.7
2.17
Repu
blic
of
Mol
dova
750.
7
13
80.0
1.84
536.6
1071
.5
2.00
Rom
ania
603.
5
11
44.0
1.90
431.1
903.9
2.10
Russian
Fede
ration
836.
1
14
23.1
1.70
469.3
914.0
1.95
San
Mar
ino
242.
2
51
6.6
2.13
155.5
322.0
2.07
Serbi
a
516.
3
99
0.9
1.92
398.3
836.4
2.10
Slovak
ia
551.
8
10
48.1
1.90
360.2
758.5
2.11
Sloveni
a
269.
2
53
2.9
1.98
178.0
390.6
2.19
Spain
151.
0
29
2.4
1.94
97.3
211.5
2.17
Swed
en
204.
4
41
4.8
2.03
134.0
292.3
2.18
Swit
zerland
164.
3
33
9.2
2.06
108.7
242.0
2.23
Tajikis
tan
710.
3
13
32.5
1.88
503.9
920.0
1.83
TFYR
Mace
donia
626.
9
12
28.8
1.96
490.6
1012
.5
2.06
Turk
ey
306.
7
58
2.7
1.90
224.8
458.2
2.04
Turk
menis
tan
966.
4
17
18.5
1.78
722.0
1335
.3
1.85
The
UK
176.
1
33
4.3
1.90
110.2
227.9
2.07
Ukraine
873.
3
15
44.9
1.77
532.6
1065
.8
2.00
Uzbe
kistan
858.
0
14
92.4
1.74
662.3
1225
.1
1.85
Total
mean
(SD)
560.
8
(231.
6)
10
31.5
(405.4)
1.86
(0.85
7)
375.3
(164.6)
751.3
(313.6)
2.03
(0.09
Table 3Ranking number for countries from lowest to highest cardiovascular disease mortality rates (per 100,000), by latest available year
Country Males Change
in ranking
Females Change
in ranking
1976 ESP 2013 ESP 1976 ESP 2013 ESP
Albania 36 36 0 36 34 2
Armenia 35 34 1 34 36 −2
Austria 18 18 0 18 20 −2
Azerbaijan 40 38 2 38 44 −6
Belarus 49 48 1 48 35 13
Belgium 11 11 0 11 9 2
Bosnia and Herzegovina 28 30 −2 30 38 −8
Bulgaria 43 43 0 43 45 −2
Croatia 26 27 −1 27 29 −2
Cyprus 16 16 0 16 19 −3
Czech Republic 25 25 0 25 27 −2
Denmark 8 8 0 8 5 3
Estonia 31 31 0 31 28 3
Finland 21 20 1 20 15 5
France 2 2 0 2 1 1
Georgia 30 29 1 29 30 −1
Germany 19 19 0 19 21 −2
Greece 22 21 1 21 23 −2
Hungary 29 32 −3 32 31 1
Iceland 17 17 0 17 16 1
Ireland 15 15 0 15 13 2
Israel 1 1 0 1 2 −1
Italy 12 12 0 12 12 0
Kazakhstan 34 28 6 28 24 4
Kyrgyzstan 46 47 −1 47 49 −2
Latvia 42 41 1 41 33 8
Lithuania 39 39 0 39 32 7
Luxembourg 7 5 2 5 10 −5
Malta 14 13 1 13 17 −4
Montenegro 32 33 −1 33 39 −6
Netherlands 4 4 0 4 6 −2
Norway 6 6 0 6 7 −1
Poland 27 26 1 26 26 0
Portugal 9 10 −1 10 11 −1
Republic of Moldova 45 45 0 45 48 −3
Romania 38 40 −2 40 41 −1
Russia Federation 47 46 1 46 42 4
San Marino 20 22 −2 22 18 4
Serbia 33 35 −2 35 40 −5
Slovakia 37 37 0 37 37 0
Slovenia 23 23 0 23 22 1
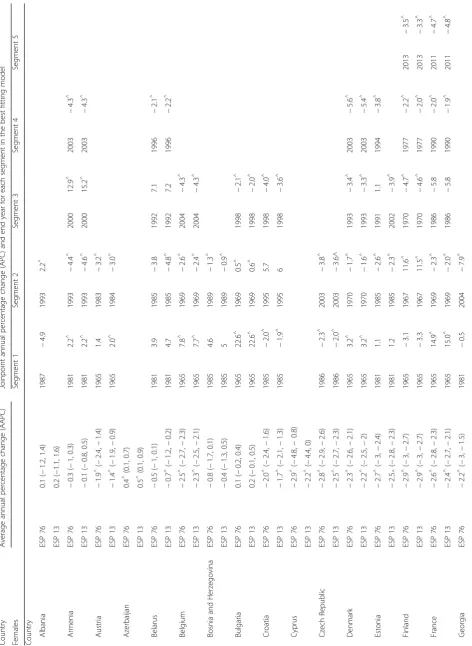
in trends, using a series of permutation tests, with Bonferroni adjustment for multiple comparisons. The changes in trend may include any change in intensity, but could include a change in direction. We used a
two-sided significance level set at P< 0.05 for all tests.
Significant joinponts for each country by sex (maximum of 5) were determined using a log-linear model, and the annual percentage change (APC) within each segment cal-culated. The use of a log-linear model enables the analysis of constant percentage (rather than absolute) change in prevalence over time. Plateauing of the most recent trend for a country was defined as the trend in the most recent segments showing either a less steep decline than the preceding segment, no significant difference to zero, or an increase. Joinpoint segments were compared between ASMRs from both ESPs to examine differences in trends.
Results
On average, 35 years of data were available for all countries. Complete data for all 49 years were only available for two countries, Malta and Austria, with 30 years or more of data available for 33 (64.7%) countries. Less than 10 years of data were available for three coun-tries: Cyprus (9 years), San Marino (7 years) and Turkey (4 years). The number of total CVD deaths was greater in women than men in 42 out of 51 countries for the most recent available year. Furthermore, a higher percentage of total deaths that were from CVD were found in women in
48 out of 51 countries (Table1).
CVD rates calculated using the 1976 ESP were on average half the size of rates calculated using the 2013
ESP (mean rate difference = 1.95; P< 0.001). The mean
rate difference was 1.86 for men and 2.03 for women. ASMR13s were more than twice as large as ASMR76s in males for eight countries (Austria, Iceland, Italy, Kazakhstan, Netherlands, Norway, San Marino, Sweden, and Switzerland). In females, ASMR13s were more than
twice as large as ASMR76s for more than three quarters
of countries (Table2).
Mean CVD rates calculated using both ESPs were sig-nificantly lower in females than males (mean rate males, ASMR76 = 560.8, ASMR13 = 1031.5; mean rate females,
ASMR76 = 375.3, ASMR13 = 751.3,P< 0.001), but females
had a significantly greater proportional difference in rates when comparing the ASMR76s and ASMR13s (mean
rate difference; males = 1.86, females = 2.03, P< 0.001).
Spearman’s rank coefficient showed that ranks of
countries by ASMRs calculated using the two ESPs were
different for both sexes (Spearman’s rho for men 0.995,P
< 0.001; Spearman’s rho for women 0.97,P< 0.001).
The largest changes in ranking were found for males in Kazakhstan which was six places lower when the ranking was compared between ASMR13 and ASMR76. In women, Ukraine was four places lower. In both sexes, Central Asian and Eastern European countries moved the most number of ranked places. In men, Central Asian and Eastern European countries generally moved down the ranking, and for women, these countries generally moved up. For both sexes, the top two and bottom three countries remained the same for rates
calculated using both ESP (Table3).
A majority of countries in both sexes showed a nega-tive ASMR trend calculated using both ESPs. Joinpoint analyses showed no difference in the direction of trend between ASMRs. There were four countries (Albania, Slovenia, Tajikistan, and Turkey) in men and eight coun-tries (Azerbaijan, Belarus, Montenegro, San Marino, Serbia, Slovakia, Slovenia, and Turkey) in women that have a continuous linear trend (no joinpoints identified).
In men, seven countries (San Marino, Austria, Belarus, Azerbaijan, Lithuania, Romania, and Hungary) had a greater decrease in the trend for ASMR13 than ASMR76. This was found in three countries for women (Belarus, Latvia, and Russia). A greater increase in trend in ASMR13
Table 3Ranking number for countries from lowest to highest cardiovascular disease mortality rates (per 100,000), by latest available
year(Continued)
Country Males Change
in ranking
Females Change
in ranking
1976 ESP 2013 ESP 1976 ESP 2013 ESP
Sweden 13 14 −1 14 14 0
Switzerland 5 9 −4 9 8 1
Tajikistan 44 44 0 44 43 1
TFYR Macedonia 41 42 −1 42 46 −4
Turkey 24 24 0 24 25 −1
Turkmenistan 51 51 0 51 51 0
The UK 10 7 3 7 4 3
Ukraine 50 50 0 50 47 3
Uzbekistan 48 49 −1 49 50 −1
Table
5
Average
annual
percentage
changes
and
joinpoint
analysis
by
country
and
sex
by
recent
available
year
in
females
(Co
ntinued)
Count
ry
Average
an
nual
percen
tage
chang
e
(A
APC)
Joinp
oint
an
nual
percen
tage
chang
e
(A
PC)
and
end
year
for
each
se
gment
in
the
best
fitting
model
Fema
les
Segm
ent
1
Segment
2
Segment
3
Segm
ent
4
Se
gment
5
ESP
13
1.8
(
−
0.3,
3.8)
1981
0.5
1989
15.9
1992
−
6.
4
^
The
UK
ESP
76
–
2.7
^
(
−
3,
−
2.4)
1965
13.2
^
1969
−
2.
6
^
2001
−
5.
5
^
ESP
13
–
2.5
^
(
−
2.8,
−
2.3)
1965
13.1
^
1969
−
2.
5
^
2002
−
5.
4
^
Ukr
aine
ESP
76
0.1
(
−
0.2,
0.4)
1981
1.6
1985
−
4.
3
^
1991
8.1
1994
0.
4
20
12
−
2.7
^
ESP
13
0.1
(
−
0.2,
0.4)
1981
−
0.4
1988
−
8.
1
1991
9.1
^
1994
0.
5
20
12
−
2.4
^
Uz
bekistan
ESP
76
1.5
^
(0.9,
2)
1981
0.5
1990
7.4
^
1994
−
0.7
^
ESP
13
1.4
^
(0.9,
2)
1981
0.6
1990
7.5
^
1994
−
0.9
^
AAPC
refers
to
the
average
annual
percentage
change
over
the
entire
period
of
available
data,
APC
refers
to
annual
percentage
change
over
each
identified
joinpoint
segment
^Values
are
significantly
different
to
than ASMR76 was found in six countries for women (Albania, Bulgaria, Azerbaijan, Turkey, Kyrgyzstan, and Turkmenistan) and in one country for men (TFYR Macedonia). Four countries (Bulgaria, Russian Federation, Ukraine, and Uzbekistan) had a greater increase in trend for ASMR76 than ASMR13 in men and two in women
(Kazakhstan and Uzbekistan) (Table4).
Differences in the number of joinpoint segments between rates from both ESPs were found for five countries in men (Georgia, Lithuania, Norway, and Poland) and four countries (Albania, Estonia, Kyrgyzstan, and Lithuania) in women. A number of countries showed a plateau in recent trends, as defined by the most recent segment showing either a less steep decline than the preceding segment, no significant difference to zero, or an increase. These plateaus were identified at all times in trends of both ASMRs except for men in Georgia amongst whom a plateau found in the trend of ASMR76 was not
found when using ASMR13 (Table5).
Discussion
The 2013 ESP changes the relative burden of CVD mor-tality rates for European countries by sex. The 1976 ESP rates are half as high as those calculated using 2013 ESP in countries for both sexes, and the ranking of countries by CVD ASMR changed when calculating ASMRs using the different standard populations. Despite largely simi-lar trends between ASMR13 and ASMR76 for all coun-tries by sex, there were some differences in trends in ASMRs calculated using different ESPs.
Joinpoint analyses allowed us to compare trends in the log of ASMRs calculated using the old and new ESPs. This demonstrated that for most countries the direction and intensity of the trend in the two ASMRs were simi-lar, although some differences were apparent. In particular, a number of countries showed a difference in the intensity of the trend over the entire period, when comparing ESP76 to ESP13, although no country was found to have a change in the direction of the trend for either sex. Differences in intensity were more pro-nounced in countries when comparing the most recent trend, with one country demonstrating a change in the direction of the most recent segment.
Limitations of this research are that there is a variability
of global coverage and data quality [11]. Developed
tries use the vital record system whereas developing coun-tries use verbal autopsy, which are generally weaker and
not standardised [12,13]. Furthermore, the results in this
study may not be generalizable to countries outside of the WHO Europe Member States. However, findings are representable and internally valid because data were comparable between ESPs since the same data were used.
To our knowledge, this is the first paper to investigate trends in CVD mortality for all European countries. It is
also the first to compare ASMRs calculated using ESP13
and ESP76 [2]. Our finding that ASMR76 were half as
large as ASMR13s was similar to previous work inves-tigating deaths from coronary heart disease (CHD)
rather than CVD as done here [2]. We found no paper
that had investigated the difference between trends in ASMRs calculated using ESP13 and ESP76 in total CVD or subtype, although trends in CVD agreed with
pre-vious analysis on trends in CHD ASMRs [11] in most
countries. Differences in results between studies show a decrease in CHD ASMR in Bulgaria found in the
pre-vious [11] compared to an increase in CVD ASMR in
the present study. These differences may be due to garbage codes, defined as incomplete registration of death
and sex/age in the mortality data for CVD [14]. The
WHO reported that Bulgaria had a large amount of
garbage codes included for subgroups in CVD [15].
Such changes in standard populations can be confus-ing for policy makers and public alike, unless clarity is provided in the effect of such changes. We have demon-strated in this paper that the relative description of the burden of CVD mortality between countries occurs when changing the standard population used to calculate age-standardised rates. In addition, in some countries, the intensity and, in one country, the direction, of the most recent trend in CVD ASMRs was altered by the introduction of a new standard population, despite no change in the mortality and population data used to calculate them. Such changes can be misleading and care must be taken not to compare between analyses using different standard populations. ASMRs produce an esti-mate of mortality that relates to a standard population; this means it is only a useful measure when used com-paratively between estimates using the same population. Rates calculated using the actual population are better when calculating an absolute mortality measure. This means that ASMRs can prove confusing, such that there is merit in adopting a standard population that is as representative of the actual population as possible. The most recent ESP (2013) was introduced to better reflect the contemporary population distribution of Europe, so this remains the most suitable ESP for the calculation of standardised rates; it must be noted, however, that this change may alter how we discuss the relative burden of CVD mortality across the continent and in some cases within countries.
Conclusion
that policy makers understand the effect of changes in standard populations on these comparisons. Similar ef-fects as those found in CVD in Europe, due to the change in the European Standard Population, may be seen in other diseases that are also more prevalent in older age groups, such as cancer and dementia.
Abbreviations
ASMR:Age-standardised mortality rates; ASMR13: Age-standardised mortality
rates calculated using the 2013 European Standard Population; ASMR76: Age-standardised mortality rates calculated using the 1976 European Standard Population; CHD: Coronary heart disease;
CVD: Cardiovascular disease; ESP: European Standard Population; ESP13: 2013 European Standard Population; ESP76: 1976 European Standard Population; ICD: International Classification of Disease; UK: United Kingdom; WHO: World Health Organization
Acknowledgements
Not applicable
Authors’contributions
ST extracted the data, performed the data analysis and produced a first draft of the paper. NT and KW conceptualised and designed the project, and they also assisted on all aspects including data extraction, analysis and drafting the paper. All authors read and approved the final manuscript.
Funding
KW and NT were funded by the British Heart Foundation (grant URN: 006/ P&C/CORE/2013/OXFSTATS). No other funding was received for this work.
Availability of data and materials
The datasets generated and/or analysed during the current study are available in the European Detailed Mortality Database from the World Health Organization Regional Office for Europe repository: [https://gateway.euro.
who.int/en/datasets/european-mortality-database/].
Ethics approval and consent to participate
Not applicable
Consent for publication
Not applicable
Competing interests
The authors declare that they have no competing interests.
Author details
1
Centre on Population Approaches for Non-Communicable Disease Prevention, Nuffield Department of Population Health, University of Oxford,
Oxford, UK.2UCLA Comprehensive Vascular Neurology Program, Department
of Neurology, University of California at Los Angeles, 710 Westwood Plaza,
Los Angeles, CA 90095-17693, USA.3World Health Organization European
Office for Prevention and Control of Noncommunicable Diseases (NCD
Office), Moscow, Russian Federation.4Department for Health, University of
Bath, Bath BA2 7AY, UK.
Received: 28 March 2018 Accepted: 8 May 2019
References
1. Levi F, Lucchini F, Negri E, Vecchia CL. Trends in mortality from cardiovascular and cerebrovascular diseases in Europe and other areas of the world. Heart. 2003;88:119–24.
2. Townsend N, Nichols M, Scarborough P, Rayner M. Cardiovascular disease in Europe 2016: epidemiological update. Eur Heart J. 2016;0:1–14.
3. Wilkins E, Wilson L, Wickramasinghe K, Bhatnagar P, Leal J, Luengo-Fernandez R, Burns R, Rayner M, Townsend N. European Cardiovascular Disease Statistics 2017. European Heart Network, Brussels; 2017.
4. Evans J. Implementing the 2013 European Standard Population: the impact of selected upper age limits on mortality. London: Office for National Statistics; 2014.
www.ons.gov.uk%2Fons%2Fguide-method%2Fuser- guidance%2Fhealth-and-life-events%2Frevised-european-standard- population-2013--2013-esp-%2Fimpact-of-varying-the-2013-esp-upper-age-limit-on-mortality-statistics.doc&usg=AOvVaw15m0tzEPMrg7CGAPz5vVZq. Accessed 15 July 2016
5. Niederlaender E. Causes of death in the EU. In: Statistics in focus. European Communities. Luxembourg: Office for Official Publications of the European Communities; 2006.http://ec.europa.eu/eurostat/documents/3433488/
5440941/KS-NK-06-010-EN.PDF/2a6372ce-2b38-4b2a-bdb1-0de9cd48fa5c.
Accessed 15 July 2016.
6. Vujcic IS, Sipetic SB, Dubljanin ES, Vlajinac HD. Trends in mortality rates from coronary heart disease in Belgrade (Serbia) during the period 1990-2010: a joinpoint regression analysis. BMC Cardiovasc Disord. 2013;13:112. 7. Sans S, Kestoloot H, Force DKBOTT. The burden of cardiovascular diseases
mortality in Europe. Eur Heart J. 1997;18:1231–48.
8. Yazadanyar A, Newman AB. The burden of cardiovascular disease in the elderly: morbidity, mortality, and costs. Clin Geriatr Med. 2009;25(4):563–vii
https://doi.org/10.1016/j.cger.2009.07.007.
9. Eurostat EC. Revision of the European Standard Population. Report of Eurostat’s task force. Luxembourg: Publications Office of the European Union; 2013.
http://ec.europa.eu/eurostat/documents/3859598/5926869/KS-RA-13-028-EN.PDF/e713fa79-1add-44e8-b23d-5e8fa09b3f8fAccessed 17 July
10. Olubenga O. The impact of calculating mortality rates using the 2013 European Standard Population on causes of death. London: Office for National Statistics; 2013.
11. Nichols M, Townsend N, Scarborough P, Rayner M. Trends in age-specific coronary heart disease mortality in the European Union over three decades: 1980-2009. Eur Heart J. 2013;34:3017–27.
12. Pagidipati NJ, Gaziano TA. Estimating deaths from cardiovascular disease: a review of global methodologies of mortality measurement. Circulation. 2013;127:749–56.
13. Setal PW, Sankoh O, Roa C, Velkoff VA, Mathers C, Gonghuan Y, Hemed Y, Jha P, Lopez AD. Sample registration of vital events with verbal autopsy: a renewed commitment to measuring and monitoring vital statistics. Bull World Health Organ. 2005;83:611–7.
14. WHO. WHO methods and data sources for global causes of death 2000– 2011. Geneva: Department of Health Statistics and Information Systems, WHO; 2013.http://www.who.int/healthinfo/statistics/GHE_TR2013-3_COD_
MethodsFinal.pdf. Accessed 25 June 2016
15. WHO. European detailed mortality database. Copenhagen: World Health Organization Regional Office for Europe; 2015.https://gateway.euro.who.int/
en/datasets/european-mortality-database/. Accessed 25 June 2016
Publisher’s Note