ISSN: 2231-5381
http://www.ijettjournal.org
Page 44
Study of base doping rate effect on parallel vertical
junction silicon solar cell under magnetic field
1
Mohamed lemine OULD CHEIKH
,2Boureima SEIBOU,1 Mohamed Abderrahim Ould El Moujtaba , 1Khady FAYE, 3
Mamadou WADE, 1Grégoire SISSOKO
(1)
Labo
ratory of Semiconductors and Solar Energy, Physics Department, Faculty of Science and Technology, University Cheikh Anta Diop, Dakar, Senegal.(2) Mines, Industry and Geology School of Niamey- Niger
(3)
Electromechanical Engineering Department, Polytechnic School of Thies – Sénégal
Abstract:
In this work we suggest looking for influences of a constant magnetic field and the base doping rate on a parallel vertical junction silicon solar cell under multispectral illumination in static regime. A study on the coefficient and the length diffusion according to the magnetic field B and the doping rate Nb is made. The minority carriers density in the base was studied according to the depth of the base for various values of the base doping rate and the magnetic field. This study allows us to determine the influences of the doping rate and the magnetic field on the photocurrent density, the photovoltage, the space charge region capacitance.The study of these electrical parameters is done according to the concept of the junction surface recombination velocity of excess minority carriers. The logarithm of the capacitance versus photovoltage leads to transitional capacitance.
Keywords: Parallel vertical junction solar cell – Magnetic field –Doping rate
1 Introduction
The improvement of the performances and the quality of
solar cells is one concern major to which the current
research turns. Thus, the basic material for
manufacturing solar cells benefit ceaselessly
technological progress as well on the mode of the
manufacturing and the increase substrates as on the final
structure of the solar cell elaborated. For that purpose,
many researchare done on conventional solar cells, solar
cells with back field or B.S.F (Back Surface Field) [1,2],
monocrystalline and polycrystalline monofacial silicon
solar cells, polycrystalline and monocrystalline bifacial
silicon solar cell [3], vertical junctions solar cells, solar
cells with concentration...
The purpose of this article is to do a study on a parallel
vertical junction silicon solar cell under multispectral
illumination in static regime. A theoretical study of the
excess minority carriers in the base of the solar cell is
produced through continuity equation. With help of the
boundary conditions at the junction and at the middle of
the base, excess minority carriers density are studied and
lead to the expression of photocurrent density and
photovoltage. From, the well-known I-V characteristic
of the solar cell under illumination, electrical equivalent
model is established for low and high junction
recombination values giving respectively ideal generator
source of tension and current. Series and shunt
resistances are then deduced.
Space charge region capacitance is expressed depending
on junction recombination velocity. Logarithm of the
capacitance according to the photovoltage gives the
intrinsic capacitance.
2 Theoretical study
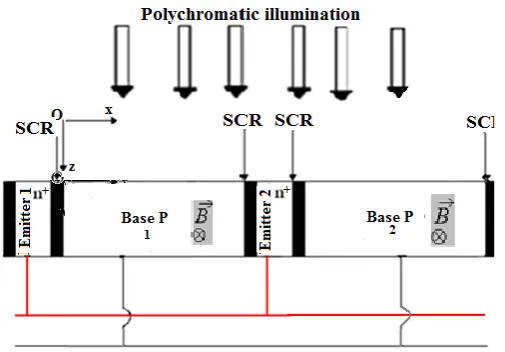
2.1 Solar cell description
A Parallel vertical junction silicon solar cell under
ISSN: 2231-5381
http://www.ijettjournal.org
Page 45
type n+- p – n+[4-5], is presented on figure 1. TheIllumination is carried out according to Oz axis. The
magnetic field B is represented perpendicularly to the
(xOz) plan.
Figure 1:Schema of aParallel vertical junction solar cell under magnetic field
2.2 Continuity equation
The continuity equation relative to the excess charge
carrier density in the base is expressed as follows:
Where is the excess minority carrier(i.e. electron),
in the p-base of thickness H.
G(z) is the carrier generation rate, its expression is given
by the following relation [6]:
Parameters ai and bi are coefficients deduced from solar
radiation under AM 1,5.
D(Nb,B)[7,10-13] represents the diffusion
coefficient of electrons generated in the base, it depends
on magnetic field and doping rate, its expression is :
D is diffusion coefficient without magnetic field
(D=35cm².s-1), µ is the electron mobility. Profile of
diffusion coefficient according to magnetic field B and
the doping rate of the base Nb is given on the following
figure:
Figure 2:Profile of diffusion coefficient according to magnetic field B and the doping rate Nb of the base
µ=1350cm².V.s-1 , D=35cm².s-1
For the low magnetic field values, the diffusion
coefficient remains constant, but when the field values
become more significant, the diffusion coefficient
begins to decrease. It can be explained by the magnetic
field effect which slows down or diverts the minority
carriers. The curve above presents two regions: the first
one 10-6 T≤ B ≤ 10-4 T, and the second for B > 10-4 T.
The low magnetic fields (B ≤ 10-4 T) are without effect
on the minority carrier‟s diffusion; however it is strongly
affected for magnetic field values beyond 10-4 T. So we
can see the strong reduction of the diffusion coefficient
which passes 26 cm2.s-1 at approximately 8cm2.s-1. The
carrier‟s diffusion becomes quasi-impossible when the
solar cell is plunged into a strong magnetic field (B > 10
-3
ISSN: 2231-5381
http://www.ijettjournal.org
Page 46
We can observe on this figure that the diffusioncoefficient also decreases with the base doping; indeed,
if the doping of the base increases, the recombination
phenomena also increase.
As for the magnetic field influence on the conduction
phenomenon in the solar cell, we can use the diffusion
length of the minority carriers which is linked to the
diffusion coefficient.
is the diffusion length of excess minority carriers
when solar cell is placed under magnetic field. It‟s given
by the following relation:
τ (Nb)is the minority carriers lifetime.
It is expressed as [14]:
The diffusion length profile according to magnetic field
B and the doping rate of the base Nb is presented on
figure3:
Figure 3:Profile of diffusion length according to magnetic field B and the doping rate Nb of the base.
µ=1350cm².V.s-1 , D=35cm².s-1
For the low magnetic field values, the diffusion length
remains constant. But when the magnetic field becomes
more and more important, the diffusion length decreases
gradually. It can be explained by the magnetic field
effect which slows down or diverts the minority carriers.
We can observe also on this figure that the diffusion
length decreases with the base doping rate.
The phenomena of diffusion, conduction and generation
are linked by the continuity equation which has for
general solution:
With
Where coefficients A and C are determined from the boundary conditions.
a) At Junction x=0 :
Electrons undergo recombination at junction
Emetter1-Base1 (x = 0) of the solar cell. This recombination at the
junction is characterized by junction surface
recombination velocity Sf[15-18].
At the middle of the base x = H/2:
At the middle of the base, x = H/2, the gradient of
the minority carriers density, far from the junction is
null [19].H is the solar cell the base thickness.
3 Results and discussion
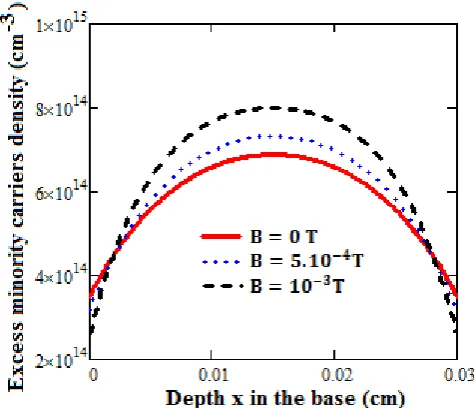
3.1 Excess minority carriers density
We present on figure 4 the minority carriers density
versus x ,depth in the base for various applied magnetic
field values: 16
10
5
1
12
)
(
ISSN: 2231-5381
http://www.ijettjournal.org
Page 47
Figure 4 :Minority carriers Density in the base versus depth for various magnetic field
We note that in the zone (x0 = H/2), the gradient
of the minority carriers density is positive, and it
corresponds to a passage of electrons flux giving a
photocurrent in the junction emitter1-base1. For ,
the minority carriers density in the base is maximal, its
gradient is null. In region , the gradient of the
minority carriers density in the base is also positive
because there is another junction between the base and
the second emitter situated in the position x = H, we also
note a passage of electrons flux in this junction.
Near the junctions, the minority carriers density
decreases when the magnetic field intensity increases.
More the electrons are photogenerated near to the
junctions more they are likely of all to pass them
(presence of junction surface recombination velocity),
which gives us a minimal density at the various
Base-emitter junctions. This phenomenon is accentuated in the
presence of strong magnetic field. However near x0 =
H/2, the minority carriers density increases with the
magnetic field. Indeed as we have already noted it, with
magnetic field presence, the charge carriers are deviated
from their initial trajectory entailing a blocking in the
base.
On figure 5 we give the profile of minority carriers
density versus x, depth in the base for various doping
rate values:
Figure 5:Minority carriers density in the base versus depth for various doping rate of the baseNb
We observe that the minority carriers density decreases
with doping rate of the base but this decrease is
especially marked for the strong base doping. Indeed, if
the base doping increases, it means that the impurities
within the material increase: This entails an increase of
recombination in bulk and consequently a decrease of
the density of these carriers.
3.2 Photocurrent density:
The photocurrent density of a solar cell is deduced from
the minority carriers density gradient at junctions. Its
expression is given by:
ISSN: 2231-5381
http://www.ijettjournal.org
Page 48
a) Magnetic field effect on photocurrent
density :
Figure 6 illustrates the effect of magnetic field on the
photocurrent density:
Figure 6 :Photocurrent density versus junction surface recombination velocity for various magnetic field.
For a given magnetic field, the density of photocurrent
increases with the junction surface recombination
velocity Sf, which also indicates the operating point of
the solar cell. Then we observe three regions.
i)The first one for the low Sf values(< 2.102cm.s-1)
corresponding to open circuit condition where the
photocurrent density is minimal.
ii) The second region, corresponds to high Sf
values(>4.104 cm.s-1) and leads to short-circuit condition
where photocurrent density is maximal(short circuit
current).
iii) The third region is located between, both first and
second regions and represents current for operating
points (2.102cm.s-1< Sf <4.104 cm.s-1), between open
circuit and short circuit conditions( The photocurrent
decreases with the magnetic field intensity, the low
magnetic field values are almost without effects on the
photocurrent.
This decrease is due to the low flow minority carriers
which cross the junctions base-emitter for contributing
to photocurrent.
Doping rate effect on photocurrent density
Figure 7 illustrates variation of photocurrent density
versus junction recombination velocity for various
doping rate:
Figure7:Photocurrent density versus junction recombination velocity for various doping rate of the base.
Figure7 shows that the photocurrent density decreases
with the doping rate of the base. These results are in
good agreement with those found for diffusion
coefficient of the minority carriers in the base. Indeed
the carriers which cross the junction become low for
strong doping rate. The increase of the doping rate
induces an increase of impurities in the solar cell thus a
large part of the minority carriers recombines in the base;
that explains the diminution of the photocurrent with the
doping rate.
ISSN: 2231-5381
http://www.ijettjournal.org
Page 49
3.3 Photovoltage
The photovoltage of the solar cell is determined by the
Boltzmann‟s expression :
Where No is the intrinsic concentration of the minority
carriers (6,78.109cm 3 ) and Nb is the base doping rate
(cm-3).
V
T is the thermal voltage and k is theBoltzmann‟s constant (1,38.10-23 m2 kg s-2 K-1). T is the
absolute temperature.
a) Magnetic field effect on photovoltage :
On figure 8 is presented the profile of photovoltage
versus junction surface recombination velocity for
various magnetic field values:
Figure 8: Photovoltage versus junction surface recombination velocity for various magnetic field values
z = 0,0002 cm ;
For a given magnetic field, the photovoltage decreases
with junction recombination velocity. Indeed for low Sf
values, the photovoltage is almost constant and
corresponds to the open circuit condition where excess
minority carriers are blocked and stored at the junction.
When the junction recombination velocity Sf increases,
these charge carriers cross through the junctions, and
then the photovoltage decreases.
Photovoltage also decreases when the magnetic field
intensity increases. But this decrease is low near the
open circuit. This decrease is explained by the fact that
when the magnetic field increases, the minority carriers
density near the junctions decreases.
b)Doping rate effect on photovoltage:
Profile of the photovoltage versus junction
recombination velocity for different doping rate Nb is
presented in the following figure.
Figure 9:photovoltage versus junction recombination velocity for different doping rate
z = 0,0002 cm ;
We observe an increase of the photovoltage with the
doping rate because of the decrease of diffusion
coefficient. So the space charge region width is
inversely proportional to doping rate: when the doping
of the base increases, the space charge zone width
decreases, we shall thus have fewer carriers collected by
ISSN: 2231-5381
http://www.ijettjournal.org
Page 50
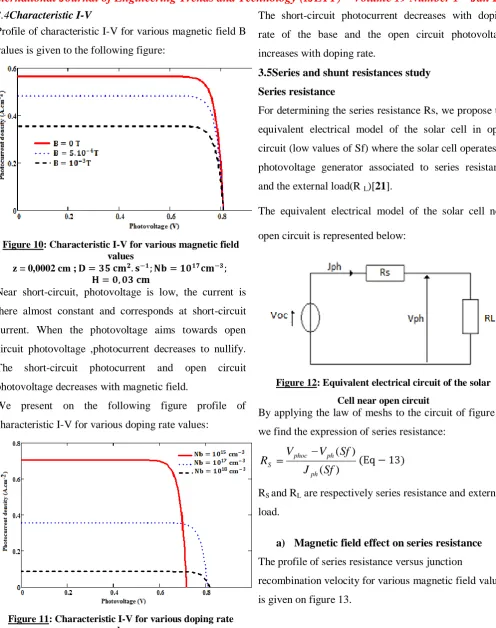
3.4Characteristic I-V
Profile of characteristic I-V for various magnetic field B
values is given to the following figure:
Figure 10: Characteristic I-V for various magnetic field values
z = 0,0002 cm ;
Near short-circuit, photovoltage is low, the current is
there almost constant and corresponds at short-circuit
current. When the photovoltage aims towards open
circuit photovoltage ,photocurrent decreases to nullify.
The short-circuit photocurrent and open circuit
photovoltage decreases with magnetic field.
We present on the following figure profile of
characteristic I-V for various doping rate values:
Figure 11: Characteristic I-V for various doping rate values
z = 0,0002 cm ;
The short-circuit photocurrent decreases with doping
rate of the base and the open circuit photovoltage
increases with doping rate.
3.5Series and shunt resistances study Series resistance
For determining the series resistance Rs, we propose the
equivalent electrical model of the solar cell in open
circuit (low values of Sf) where the solar cell operates as
photovoltage generator associated to series resistance
and the external load(R L)[21].
The equivalent electrical model of the solar cell near
open circuit is represented below:
Figure 12: Equivalent electrical circuit of the solar Cell near open circuit
By applying the law of meshs to the circuit of figure12,
we find the expression of series resistance:
) (
) (
Sf J
Sf V V R
ph ph phoc S
RS and RL are respectively series resistance and external
load.
a) Magnetic field effect on series resistance
The profile of series resistance versus junction
recombination velocity for various magnetic field values
ISSN: 2231-5381
http://www.ijettjournal.org
Page 51
Figure 13:Series resistance versus junction recombination velocity for various magnetic field values
z = 0,0002 cm ;
b) Doping rate effect on series resistance
On figure 14, we give the profile of series resistance
versus junction recombination velocity for various
doping rate.
Figure 14:Series resistance versus junction recombination velocity for various doping rate values
z = 0,0002 cm ;
From figures 13 and 14, series resistance is constant for
low Sf value(open circuit condition), and varies
significantly with the doping rate and less sensitive with
the magnetic field.
Shunt resistance
For determine the shunt resistance Rsh, the equivalent
electrical model of the solar cell in short circuit (high Sf
values (4.104cm.s-1<Sf< 6.106 cm.s-1) is proposed. In
short circuit situation the solar cell is presented as
current generator in parallel with the shunt resistance
and with the external charge RL [22]. The illustrative
model of this device is given to the figure 15:
Figure 15: Equivalent electrical model of the solar cell near short circuit
By applying the nodes law to the circuit 15, we find the
expression of the shunt resistance is obtained as
) ( ) (
Sf J J
Sf V R
ph phsc
ph Sh
Where Jphsc is the short-circuit photocurrent; its
expression is determined from the following
relation:
ph Sf phSC J
J
lim
RSh and RL are respectively the shunt resistance and the
external load.
a) Magnetic field effect on shunt resistance
We represent at figure 16 the shunt resistance versus
junction recombination velocity for various magnetic
ISSN: 2231-5381
http://www.ijettjournal.org
Page 52
Figure 16: Shunt resistance versus junction recombination velocity for various magnetic field values
z = 0,0002 cm ;
b) Doping rate effect on shunt resistance
Figure 17 is the plot of shunt resistance versus
junction recombination velocity for different Nb values.
Figure 17: Shunt resistance versus junction recombination velocity for various doping rate values
z = 0,0002 cm ;
Figures 16 and 17, show an exponential increase of Rsh
with junction recombination velocity. Increase is
important in the case of varying doping rate compare to
the applied magnetic field one.
3.6 Capacity study:
The capacity is obtained from the following expression:
ph
V
Q
C
Calculation leads to:
T
V
q
C
C
0(
0
)
With
T
V
Nb
ni
q
C
2
0
C0 is the intrinsic capacity of the solar cell under dark
(transition capacity due to fixed charges constituting the
Space Charge Region).
a) Magnetic field effect on capacity :
Figure 18 shows capacity variation versus junction
surface recombination velocity Sf for various magnetic
ISSN: 2231-5381
http://www.ijettjournal.org
Page 53
Figure 18 :Capacity versus junction recombination velocity for various magnetic field values
The capacity is maximal and almost constant for the low
junction recombination velocity values (Sf<2.102cm/s)
corresponding to open circuit situation. This is due to the
significant number of carriers stored at junction which
reduce the space charge region (SCR) and we obtain an
increase of the capacity. For the high junction
recombination velocity (Sf>4.104cm/s) corresponding to
short-circuit situation, the capacity decreases strongly.
This is due to the significant number of carriers which
cross the junction and we note an extension of the SCR
and thus the decrease of the capacity. The capacity
decreases with magnetic field but the low magnetic field
values (B<10-4T) have not a remarkable effect on the
capacity. More the field is intense, more the charge
carriers density decreases at junction.
Figure 19 below presents the logarithm of the capacity
versus photovoltage for various magnetic field values:
Figure 19: Logarithm of the capacity versus photovoltage for various magnetic field values
The logarithm of the capacity according to photovoltage
is a linear straight of slope 1 / VT. The ordinate
originally corresponds to ln(C0) value. We notice that
various curves present the same slope. We can say that
the capacity under dark C0 does not depend on the
applied magnetic field value. An extrapolation of these
curves on ordinate axis allows us to determine the
transition capacity Co of the solar cell [23].The C0
value obtained after extrapolation on ordinate axis is C0
=4,65.10-6 F/cm2.
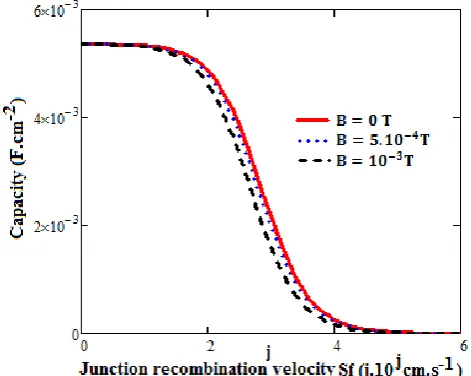
b) Doping rate effect on capacity:
Profile of the capacity versus junction recombination
velocity or different doping rate values Nb is represented
on the following figure:
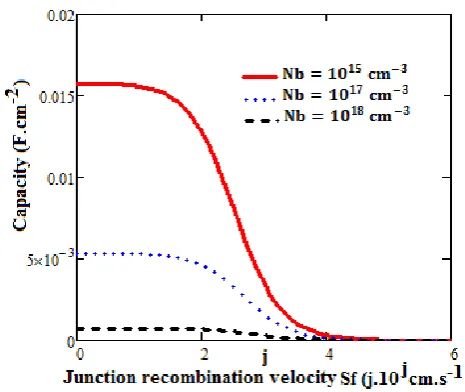
Figure 20 :Profile of the capacity versus junction recombination velocity for different doping rate values Nb
We note a decrease of the capacity with the doping rate
of the base. The recombination of carriers increase with
the doping of the base, what entails a decrease of the
minority carriers stored and thus a decrease of the
capacity.
Figure 21 below presents the logarithm of the capacity
ISSN: 2231-5381
http://www.ijettjournal.org
Page 54
Figure 21: Logarithm of the capacity versus photovoltage for different doping rate values
These curves also present a linear evolution. We can say
that the capacity without illumination C0 depends on the
doping rate value because an extrapolation of every
curve on ordinate axis gives us a particular intrinsic
capacity value.
Conclusion
In our study we were interested at the effects of the
doping rate and of the magnetic field on a parallel
vertical junction silicon solar cell under multispectral
illumination in static regime. We showed that the
photocurrent density decreases with magnetic field and
the doping rate. The photovoltage decreases when the
magnetic field increases, but then it increases with the
doping rate. Series and shunt resistances are deduced
from electrical model and are influenced by either the
doping rate or the applied magnetic field The capacity
decreases with the magnetic field and the doping rate of
the base.
We also obtained as result that the intrinsic capacity
depends on the doping rate; it doesn‟t depend on
magnetic field.
Referencies
[1] B. Equer, “ Energie solaires
photovoltaïque ”,volume 1, Collection Ellipses, 1993.
[2] R.M. Lago-Aurrekoetxea, C. del Cañizo, I. Pou, and A. Luque“Fabrication process for thin silicon solar
cells”, Proc. 17th European PVSEC,(Munich, 2001) 1519-1522.
[3] N. Bordin, L. Kreinin, N. Eisenberg,
“Determination of recombination parameters of bifacial silicon cells with a two layerstep-liked effect distribution in the base region”, Proc.17th European PVSEC, (Munich, 2001) 1495-1498.
[4]Daniel. L. Meier, Jeong-Mo Hwang, Robert B.
Campbell. IEEE Transactions on Electron Devices, vol.
ED-35, No.1, 1988, pp.70 – 78.
[5]A. Hübner, A.G.Aberle, and R. Hezel 20%
EfficientBifacial Silicon Solar Cells, 14th European PVSEC, (Munich, 2001) pp 1796 – 1798.
[6] JoseFurlan and SlavkoAmon, “Approximation of the carrier generation rate in illuminated silicon”, Solid State Electr, Vol.28, No.12, pp.1241-1243 (1985)
[7] Harold J. Hovel “semiconductors and
semimetals”volume 11 Solar Cells ACADEMIC PRESS New York San Francisco London 1975
[8] M. I.Ngom, B.Zouma, M. Zoungrana, M.Thiame,
Z. N.Bako, A. G. Camara, G.Sissoko“ Theoretical
study of a parallel vertical multi-junction silicon cell under multispectral illumination: influence of external magnetic field on the electrical parameters” International Journal of Advanced Technology & Engineering Research (IJATER); ISSN No:2250-3536Volume 2,Issue 6, Nov. 2012 pp 101-106.
[9] S. N. Mohammad, An alternative method for the performance analysis of silicon solar cells ,J. Appl. Phys. Vol 61.N0 2 767-772 1987
[10]R.M.Lago-Aurrekoetxea, C.del Can, Izo, I.Pou, and A.Luque, “Fabrication Process for thin silicon solar cells”, Proc.17th European PVSEC. (Munich, 2001) 1519-1522
[11 S. MADOUGOU, F. MADE, M. S. BOUKARY, AND G. SISSOKO
ISSN: 2231-5381
http://www.ijettjournal.org
Page 55
Advanced Materials Research Vols. 18-19 (2007) pp.303-312, online at http://www.scientific.net © (2007)
Trans Tech Publications, Switzerland - ISSN: 1022-6680 and ISBN: 0-87849-450-2d
[12] Th. Flohr and R. Helbig, “Determination of
minority-carrier lifetime and surface recombination velocity by Optical-Beam-Induced- Current measurements at different light wavelengths”, J. Appl. Phys. Vol.66 (7), (1989) pp 3060 – 3065.
[13] A. Dieng, A. Diao, A.S. Maiga, A. Dioum, I. Ly, G. Sissoko, “A Bifacial Silicon Solar Cell Parameters
Determination by Impedance Spectroscopy”, Proceedings of the 22nd European Photovoltaic Solar Energy Conference and Exhibition (2007), pp.436-440.
[14]D. Mathiot „‟Dopage et Diffusion dans le Silicium‟‟Institut d'Électronique du Solide et des Systèmes, InESS, UMR 7163, Laboratoire Commun CNRS – ULP
[15] Th. Pernau, P. Fath. E.
BucherPhotovoltaïcspecialists conference,
ConferenceRecord of the Twenty- Ninth IEEE, pp 442-445, (2002)
[16]Sissoko G., C. Museruka, A. Corréa, I. Gaye and A. L. Ndiaye, 1996. Light spectral effect on recombination parameters of silicon solar cell. Renewable Energy. 3: 1487-1490.
[17]G. Sissoko, E. Nanema, Y. L. B. Bocande, A. L.
Ndiaye, M. Adj World Renewable Energy Congress
(WREC) 1996, part III, pp.1594-1597.
[18] H.L.Diallo, A. Wereme, A. S. Maïga and G.
Sissoko, 2008. New approach of both junction and back
surface recombination velocities in a 3D modelling study of a polycrystalline silicon solar cell.Eur. Phys. J. Appl. Phys.,42: 203–11
[19] M. M. Dione, S. Mbodji, M. L. Samb, M. Dieng,
M. Thiame, S. Ndoye, F. I.Barro, G. Sissoko, Vertical
junction under constant multispectral light: determination of recombination parameters. Proceedings of the 24th European photovoltaic solar energy conference and exhibition, Hamburg, Germany (sept 2009), 465 – 468.
[20] S. MBODJI, B. MBOW, F. I. BARRO and G.
SISSOKO
A 3D model for thickness and diffusion capacitance of emitter-base junction determination in a bifacial polycrystalline solar cell under real operating condition
Turkish Journal of Physics, 35 (2011) , 281 – 291. http://journals.tubitak.gov.tr/physics/index.php
[21].K. Kotsovos,K. Misiakos,16th European
Photovoltaic Solar Energy Conference, 1-5 May 2000, Glasgow, UK
[22]
E.SOW,
S. MBODJI
, B. ZOUMA, M.
ZOUNGRANA, I. ZERBO, A. SERE and G.
SISSOKO.
“Determination in 3D modeling study of the width
emitter extension region of the solar cell operating
in open circuit condition by the Gauss‟s Law.”
International Journal of Science, Environment
and Technology (IJSET), Volume 1, N°4,
pp. 230 – 246, 2012; http://www.ijset.net
.[23] G. Sissoko, B. Dieng, A. Correa, M. Adj and D. Azilinin, „„Silicon Solar Cell Space Charge Region