Published online November 10, 2013 (http://www.sciencepublishinggroup.com/j/ijepp) doi: 10.11648/j.ijepp.20130104.16
Measuring progress toward environmental sustainability
using a quantitative model
Shaho Karami
1, Mohammad rezvani
2, Farzam Pourasghar Sanghachin
3, Hatef Marefat
41Phd Student in Environmental Education, Payame Noor University, Tehran, IRAN
2Department of Environment and Natural resources, Payame Noor University, Tehran, IRAN 3PhD in Environmental Planning, Faculty of Environment, University Of Tehran, Tehran, IRAN 4
Msc Student in Environmental Engineering, University of Tehran, Tehran, IRAN
Email address:
[email protected](Sh. Karami), [email protected](M. Rezvani), [email protected](F. P. Sanghachin), [email protected](H. Marefat)
To cite this article:
Shaho karami, Mohammad rezvani, Farzam Pourasghar Sanghachin, Hatef Marefat. Measuring Progress toward Environmental Sustainability Using a Quantitative Model. International Journal of Environmental Protection and Policy. Vol. 1, No. 4, 2013, pp. 79-87. doi: 10.11648/j.ijepp.20130104.16
Abstract:
During last tow century and after industrial revolution, especially in last fifty years, the world underwent considerable changes in its economical, social, technological and environmental areas. Crisis of underdevelopment, increasing effect of population on environment, uncontrolled exploitation and destruction of environment, poverty, malnutrition in developing countries, the growth of terrorism and social abnormalities, emerging diseases, a variety of social disorders, the income gap between rich and poor countries, and finally increasing destruction of environment are problems that affect human society, both developed and developing ones. Sure, continuity of this situation can face international community with a serious crisis which its miss effects will affect both developed and developing countries. Therefore, confronting these challenges require collaboration of all world countries. Thus, U.N. Millennium manifesto, in terms of millennium development goals in 2000, provided by U.N and approved by majority of world countries, Seventh goal of millennium, “Ensure environmental sustainability” was the main cornerstone of millennium development goals and reaching other goals and objectives of millennium development goals needs protecting environment and assuring its sustainability. By approving these goals, designed models and methods for determining actions and activities in terms of quantitative models. In this survey first, eight indicators of seventh MDG goals, some with positive relationship with sustainable development and some with negative relationship were chosen and information related to performances of 6 indices of 65 countries of world in years 1990, 1995, 2000 and 2005 extracted. After extracting indices and processing them, indices were standardized. In the next step and after standardizing, using McGranahan method, correlation matrix of indices was calculated by SPSS software and weight of each index was determined. After this step, weight of each index was multiplied on each standardized index and at the end composite index for each country was calculated for 1990, 1995, 2000 and 2005. Then, these composite indexes were sorted by descending. Stability numbers obtained using this method for Iran for these years are 141, 114, 131 and 139 respectively, which was always lower than the average of 65 countries. Iran’s rank was always between 40 and 45 showing undesirable performance which requires suitable actions.Keywords:
Ensure Sustainability of Environment, Composite Indicators, McGranahan Method, SPSS Software, Quantitative Model1. Introduction
During last tow century and after industrial revolution, especially in last fifty years, the world underwent considerable changes in its economical, social, technological and environmental areas [1][6] [7]. Over last five decades human society has advanced in many areas
environment, uncontrolled exploitation and destruction of environment, poverty, malnutrition in developing countries, the growth of terrorism and social abnormalities, emerging diseases, a variety of social disorders, the income gap between rich and poor countries, and finally increasing destruction of environment are problems that affect human society, both developed and developing ones. Sure, continuity of this situation can face international community with a serious crisis which its miss effects will affect both developed and developing countries. Therefore, confronting these challenges require collaboration of all world countries [1] [12] [14]. In other words, mentioned crisis cannot afford by short-term actions and reactive reactions or inconsistent policies, but with continued and targeted actions, due to them a reasonable level of development of international community to bring. thus, address the growing challenges in the third millennium, requires a new approach to development which put the man in focus and see the economic growth not as a goal but as a means and considers opportunities for future generations to live as important as present generations and puts special attention to biological systems in which human and other being life depends on [2] [13] [16].
In past years the international community witnessed several meetings to address problems of economic, social and specially environment, among them are 1972 summit on human environment in Stockholm, Sweden and earth summit in Rio De Jeneiro on environment and human development in 1992, however, many issues and problems on the eve of the third millennium still has glaring and therefore international community came to believe that it should ....On this basis the millennium development goals (MDG) raised and passed in largest heads of state meetings in September 2000 in New York. The objectives of these goals are a series of timed and measurable targets including combating hunger, poverty, disease, illiteracy, environmental degradation and gender inequality and also create a global partnership for development which has been approved by the countries [3] [15] [17].
2. Materials and Methods
In order to prepare compiled indexes, first we extracted and classified millennium goals indexes for a number of countries from millennium goals index database of United Nations. since the indicators used in seventh goal of millennium development goals are not in the same scale and some are in percent (such as access to safe and healthy drinking water) and some in tons (such as per capita consumption of ozone depleting substances or carbon dioxide emissions), thus adding these indicators with different scales to achieve a combined index is not possible. Therefore it is essential to convert these indices to standard units so it is possible to collect them. Although the methods for achieving standard scales, which is called normalization, are not without problems, but they are ways used for achieving combined indices. In this research, for
normalization we used "Division by Mean" method. In this method, after extraction of selected indicators and countries, values of each indicator was divided by the mean of all indicators in the column, resulting a new indicator without scale. To implement this method, the following formula is used [4][10]:
Y=Xij/X
=the amount fixed by the scale =value of index in country j
=mean of each index in every column
After normalization of each column, it is necessary to calculate appropriate weight of each indicator. In this study, we used McGranahan method (1970) for weighting which calculated using SPSS package. After calculation of weight of each indicator, it was multiplied by previously calculated scale-less indices. Then, calculated values in each row were added to get combined indicator (sustainability number) for each country. Combined indicators are sorted in descending order based on which we can determine the ranking of selected countries [1].
2.1. Background and Framework of the Millennium Development Goals
The Millennium Development Goals (MDGs) are eight international development goals that all 193 United Nations member states have agreed to achieve by the year 2015. They include eradicating extreme poverty, reducing child mortality rates, fighting disease epidemics, and developing a global partnership for development. With goals approved, the world leaders again gathered in Mexico City in March 2002 for purpose of financing for millennium development and provide a framework that was a milestone in the global partnership for millennium development based on which developed and developing countries agreed to reduce poverty through joint action. In the same year, UN member countries in the World, attended in Summit on Sustainable Development (WSSD) in Johannesburg, South Africa in which again achieving millennium goalswas reiterated. Also based on Monterrey consensus on March 22, 2002 in Mexico, developing countries need to expand mobilize domestic resources to provide finance resources for MDG-based poverty reduction strategies, using government revenues, household contributions and private investment to the greatest extent possible. In many low-income countries, and virtually all underdeveloped countries, domestic resources alone are not sufficient to achieve the Millennium Development Goals. For this reason, in the eighth goal, on developed countries to assist developing countries is emphasized [5].
2002.This year, the 7/0% of GDP was endorsed by all countries in the Monterrey Consensus. Parallel to these developments, many countries around the world committed to include the millennium development goals in their short and medium term policies and programs and report progresses annually to the United Nations. Furthermore, to institutionalize the MDGs, many countries established structures such as national committee of millennium development goals and has begun widespread actions in different areas of the Millennium Development Goals, including seventh goal.
2.2. Statistical Analysis and Calculation of Composite Indicators for MDG Goal Seven, for selected Countries in Years 1990, 1995, 2000 and 2005
In the present study, first, eight indicators of seventh MDG goals (Ensure environmental sustainability), some with positive relationship with sustainable development and some with negative relationship were chosen as follows:
− ratio of area of land covered by forest to area of the country
− ratio of area of protected land (for biodiversity conservation ) to The total area of the country
− Energy consumption(per kg of oil equivalent) per dollar
− GDP based on “purchasing power parity”(PPP)
− Per capita carbon dioxide emissions and
consumption of ozone depleting substances
− Proportion of population using solid fuels
− ratio of urban and rural populations have a stable source of clean water and sanitation
− ratio of urban and rural population have good health of the environment
− ratio of population have adequate housing (in the form of ownership, rental, the purchase of housing, community or secondary tenant)
Among the factors mentioned above, the use of some indicators, due to lack of data for many countries and remote data for some of them, also due to different definitions of the indicators(For example, the ratio of population have adequate housing) was not possible and for this reason among 8 indicators above, 6 of them were chosen as follows:
− X1: ratio of area of land covered by forest to area of the country as a percentage (positive relationship
with sustainable development)
− X2: ratio of area of protected land (for biodiversity conservation ) to The total area ofthe country (positive relationship with sustainable development)
− X3: energy consumption(per kg of oil equivalent) per dollar of GDP on a purchasing power parity(PPP) (negative relationship with sustainable development)
− X4: the tones total carbon dioxide emissions per year(negative relationship with sustainable development)
− X5: ratio of urban and rural population have sustainable sources of clean water and sanitation as a percentage (positive relationship with sustainable development)
− X6:ratio of urban and rural population have good health of the environment (positive relationship with sustainable development)
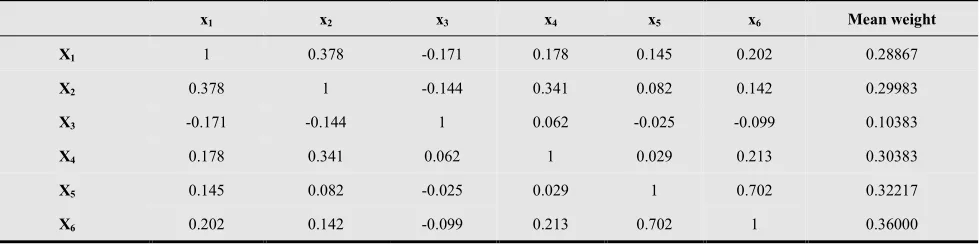
After selecting indicators, the raw data for each of the indices were collected for 65 countries from different regions of the world from Millennium Development Goals database, in the four-period 1990, 1995, 2000 and 2005. After extracting the data, the table (countries in rows and indicators in columns) was prepared. As from six indicators, tow was in negative relationship with sustainable development, first we transform them so that they have positive direction. For this purpose, the values of each of the indicators were deducted from a constant. After this, related indicators for each country standardized by dividing each value by the average to allow comparison. After standardization, the weight of each indicator should be calculated for each of the years studied. In this study, McGranahan method for weighting indicators is used. The McGranahan method assumption is this that the weights should be indicative of importance of an indicator among other indicators which is determined through the correlation of each indicator with others. In other words, in this method the more the correlation of a variable with other variables is, the more it weighted and vice versa. On this basis, to determine the weight of each indicator, correlation matrix was calculated for each of the indicators and the average correlation coefficient, as an indicative of importance of each indicator was calculated (Tables 1, 2, 3 and 4).
Table 1. Correlation matrix of indicators in 1990
Mean weight x6
x5
x4
x3
x2
x1
0.28867 0.202
0.145 0.178
-0.171 0.378
1
X1
0.29983 0.142
0.082 0.341
-0.144 1
0.378
X2
0.10383 -0.099
-0.025 0.062
1 -0.144
-0.171
X3
0.30383 0.213
0.029 1
0.062 0.341
0.178
X4
0.32217 0.702
1 0.029
-0.025 0.082
0.145
X5
0.36000 1
0.702 0.213
-0.099 0.142
0.202
Table 2. Correlation matrix of indicators in 1995 Mean weight x6 x5 x4 x3 x2 x1 0.244167 0.128 0.15 -0.167 0.08 0.274 1 X1 0.218 0.158 0.065 -0.322 0.133 1 0.274 X2 0.224 0.098 -0.023 0.056 1 0.133 0.08 X3 0.071833 -0.146 0.01 1 0.056 -0.322 -0.167 X4 0.313167 0.677 1 0.01 -0.023 0.065 0.15 X5 0.319167 1 0.677 -0.146 0.098 0.158 0.128 X6
Table 3. Correlation matrix of indicators in 2000
Mean weight x6 x5 x4 x3 x2 x1 0.278167 0.111 0.115 0.197 -0.081 0.327 1 X1 0.317833 0.221 0.118 0.372 -0.131 1 0.327 X2 0.123167 -0.097 0.04 0.008 1 -0.131 -0.081 X3 0.284167 0.12 0.008 1 0.008 0.372 0.197 X4 0.325667 0.673 1 0.008 0.04 0.118 0.115 X5 0.338 1 0.673 0.12 -0.097 0.221 0.111 X6
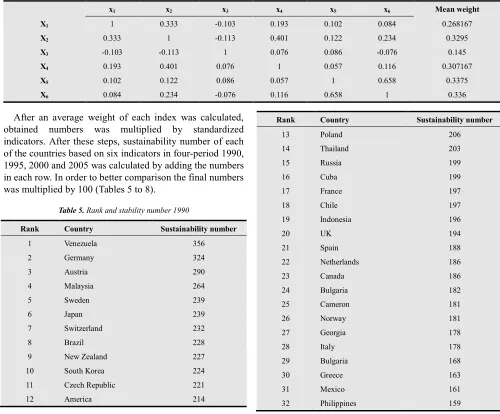
Table 4. Correlation matrix of indicators in 2005
Mean weight x6 x5 x4 x3 x2 x1 0.268167 0.084 0.102 0.193 -0.103 0.333 1 X1 0.3295 0.234 0.122 0.401 -0.113 1 0.333 X2 0.145 -0.076 0.086 0.076 1 -0.113 -0.103 X3 0.307167 0.116 0.057 1 0.076 0.401 0.193 X4 0.3375 0.658 1 0.057 0.086 0.122 0.102 X5 0.336 1 0.658 0.116 -0.076 0.234 0.084 X6
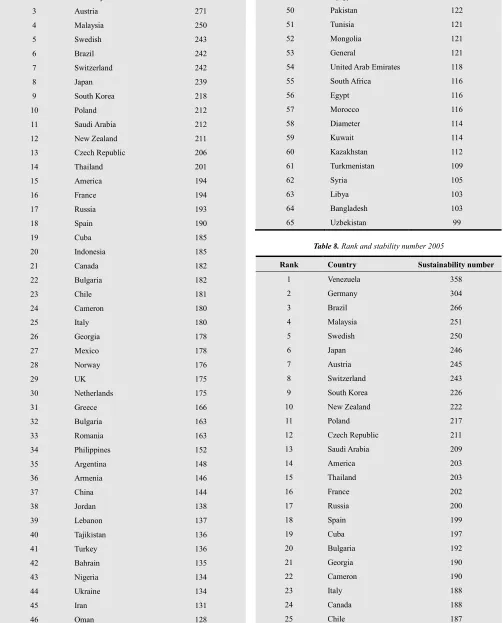
After an average weight of each index was calculated, obtained numbers was multiplied by standardized indicators. After these steps, sustainability number of each of the countries based on six indicators in four-period 1990, 1995, 2000 and 2005 was calculated by adding the numbers in each row. In order to better comparison the final numbers was multiplied by 100 (Tables 5 to 8).
Table 5. Rank and stability number 1990
Rank Country Sustainability number
1 Venezuela 356
2 Germany 324
3 Austria 290
4 Malaysia 264
5 Sweden 239
6 Japan 239
7 Switzerland 232
8 Brazil 228
9 New Zealand 227
10 South Korea 224
11 Czech Republic 221
12 America 214
Rank Country Sustainability number
13 Poland 206
14 Thailand 203
15 Russia 199
16 Cuba 199
17 France 197
18 Chile 197
19 Indonesia 196
20 UK 194
21 Spain 188
22 Netherlands 186
23 Canada 186
24 Bulgaria 182
25 Cameron 181
26 Norway 181
27 Georgia 178
28 Italy 178
29 Bulgaria 168
30 Greece 163
31 Mexico 161
Rank Country Sustainability number
33 Nigeria 155
34 Jordan 154
35 Armenia 154
36 Argentina 152
37 Romania 151
38 Ukraine 145
39 Saudi Arabia 143
40 Iran 141
41 China 139
42 Algeria 138
43 Turkey 138
44 Lebanon 136
45 Pakistan 132
46 Oman 127
47 United Arab Emirates 127
48 South Africa 123
49 Diameter 121
50 General 121
51 India 120
52 Kyrgyzstan 120
53 Kuwait 120
54 Tunisia 118
55 Turkmenistan 114
56 Kazakhstan 113
57 Morocco 112
58 Uzbekistan 108
59 Libya 108
60 Bahrain 108
61 Syria 108
62 Bangladesh 104
63 Egypt 102
64 Mongolia 99
65 Tajikistan 95
Table 6. Rank and stability number 1995
Rank Country Sustainability number
1 Venezuela 317
2 Germany 238
3 Austria 219
4 Malaysia 202
5 Saudi Arabia 191
6 Japan 188
7 Swedish 187
8 Switzerland 186
9 Spain 183
10 Brazil 181
11 Czech Republic 176
12 South Korea 175
13 Poland 174
Rank Country Sustainability number
14 New Zealand 172
15 Thailand 162
16 Russia 158
17 Bulgaria 154
18 Cuba 153
19 America 153
20 Chile 152
21 Netherlands 151
22 Indonesia 150
23 UK 150
24 Canada 150
25 Norway 144
26 Italy 144
27 United Arab Emirates 143
28 Georgia 140
29 Cameron 138
30 France 136
31 Bulgaria 135
32 Greece 135
33 Mexico 134
34 Romania 134
35 Jordan 128
36 Philippines 128
37 Armenia 127
38 Argentina 125
39 Bahrain 125
40 Ukraine 119
41 Tajikistan 119
42 Lebanon 116
43 Nigeria 116
44 Iran 114
45 Turkey 112
46 Algeria 111
47 Oman 110
48 China 109
49 General 107
50 Uzbekistan 105
51 Kazakhstan 105
52 Kyrgyzstan 104
53 Diameter 104
54 Kuwait 103
55 Pakistan 102
56 Turkmenistan 102
57 South Africa 100
58 Tunisia 99
59 Mongolia 98
60 India 94
61 Morocco 94
62 Libya 92
63 Syria 92
64 Egypt 90
Table 7. Rrank and stability number 2000
Rank Country Sustainability number
1 Venezuela 364
2 Germany 294
3 Austria 271
4 Malaysia 250
5 Swedish 243
6 Brazil 242
7 Switzerland 242
8 Japan 239
9 South Korea 218
10 Poland 212
11 Saudi Arabia 212
12 New Zealand 211
13 Czech Republic 206
14 Thailand 201
15 America 194
16 France 194
17 Russia 193
18 Spain 190
19 Cuba 185
20 Indonesia 185
21 Canada 182
22 Bulgaria 182
23 Chile 181
24 Cameron 180
25 Italy 180
26 Georgia 178
27 Mexico 178
28 Norway 176
29 UK 175
30 Netherlands 175
31 Greece 166
32 Bulgaria 163
33 Romania 163
34 Philippines 152
35 Argentina 148
36 Armenia 146
37 China 144
38 Jordan 138
39 Lebanon 137
40 Tajikistan 136
41 Turkey 136
42 Bahrain 135
43 Nigeria 134
44 Ukraine 134
45 Iran 131
46 Oman 128
Rank Country Sustainability number
47 Algeria 124
48 India 122
49 Kyrgyzstan 122
50 Pakistan 122
51 Tunisia 121
52 Mongolia 121
53 General 121
54 United Arab Emirates 118
55 South Africa 116
56 Egypt 116
57 Morocco 116
58 Diameter 114
59 Kuwait 114
60 Kazakhstan 112
61 Turkmenistan 109
62 Syria 105
63 Libya 103
64 Bangladesh 103
65 Uzbekistan 99
Table 8. Rank and stability number 2005
Rank Country Sustainability number
1 Venezuela 358
2 Germany 304
3 Brazil 266
4 Malaysia 251
5 Swedish 250
6 Japan 246
7 Austria 245
8 Switzerland 243
9 South Korea 226
10 New Zealand 222
11 Poland 217
12 Czech Republic 211
13 Saudi Arabia 209
14 America 203
15 Thailand 203
16 France 202
17 Russia 200
18 Spain 199
19 Cuba 197
20 Bulgaria 192
21 Georgia 190
22 Cameron 190
23 Italy 188
24 Canada 188
Rank Country Sustainability number
26 Mexico 186
27 Indonesia 186
28 Norway 180
29 Netherlands 179
30 UK 178
31 Romania 177
32 Greece 174
33 Bulgaria 170
34 Philippines 157
35 Armenia 155
36 Argentina 152
37 China 149
38 Tajikistan 144
39 Bahrain 144
40 Lebanon 143
41 Turkey 143
42 Ukraine 141
43 Iran 139
44 Jordan 138
45 General 133
46 Oman 132
47 Nigeria 132
48 India 131
49 Tunisia 130
50 Pakistan 129
51 Kyrgyzstan 128
52 Algeria 127
53 Mongolia 126
54 United Arab Emirates 125
55 Morocco 124
56 Egypt 123
57 South Africa 122
58 Kuwait 121
59 Diameter 118
60 Kazakhstan 117
61 Turkmenistan 116
62 Syria 114
63 Uzbekistan 112
64 Libya 110
65 Bangladesh 109
3. Results
Base on analysis of combined indices of 65 countries in 1990, three countries Venezuela, Germany and Austria with respective sustainability numbers of 356, 324 and 290 have the highest sustainability numbers and three countries Tajikistan, Mongolia and Egypt with respective sustainability numbers of 95,99 and 102 have lowest sustainability numbers and were at the bottom of the list.
Average number of sustainability for these countries was 167. In this list Iran’s rank with sustainable number 141, were 40. That show poor performance in this area.
In 1995 the three countries, Venezuela, Germany and Austria have also topped the table and sustainability numbers for them respectively were 317, 238 and 219. Bangladesh, Egypt and Syria, respectively with sustainability numbers 81, 90 and 92 have lowest numbers. Average sustainability number of these countries in 1995 was equivalent to 139. Iran’s rank with sustainable number 114, were 44.which was lower than the average of countries.
In 2000, still Venezuela, Germany and Austria, with sustainability numbers 364, 294 and 271were at the top of the list and three countries Uzbekistan, Bangladesh and Libya, respectively with sustainability numbers 99,102 and 103 were in the bottom of the list. Average sustainability number for the mentioned countries in 1995 was166. Iran’s rank with sustainable number 131, were 45.
In 2005, Venezuela and Germany still maintained their position and sustainability number for them are respectively, 358 and 304. In this year, Austria which was at the top of the list in the previous section, declines four steps down from the third to the seventh rank. Also in 2000, three countries, Bangladesh, Libya and Uzbekistan has been the worst performance and the sustainability number for them are109, 110 and 112 respectively. Average of 65 countries is 172. In 2005, the stability number of Iran was 139, and its rank was 43, which is tow grade better in comparison with 2000.
for these method is mainly on the nature of the sub-indices, therefore, if appropriate sub-indices are selected, using the composite indexes we can better analyze and evaluate the performance of countries and even regions and provide more realistic planning and policies to implement. For example, indicators of utilization and use of water in some arid and dry countries of the world is more important than the indicator of the ratio of area of land covered by forest to area ofthe country and therefore it is necessary, these indicators to be considered further and raised as Millennium Goals for that countries.
4. Conclusion
Environmental protection and maintaining its stability, emphasized on the Millennium Development Goal Seven, require the acquisition of new patterns of development and exploitation of environmental and natural resources in which the basic needs of the present generation fulfilled, and also provide mechanisms to allow future generations to take advantage of these blessings. This new approach of development, which placed the maintenance and sustainability of environment along with other components of development in the center of attention, and in the development literature, is known as sustainable development, tries to strike a balance between resources and tolerable capabilities of earth, and human needs and purposes. Ensuring environmental sustainability, the seventh goal, which is explained based on three sub-goal and eight sub-indices (indices 25 to32) and has been approved by the vast majority of countries, indicates a deep understanding of the international community of the importance of environment in achieving the other Millennium Development Goals and aspirations. In fact, many environmental problems that already plagued the international community is rooted in the ideals of the Millennium Development Goals .For example, the root of many environmental problems, especially in developing countries, arises due to poverty (MDG goals I), because, more poverty, causes environmental degradation and environmental degradation on its own trigger more poverty and this vicious cycle can eventually lead in economic, social and environmental collapse. On this basis and in order to maintain life-sustaining systems of the earth and its resources, approaches and sources of production and consumption patterns must change in line with the ideals and goals of Millennium Development Goals in general and seventh goal in particular. After acceptance and approval of MDG indicators in 2000 by the international community, many attempts to achieve these objectives and policies began by the countries and subsequently, the need for methods to monitor and evaluate policies and programs to achieve these objectives in the form of composite indicators began. In this paper we tried to analysis and compare constituent indicators of seventh goal using composite indexes in four-peroid 1990, 1995, 2000 and 2005.On this basis, for 65 countries which have complete data,
combination index was calculated for the four sections mentioned above. Based on these rankings, developed countries (except Venezuela due to the high surface area of forests and protected areas) due to the higher stability number were at the top of the list and the poor and developing countries were at the bottom of the list. Therefore, paying attention to environmental policies and programs and review of past development policies and programs, which typically only have economic growth targets is critical and it is necessary for environmental protection, in the framework of goals the Millennium Development Goals, to be supported more in the planning and policies of countries. Establishment of national committee and the provincial MDGs, promote popular participation and strengthening pro-environmental NGO, insert the Millennium Development Goals in various economic, social and environmental development programs, strengthen systems to collect statistics and information on the Millennium Development Goals, holding training courses and national conferences, facilitate communication of national organizations with international organizations, review policies and utilization of natural resources and environmental programs, etc. are among actions that countries can do to promote the goals of the seventh MDG goal. In response to international and regional challenges related to seventh goal of the Millennium Development Goals, new letters of agreement for coordination of national policies with international programs should be developed and the principle of shared but differentiated responsibilities, should be followed seriously by the United Nations in a way that the obligations of developed countries for environmental protection (due to their high share in the exploitation of earth resources and more pollution emissions) take more practical aspects and on the other hand, developing countries should also mobilize the resources in a way that these resources can be used best in line with goals of the Millennium Development, especially goal seven. This issue, especially about environment, which is a public commodity, and therefore less incentive to invest in by people and countries are more important and need more support than other goals from the governments.
References
[1] SH. Karami, GH. NabiBidhendi, H.R. Jafari, F. Pourasghare Sangachin, and A. Nejadi, Analysis and measuring seventh Goal Millennium development goals of selected countries by using composite indicators, the 3th International conference On Biological life sciences(ICBLS), Singapore, 2012.
[2] M.S. Common and S. Stagl, Ecological economic: an introduction, Cambridge university press, 2005, p52. [3] The Millennium Development Goals Report, United Nations,
(2008), available at: http://www.
[4] kh. Kalantari, Regional Planning and Development, Tehran, khoshbin press, 2002, p73.
[5] United Nations site for the MDG Indicators: http://mdgs.un.org/unsd/mdg/Default.aspx
[6] B. Backer, Sustainability Assessment: A Review of Value, Concepts and Methodological, Published by Consultative Group on International Agricultural Research, the World Bank, Washington D.C, 1997, pp27.
[7] D. Meadows, H. Dennis, and L. Meadows, limits to growth, Joren Randers and Willirsity, London, Earth Island, 1972,. [8] European Commission Joint Research Centre, Institute for
Protection and Security of the Citizen, Composite Indicators – An Information server on composite indicators and Ranking System (Methods , Case studies ,event), 2005. [9] Sustaining the environment to fight poverty and achieve
MDGs, Environment for the MDGs, United Nations Development Program, 2005.
[10] United Nations site for the MDG Indicators: http://mdgs.un.org/unsd/mdg/Default.aspx
[11] D.E. Sahn, D.C. Stifel, Progress toward the Millennium Development Goals in Africa, World Development, 2003, Vol 31, p.p 23–52.
[12] P.J. Nelson, the Millennium Development Goals, and the Future of Development Cooperation, World Development, 2011, Vol 35, p.p 2041–2055.
[13] M. Claeson, P. Folger, Health Issues of the UN Millennium Development Goals, International Encyclopedia of Public Health, 2008, p.p 197–204.
[14] L.D. Castelló, D. Gil-Gonzálezc, C. Alvarez-Dardet Diaz, I. Hernández-Aguado, The Environmental Millennium Development Goal: progress and barriers to its achievement, Environmental Science & Policy, 2010, Vol 13, p.p 154–163. [15] M. Pedercini, G.O. Barney, Dynamic analysis of
interventions designed to achieve millennium development goals (MDG): The case of Ghana, Socio-Economic Planning Sciences, 2010, Vol 44, p.p89–99.
[16] S. Accorsi, N.K. Bilal, P. Faresea, V. Racalbutoc, Countdown to 2015: comparing progress towards the achievement of the health Millennium Development Goals in Ethiopia and other sub-Saharan African countries, Transactions of the Royal Society of Tropical Medicine and Hygiene, 2010, Vol 104, p.p 336–342.