http://www.sciencepublishinggroup.com/j/jenr doi: 10.11648/j.jenr.20180702.11
ISSN: 2330-7366 (Print); ISSN: 2330-7404 (Online)
Estimation of Greenhouse Gas Emissions and Mitigation
Methods in Electrical Power Sector of Dire Dawa City from
2015 to 2025
Solomon Derbie Gont
*, Mikias Hailu Kebede
Electrical and Computer Engineering Department, Debre Berhan University, Debre Berhan, Ethiopia
Email address:
*
Corresponding author
To cite this article:
Solomon Derbie Gont, Mikias Hailu Kebede. Estimation of Greenhouse Gas Emissions and Mitigation Methods in Electrical Power Sector of Dire Dawa City from 2015 to 2025. Journal of Energy and Natural Resources. Vol. 7, No. 2, 2018, pp. 54-59. doi: 10.11648/j.jenr.20180702.11 Received: May 21, 2018; Accepted: June 7, 2018; Published: June 29, 2018
Abstract:
This manuscript reviews and compares the results of recent greenhouse gas (GHG) emission life-cycle analyses. Specific attention is paid to fossil energy technologies and renewable energy technologies (RETs). It is therefore desirable for GHG emissions under national, regional and international mitigation policies to be accounted for over its entire life-cycle. The results presented here indicate that the most significant GHG avoidance (in absolute terms) can be made from technology substitution. The introduction of advanced fossil fuel technologies can also lead to improvements in life-cycle GHG emissions. Overall, hydro, nuclear, solar and wind energy technologies can produce electricity with the least life-cycle global warming impact. The advantage of using renewable resources for energy production from conventional resources scarcity and power system reliability point of view is too much. Using renewable resources specially wind and solar are becoming common in developing countries for electrifying the remote and rural areas where grid electrification is economically infeasible. This research work shows an investigation that uses a combination of solar and wind energy as hybrid system (HPS) for electrical generation in Dire Dawa. The generated electricity has been utilized for different purposes. The system has also integrated a diesel generator to be more reliable. This system is not linked with conventional energy. The total energy consumption of each household is 29.44 kWh/day. Measurements included the solar radiation intensity, the ambient temperature and the wind speed was collected from national meteorology agency which was collected for 15 years. To simulate the hybrid power system (HPS) HOMER was used. Emissions and renewable energy generation fraction (RF) of total energy consumption are calculated as the main environmental indicator. The net present cost (NPC) and cost of energy (COE) are calculated for economic evaluation. It is found that, for Dire Dawa climates, the optimum results of HPS show a 93.73% reduction of emissions with 99% of renewable energy fraction.Keywords: Greenhouse Gas, Renewable Energy, Dire Dawa, Hybrid Power System, HOMER
1. Introduction
Nowadays, the mankind is living in facing energy crisis. The most optimist forecasts reveal the fact that the main classic energy resources (oil and natural gas) will be exhausted until 2050. Also, the combustion causes the greenhouse effect which will determine an apocalyptical scenario in the next (80-100) years.
In this scenario, the only solution is finding and using new energy resources, inexhaustible and clean, which will substitute in the next 50 years the current conventional
resources (fossil fuels). The growing share of renewable energy production is predictable but depends both on reducing the production costs and on finding new electrical energy storage solutions. This will ensure the injection into the power system of large quantities of renewable energy. Even more, the legislation regarding environment protection imposes the usage of this kind of energy. In March 2007, a European agreement was signed, which impose the reduction of CO2
emission with 20% until 2020 and 50% until 2050, but also using the bio fuels with a share of 10% [5].
existence will be more and more dependent upon the energy. To satisfy their energy requirement, the people attention tends to electrical energy. Electrical energy is considered as superior to all other forms due to cheapness, convenient and efficient transformation, easy to control, cleanness, greater flexibility and versatile form. It finds innumerable uses in home, industry, agriculture, transport, defense, aviation, public center, etc. Electrical energy is not only for doing desired activities but also to improve quality of life of the people [8, 19, 20].
2. Evaluation and Analysis of DDAC
Electrical Power Sector
2.1. Data Collection and Analysis
Energy demand in DDAC (Dire Dawa Administration Council) is projected to grow at a rate of 4 percent per year and is expected to reach 7.5 PJ (three times 2002 values). Sector wise growth rates are as follows: households, 3.8 percent; commercial services, 4.1 percent; industry, 7.6 percent; transport, 2.9 percent, and rural social services, 4.1 percent.
Due to a much faster growth rate for the industry sector the relative share of energy consumption by sector will change where the household sectors’ share falls slightly from 72 percent to 69 percent while that for the industry sector rises from 5 percent to 12 percent.
Fuel shares will also change slightly where the contribution from biomass falls from 70 percent to 66 percent and that for electricity increases from 8 percent to 11 percent. Petroleum fuel shares are expected to stay level at the present 22 percent. Table 1 and 2 show the energy demand of DDAC in 2015 which is projected the data found in 2002.
Table 1. DDAC Energy Demand (TJ) in 2015.
Fuel type Energy Consumption (TJ/yr)
Wood biomass 2,377.90
Crop residue 23.40
Charcoal 446.00
Kerosene 125.80
Gasoline 412.10
Diesel 214.30
Fuel oil 132.10
Electricity 391.00
Total 4,122.6
The data shown in Table 2 represents the energy demand sector-wise. The projection to the present status was based on the 2002 data survey therefore the analysis is based on secondary data.
Table 2. DDAC Energy Demand (TJ) in 2015.
Customer’s type Energy Consumption (TJ/yr)
Households 2,954.0
Commercial services 284.4
Industry 294.8
Transport 588.0
Social services and government 1.6
Total 4,122.8
The data, which are found in Table 1 and 2, show that the total energy demand of DDAC is 820,555,556.21 kWh/yr. The total population of Dire Dawa is 433,272 using 1999 E. C (2007 G. C) census. The numbers of households are 103,160 (4.2 persons per household (hh)). Therefore, the energy demand is 7,954.2 kWh/yr/hh which indicates 0.91 kWh/hr/hh or 21.8 kWh/day/hh.
2.2. Baseline Greenhouse Gas Emission Calculations
The emission factors for CO2, CH4 and N2O are based on
the IPCC 1996 Guidelines. These emission factors were established using the expert judgment of a large group of inventory experts and are still considered valid. Since not many measurements of these types of emission factors are available, the uncertainty ranges are set at plus or minus a factor of three [6, 17, 18].
Table 3 shows the default emission factors for different fuel types that are consumed in Dire Dawa. And also, Table 4 and 5 shows the baseline GHG emissions per annum in Dire Dawa. There are 3,833.03 kg/yr/hh GHG emissions in Dire Dawa in 2015.
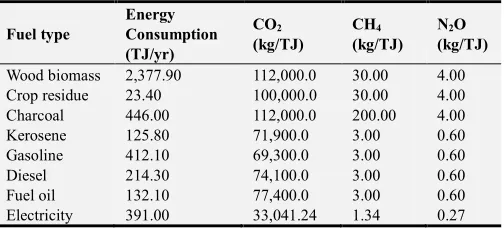
Table 3. Default Emission Factors for Different Fuel Types in Dire Dawa.
Fuel type
Energy Consumption (TJ/yr)
CO2 (kg/TJ)
CH4 (kg/TJ)
N2O (kg/TJ)
Wood biomass 2,377.90 112,000.0 30.00 4.00
Crop residue 23.40 100,000.0 30.00 4.00
Charcoal 446.00 112,000.0 200.00 4.00
Kerosene 125.80 71,900.0 3.00 0.60
Gasoline 412.10 69,300.0 3.00 0.60
Diesel 214.30 74,100.0 3.00 0.60
Fuel oil 132.10 77,400.0 3.00 0.60
Electricity 391.00 33,041.24 1.34 0.27
Table 4. The Baseline GHG Emissions per Annum in Dire Dawa.
Fuel type CO2 (kg/yr) CH4 (kg/yr) N2O (kg/yr)
Wood biomass 266,324,800.0 71,337.00 9,511.60
Crop residue 2,340,000.00 702.00 93.60
Charcoal 49,952,000.00 89,200.00 1,784.00
Kerosene 9,045,020.00 377.40 75.48
Gasoline 28,558,530.00 1,236.30 247.26
Diesel 15,879,630.00 642.90 128.58
Fuel oil 10,224,540.00 396.30 79.26
Electricity 12,919,123.44 523.04 104.61
Total 395,243,643.4 164,414.94 12,024.39
Table 5. The Baseline GHG Emission per Household per Annum.
Fuel type CO2 (kg/yr/hh) CH4 (kg/yr/hh) N2O (kg/yr/hh)
Wood biomass 2,581.67 0.692 0.092
Crop residue 22.68 0.007 0.001
Charcoal 484.21 0.865 0.017
Kerosene 87.68 0.004 0.001
Gasoline 276.83 0.012 0.002
Diesel 153.93 0.006 0.001
Fuel oil 99.11 0.004 0.001
Electricity 125.23 0.005 0.001
Total 3,831.32 1.59 0.12
is assigned a GWP of 1. For example, a GWP of 310 for N2O
indicates that a tonne of nitrous oxide is considered to cause 310 times more global warming than a tonne of carbon dioxide. The GWP for methane and nitrous oxide can be defined by the user (in the case of a “custom” analysis) or by the software (in the case of a “standard” analysis). The default values used by RETScreen; these values can be found in the Revised Intergovernmental Panel on Climate Change (IPCC) Guidelines for Greenhouse Gas Inventories, 1996 [7, 12].
The GHG emission factor will vary according to the type and quality of the fuel, and the type and size of the power plant. Emission factors are defined by the user (in the case of a “custom” analysis) or by the software (in the case of a “standard” analysis) [7, 16, 18].
The total greenhouse gas emission of Dire Dawa in 2015 is 395,243,643.44 kg/yr CO2, 164,414.94 kg/yr CH4, and
12,024.39 kg/yr N2O as shown in Table 4. Therefore, the
equivalent carbon dioxide production is 402,423,917.76 kg/yr. If we use roughly $15 (USD)/ton which equals the price of carbon credit under the European trading skim in 2011, the total credit will be 6,036,358.77 $/yr.
3. Mitigation Methods for GHG
Emissions
3.1. Introduction
The vast majority of Ethiopia’s national energy needs are derived from fuel wood, crop and animal waste and human and animal power. Only 5% comes from electricity and 95% of this is generated by hydro-power. Much of our hydro-power potential is yet to be developed. This energy mix greatly increases the country’s vulnerability to climate change. For example, our reliance on fuel wood and charcoal brings widespread land degradation, exposing bare soil to erosive rainfall and gulley erosion. As climate impacts increase, there is likely to be a higher reliance on forest products for livelihoods.
Energy generated by hydropower is also vulnerable to fluctuations in rainfall, temperature and evaporation. For example, reduced power production during drought years already takes a significant toll on the economy. In 2002/3 power supply was lost one day a week over four months because of drought. It was calculated that each day of no power saw a 10-15% reduction in GDP generation. Loss of electricity also impacts on basic services like schools and hospitals.
In this scenario, the only solution is finding and using new energy resources, inexhaustible and clean, which will substitute in the next 50 years the current conventional resources (fossil fuels). The growing share of renewable energy production is predictable but depends both on reducing the production costs and on finding new electrical energy storage solutions. This will ensure the injection into the power system of large quantities of renewable energy.
The Nationally Appropriate Mitigation Actions (NAMA) contains aspirational targets for actions across the sectors to mitigate climate change which, under commitments made within the Copenhagen Accord, should be afforded financial and technological assistance from industrialized nations.
3.2. Solar Potential of Dire Dawa
Photovoltaic (PV) is a method of generating electrical power by converting solar radiation into direct current electricity using semiconductors that exhibit the photovoltaic effect. PV power generation uses solar panels comprising a number of cells containing a semi-conducting material. As long as light is shining on the solar cell, it generates electrical power. When the light stops, the electricity stops. Many PV have been in continuous outdoor operation on Earth or space for over 30 years [4, 17].
Ethiopia is one of the developing countries without properly recorded solar radiation data and, like many other countries, what is available is sunshine duration data. However, given knowledge of the number of sunshine hours and local atmospheric conditions, sunshine duration data can be used to estimate monthly average solar radiation, with the help of empirical equation given below [1, 9, 10, 24, 25].
H=Ho(a+b n
N) (1)
Where:
1. H is the monthly average daily radiation on a horizontal surface (MJ/m2),
2. H0 is the monthly average daily extraterrestrial radiation
on a horizontal surface (MJ/m2),
3. n is the monthly average daily number of hours of bright sunshine,
4. N is the monthly average of the maximum possible daily hours of bright sunshine,
5. a and b are regression coefficients
The regression coefficients a and b can be determined as follows [2, 21, 22, 23]:
a=-0.309+0.539cos∅-0.0693h+0.29n
N
b=1.527-1.027cos∅+0.0926h-0.359n
N
World-wide (5o<Φ<54o) (2)
Where: Φ (degrees) is the latitude and h (km) is the elevation of the location above sea level.
Solar radiation, known as extraterrestrial radiation, Ho, on
horizontal plane outside the atmosphere, is given by:
H0=
24*3600*Gsc
π 1+0.033+cos(
360nd
365 )
* cos∅cosδcosωs+ πωs
Where:
1. nd is the day number,
2. Gsc is the solar constant (1367 W/m2),
3. Φ is the latitude of the location (o),
4. δ is the declination angle (o), which is given as follows. 5. δ = the declination angle given as
δ=23.45sin 360248+nd
365 (4)
ωs = is the sunset hour angle given as
ωs=cos-1(-tan∅tanδ) (5)
The maximum possible sunshine duration N is given by
N= 2
15ωs (6)
Table 6. Comparison between the Calculated Solar Radiations with NASA Data.
Month Calculated value NASA data Difference (%) H (kWh/m2/d) H (kWh/m²/d)
January 5.77 5.90 2.22
February 5.80 6.34 8.59
March 6.07 6.29 3.57
April 5.73 6.10 6.01
May 6.20 6.27 1.14
June 5.89 6.03 2.35
July 5.83 5.83 0.08
August 5.97 5.86 1.90
September 5.74 6.00 4.34
October 5.79 6.06 4.40
November 5.76 6.07 5.12
December 5.58 5.80 3.87
3.3. Wind Potential of Dire Dawa
Using power law the wind speed at a certain height above ground level can be given as follows [3, 11, 13]:
V2=V1 h2
h1
α
(7)
Where: V1 is the wind speed measured at the reference
height h1 (m/s), V2 is wind speed estimated at height h2 (m/s),
and α is ground surface friction coefficient.
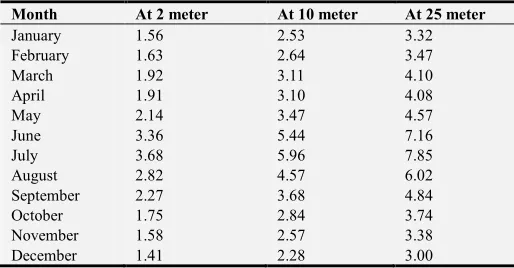
Table 7 shows the average wind speed (m/s) in Dire Dawa at different heights that are calculated using equation 7.
Table 7. Average Wind Speed (m/s) in Dire Dawa at Different Height.
Month At 2 meter At 10 meter At 25 meter
January 1.56 2.53 3.32
February 1.63 2.64 3.47
March 1.92 3.11 4.10
April 1.91 3.10 4.08
May 2.14 3.47 4.57
June 3.36 5.44 7.16
July 3.68 5.96 7.85
August 2.82 4.57 6.02
September 2.27 3.68 4.84
October 1.75 2.84 3.74
November 1.58 2.57 3.38
December 1.41 2.28 3.00
3.4. Short Term Mitigation Options
3.4.1. Energy Saving House Appliance
Energy efficient lamp can save more than 2MW of power. This assumed the total population of Dire Dawa by 2020 is forecasted based on 2007 censuses 509,281 and the number of household will be 127,320 out of it let’s assumed 70% of the house use energy saving lamp which can save 20W in each household then total energy which will be saved by this will be 2MW.
Using energy efficient Injera stove (2.5kW), the energy electric baking stoves in the existing market require 3.5kW of power per stove and high energy inefficient. Newer design such as those based on magnetic induction technology, claimed by the designer to use only 1.2kW-2.5kW for same quality and quantity Injera baking. Therefore we can save in average 2kW per Injera stove.
3.4.2. Using Biogas as Energy Sources
Biogas plants also help reduce greenhouse gas (GHG) emissions. Since carbon emission riding is not practiced in a household level here in Ethiopia, the environmental benefits from biogas is considered an economic benefit and not financial. Biogas helps reduce greenhouse gas emissions by displacing the consumption of fuel wood, dung cake and kerosene. The biogas is assumed to be produced on a sustainable basis, and therefore the CO2 associated with
biogas combustion is reabsorbed in the process of the growth of the fodder and foodstuffs by the bio-slurry as fertilizer from the biogas plant. In the case of fuel wood, if it is consumed on a non-sustainable basis, then all the CO2, CH4and N2O
emissions that are associated with the combustion of fuel wood can be accounted as being displaced when replaced by a biogas plant. In our study, the total annual fuel wood, dung cake and kerosene saved is estimated to be 2154 kg, 1825 kg and 47 liters per household respectively.
According to the Intergovernmental Panel on Climate Change (IPCC) Guidelines for National Greenhouse Gas Inventories (IPCC, 1996), the emission coefficient for a ton of non-sustainable fuel wood is approximately 1.5 tons CO2 and
approximately 2.5 tons CO2 per 1000 liters of kerosene
combusted. Hence, installing this biogas plant would result in a net reduction of approximately 6.1 tons of CO2 equivalent
annually per household.
The global environmental value of GHG emissions reduction by a biogas plant is calculated as the product of the total reduction in emissions and the market price of carbon reduction. A biogas plant is expected to continue reducing GHG emissions for its entire expected lifespan of 20 years. If we use roughly $15 (USD)/ton which equals the price of carbon credit under the European trading skim in 2011. Hence, the total emission reduction from a single biogas plant is valued to 3000 Ethiopian Birr (ETB) annually.
which has a financial value of 1703 ETB fertilizer benefit. The annual financial health benefits due to clean energy and improved sanitation of the biogas plant was aggregated to 674 ETB at the household level. In this study, the annual fuel wood, dung cake and kerosene saved was estimated to be 2154 kg, 1825 kg, and 47.43 liters respectively for the household. These savings can reduce 6.1 tons of CO2 emission and could save
0.36 ha of forest land that would have a total equivalent amount of 2795 ETB from carbon reduction.
3.4.3. Standalone PV System for Rural Electrification Based on the house annual electric demand the standalone PV system is selected and designed. The general over view of solar PV cell are started from demands of one house hold.
3.5. Long Term Mitigation Options Resources
The term resource applies to anything coming from outside the system that is used by the system to generate electric or thermal power. That includes the four renewable resources (solar, wind, hydro, and biomass) as well as any fuel used by the components of the system.
Renewable resources depend extremely on location. The solar resource depends strongly on latitude and climate, the wind resource on large-scale atmospheric circulation patterns and geographic influences, the hydro resource on local rainfall patterns and topography, and the biomass resource on local biological productivity. Moreover, at any one location a renewable resource may exhibit strong seasonal and hour-to-hour variability [15].
The nature of the available renewable resources affects the behavior and economics of renewable power systems, since the resource determines the quantity and the timing of renewable power production. The careful modeling of the
renewable resources is therefore an essential element of system modeling [14, 16].
4. Result and Discussion
This research work contains the results of recent greenhouse gas (GHG) emission life-cycle analyses. Specific attention is paid to fossil energy technologies and renewable energy technologies (RETs). It is therefore desirable for GHG emissions under national, regional and international mitigation policies to be accounted for over its entire life-cycle. The results presented here indicate that the most significant GHG avoidance (in absolute terms) can be made from technology substitution. The introduction of advanced fossil fuel technologies can also lead to improvements in life-cycle GHG emissions. Overall solar and wind energy technologies can produce electricity with the least life-cycle global warming impact. Therefore, according to this research result, the projection of GHG emissions will be 484,168.51 tones (CO2 equivalent) by 2025. The amount of GHG
emissions can be reduced by applying recommended options. Based on this research results, using short term mechanisms, for instance using biogas as energy source, it is possible to reduce GHG emissions by 6.1 tones CO2 per household per
year. And also, using energy efficient traditional stoves, the emissions can be reduced by 1.06 tones CO2 per household per
year. The long term mitigations can be using renewable energies and smart grid implantation. The solar and wind hybrid system can reduced the GHG emissions by 176,720.44 tones CO2 per year. Smart grid can also used for improving
energy saving and grid reliability. The summary of this research work results is found in Table 8.
Table 8. Summary of the Results.
2025 GHG Emission Projected in Tonne (CO2 Equivalent)
Amount Of GHG Emission Reduced by Applying Recommended Options
Short Term Mitigation Mechanisms Long Term Mitigation Mechanisms
484, 168.51 1. From biogas: 6.1 ton CO2/hh/yr 1. Renewable energies: 176, 720.44 ton CO2/yr
2. Energy Efficient traditional stove: 1.06 ton CO2/hh/yr 2. Smart grid for energy saving and grid reliability.
5. Conclusion
This research shows an investigation that uses a combination of solar and wind energy as hybrid system (HPS) for electrical generation in Dire Dawa. The generated electricity has been utilized for different purposes. The system has also integrated a diesel generator to be more reliable. This system is not linked with conventional energy. The total energy consumption of each household is 29.44 kWh/day. Measurements included the solar radiation intensity, the ambient temperature and the wind speed was collected from national meteorology agency which is collected for 15 years. To simulate the hybrid power system (HPS) HOMER was used. Emissions and renewable energy generation fraction (RF) of total energy consumption are calculated as the main environmental indicator. The net present cost (NPC) and cost of energy (COE) are calculated for economic evaluation. It is
found that, for Dire Dawa climates, the optimum results of HPS show a 93.73% reduction of emissions with 99% of renewable energy fraction.
In general, renewable energy-based mini-grid systems can play a vital role in bringing sustainable energy to the communities in Dire Dawa. In this work, an optimization and sensitivity analysis of a solar PV/wind/diesel hybrid mini-grid system in Dire Dawa has been presented. This study indicates that for the chosen location, the most feasible system consists of a 10-kW PV, 5-kW wind turbine and battery storage if no capacity shortage is demanded. Allowing for 10% capacity shortage, a fully renewable energy-based system becomes feasible.
References
[2] Gopinathan KK. A general formula for computing the coefficients of the correction connecting global solar-radiation to sunshine duration, Solar Energy 1988; 41 (6):499–502. [3] Patel, M. R., Wind and Solar Power Systems: Design, Analysis,
and Operation. 2nd Ed. Boca Raton: Taylor & Francis Group, 2006.
[4] Luque, A. and Hegedus, S., Handbook of Photovoltaic Science and Engineering. West Sussex, England: John Wiley & Sons Ltd, 2003.
[5] The Energy Access Situation in Developing Countries, UNDP, 2008.
[6] Darío R. Gómez, John D. Watterson, Branca B. Americano, Chia Ha, Gregg Marland, Emmanuel Matsika, LemmyNengeNamayanga, Balgis Osman-Elasha, John D. KalengaSaka, and Karen Treanton, IPCC Guidelines for National Greenhouse Gas Inventories, vol. 2, 2006.
[7] Minister of Natural Resources Canada, Clean Energy Project Analysis, RETScreen Engineering & Cases Textbook, 3rd Ed., 2005.
[8] GirmawTeshager, Optimal Power Generation Expansion Planning for Ethiopian Electric Power System, AAiT, July 2011.
[9] G. Lefebvre, Environment, Energy and Climate Change II: Energies from New Resources and the Climate Change, Hdb Env Chem (2016) 34: 1–14.
[10] Jo Dewulf, Steven De Meester, and Rodrigo A. F. Alvarenga, Sustainability Assessment of Renewables-Based Products: Methods and Case Studies, First Edition, John Wiley & Sons, Ltd, 2016.
[11] K. Gaiser, P. Erickson, An experimental investigation of design parameters for pico-hydro Turgo turbines using a response surface methodology, Renewable Energy 85 406-418, 2016. [12] Bhushan D. Agarkar and Shivprakash B. Barve, A Review on
Hybrid solar/wind/ hydro power generation system, International Journal of Current Engineering and Technology, India, P: 188-191, 2016.
[13] Abdel Ghani Aissaoui and Ahmed Tahour, Wind Turbines Design, Control and Applications, ExLi4EvA, 2016.
[14] Res Novae, Smart Cities Communities and Social Innovation, University and Research Italian Ministry, available at: http://resnovae-unical.eu/, 2016.
[15] Rahimi F., Ipakchi A., Fred Fletcher F., The changing electrical landscape: end-to-end power system operation under the transactive energy paradigm, IEEE Power and Energy Magazine, vol. 14, no. 3, pp. 52–62, 2016.
[16] Kristov L., De Martini P., Taft J. D., “A tale of two visions: designing a decentralized transactive electric system”, IEEE Power and Energy Magazine, vol. 14, no. 3, pp. 63–69, 2016. [17] Forfia D., Knight M., Melton R., The view from the top of the
mountain: building a community of practice with the GridWise Transactive Energy Framework, IEEE Power and Energy Magazine, vol. 14, no. 3, pp. 25–33, 2016.
[18] Stergiopoulos G., Kotzanikolaou P., Theocharidou M., Time-based critical infrastructure dependency analysis for large-scale and cross-sectoral failures, International Journal of Infrastructure Protection, vol. 12, pp 46–60, 2016.
[19] Ferrante P., La Gennusa M., Peri G., On the architectural and energy classification of existing buildings: a case study of a district in the city of Palermo”, IEEE 16th International Conference on Environment and Electrical Engineering (EEEIC), June 2016.
[20] Wenping Cao and Yihua Hu, Renewable Energy Utilisation and System Integration, ExLi4EvA, 2016.
[21] M. Godoy Si And Mões Felix A. Farret, Modeling Power electronics and interfacing energy conversion systems, John Wiley & Sons, Inc., Hoboken, New Jersey, 2017.
[22] Colin H. Hansen, Wind Farm Noise: Measurement, Assessment and Control, John Wiley & Sons Ltd, Te Atrium, Southern Gate, United Kingdom, 2017.
[23] Mikias Hailu Kebede, “Design of Standalone PV System for a Typical Modern Average Home in Shewa Robit Town-Ethiopia.” American Journal of Electrical and Electronic Engineering, vol. 6, no. 2 (2018): 72-76. doi: 10.12691/ajeee-6-2-4.
[24] MH Kebede, P Mukilan, GB Beyene, 2017, Dynamic Modeling and Optimization of Self-Sustaining Solar-Wind Hybrid Street Lighting System: The Case Study of Addis Ababa City,
Journal of Advanced Research in Dynamical and Control Systems, Volume 9, 17-Special Issue.