http://www.sciencepublishinggroup.com/j/larp doi: 10.11648/j.larp.20170204.13
Sustainable Urban Freight Distribution: The Case of
Piraeus Port-City
Afroditi Anagnostopoulou
1, *, Maria Poulou
21
Hellenic Institute of Transport, Centre for Research and Technology Hellas, Athens, Greece
2
Programming & Development Division / Municipality of Piraeus, Piraeus, Greece
Email address:
a.anagnostopoulou@certh.gr (A. Anagnostopoulou), mpoulou@pireasnet.gr (M. Poulou)
*
Corresponding author
To cite this article:
Afroditi Anagnostopoulou, Maria Poulou. Sustainable Urban Freight Distribution: The Case of Piraeus Port-City. Landscape Architecture and Regional Planning. Vol. 2, No. 4, 2017, pp. 110-116. doi: 10.11648/j.larp.20170204.13
Received: October 30, 2017; Accepted: November 14, 2017; Published: December 20, 2017
Abstract:
In port cities, there are often severe transport and urban freight mobility issues associated with the port operations since ports and their surrounding urban areas are struggling with the ever-increasing flow of trucks, accommodating both through and intra-city cargo movement. This paper aims to present how urban freight distribution measures can support the goals of sustainable development even in cities with limited previous experience in energy efficiency and environmental friendly solutions. The successful case of the Piraeus port-city is presented and findings derived from a survey about urban delivery in the city center are provided. The study describes how efforts from different stakeholders should be coordinated to support urban freight distribution in the context of an action plan that promotes sustainable development in the city. Results from Piraeus case are useful for other comparable port-cities in Europe experiencing a rapid growth in passengers and freight volumes required to be handled, imposing significant negative externalities to the urban area.Keywords:
Urban Freight Distribution, Sustainable Development, Port-City1. Introduction
In the complex environment of port-cities, urban settlements increase in size and density of their activities. As a result, the need for freight mobility and distribution of goods through the urban transportation and logistics system increases. Considering the urban dimension of “port-cities”, public authorities aim to improve freight distribution operations and promote reduced energy consumption and the associated greenhouse gas (GHG) emissions in a short and long term horizon implementing innovative solutions that minimize the total freight movements and enhance efficiency. This addresses the Europe 2020 target about reducing energy sustainability GHG emissions 20% lower than 1990 and increasing 20% in energy efficiency [1].
To improve efficiencies, reduce externalities and promote a better image of urban freight transport, several initiatives are undertaken. These initiatives relate to policy and regulation that may be infrastructure, facility, time, or vehicle related and may be achieved through restrictions (or their removal), pricing policies, exchange of information between
public administration and those effecting the transport service, provision of services, or incentives. They may also relate to infrastructure development, vehicle technology, new and alternative energy sources, use of information and communication technologies, or development and adoption of new efficient business practices.
Capitalization on the success of previous public and private sector efforts assist local and regional authorities in developing proper strategies and policies to facilitate the implementation of actions that improve the energy efficiency of urban freight distribution. The measures for efficient urban logistics on each city stems from its unique character in terms of issues, advantages and opportunities. Energy efficiency measures provide a common ground for dialogue between private and public sector. They are translated into both operational and environmental savings that meet both private sector profit maximization and public sector social benefit objectives.
fragmented previous efforts in energy efficiency and environmental protection. The study describes the successful case of the Piraeus port-city and how previous experience is further exploited in order to develop an action plan for urban freight distribution that gained acceptance also from the industry stakeholders. It presents the critical steps of decision-making and how different stakeholders interact to determine priorities for the sustainable development of the area.
2. Previous Experiences in Urban Freight
Distribution for Port-Cities
Urban freight transport plays a key role towards the economic vitality of the cities. Goods transport and delivery are fundamental elements of economic activity that is increasingly dependent on the regional business network producing increased pollutant emissions and GHG effects. Freight transport operations are mostly private, which means that are rather effective from an internal cost point of view, but not necessarily concerned with the external costs that they often generate in urban areas such that increased traffic and negative environmental impacts. City authorities share a common interest to improve the quality of life for people and seek for the suitable policies that gradually decrease energy consumption and affect positively the economic, environmental and social conditions.
Significant research effort appeared in urban freight distribution supporting decision making and urban planning by analyzing the impact of implemented measures and policies in terms of both operational and environmental aspects [2, 3, 4]. Evaluation methods and frameworks are proposed assessing the impact of different measures supporting decision making of public authorities regarding urban freight transportation planning. Measures for efficient urban freight distribution require both technological innovation tools and social strategies respecting the cultural heritage and being used by residents of different socio-economic groups.
In the urban environment, typically arriving from the producer location to major facilities in the urban areas, goods are distributed to the local consumers usually not in an optimized way. The high frequency and delivery time requirements, the weight of freights and the large number of shipments characterizing these deliveries indicate a significant potential for increased energy consumption and CO2 emissions in urban freight transport. For the
aforementioned reasons, emphasis is given on urban freight consolidation centers, considering also extra measures for achieving a more efficient last mile delivery [5, 6]. The concept is to reduce the volume of commercial vehicles in the city center by maximizing the load of each vehicle and also promoting green vehicles for urban freight distribution. As such, a high level of concentrated business activity is allowed without negative externalities to residents. During the last years, the tendency is towards hybrid urban
consolidation centers where terminals associated with another existing facility or with another specific need of the area (such as port terminals) replace the traditional urban consolidation centers.
More recently, innovative operational sustainable low carbon solutions for city-port connections and interactions are promoted strengthening the knowledge and capacities of local authorities [7, 8]. They focus on energy efficient measures and policies with the aim to develop sustainable plans covering supply chain priorities in the context of sustainable urban planning. The planned urban freight distribution measures should determine the nature of the relations between port activities and urban freight observing the importance of the port in economic activities and the importance of the city in port operation activities achieving broader acceptance and being fitted properly within a broader planning framework [9].
3. Description of the Piraeus Port-City
The city of Piraeus is within the broader Attica area, where almost 45% of Greece’s population is concentrated. Piraeus has a population of 163,688 people and it is home to Greece’s main port, which is the 8th European container port handling 3.1 million TEUs in 2013, the 3rd cruise port in the Mediterranean with more than 2 million cruise visitors and the main Eastern European car port with around half a million cars handled in 2013 [10]. Piraeus is a densely populated city with high port related business and tourist activity, the latter of which is expected to be further increased considering the interest of the port of Piraeus in investing on infrastructure developments that will facilitate the growth of the cruise market. Commercial units which are clustered in city centre faced an increased demand of being supplied with products efficiently, at a low cost and in a timely manner. Hence, significant inconsistencies are appeared in transport sector and the daily traffic congestion constitutes a major problem in the area. The urban freight logistics in the Piraeus city centre is characterized by a large number of deliveries in small roads, with frequent trips, resulting in many vehicle kilometers travelled. Limited capacity, lack of coordination and extended peak hours of operation result in increased congestion, delays, energy consumption and other environmental impacts such as noise and air pollution.
Figure 1. Main pillars of urban freight distribution.
to improve the freight distribution of the Piraeus area since there is limited previous experience and local public authorities plan the urban freight delivery system for the first time. The strategic vision of the Municipality of Piraeus is to build a “smart city” offering high quality of life and interoperability. In terms of urban freight distribution, there are three main pillars (Figure 1) i.e. (i) environment, (ii) society, and (iii) economy.
More specifically, the city of Piraeus aims to reduce the generated pollutant emissions improving the environmental conditions of the area. Road safety enhancement, improvement of pedestrian networks in urban areas and increased usage of sustainable transport means, constitute also main objectives for the public authorities. Additionally, the Municipality of Piraeus attempts to support the territorial sustainability of the area and enhance the environmental consciousness of the citizens ensuring also future
development and viability. In an attempt to achieve the aforementioned goals, public authorities focused on smart and innovative energy efficient solutions for urban logistics that allow reductions of related disturbances such as distribution travel times, noise levels and CO2 emissions.
The vision for a “smart city” triggered significant improvements and changes and major transport modifications have been undertaken in the city of Piraeus including the construction of a new METRO line and a new TRAM line that expected to reduce the volume of vehicles more than 20%. Most of the central roads have been transformed from two to one way direction and several new bus lanes formed to the road network of the city as depicted in Figure 2. A GIS system installed which can be used for traffic management in the future by public authorities and new waste collection equipment purchased including a fleet of GPS vehicles.
Figure 2. Road transformations.
4. Survey About Urban Freight
Distribution
A survey conducted to collect the necessary data for analyzing the urban freight distribution in the Piraeus city center. The aim of this survey is to improve the knowledge on freight distribution activities in the Piraeus city and allowing an impact analysis of different city logistics measures related to logistics flows. Online questionnaires were used and 139 personal interviews with commercial units and 29 with carriers were conducted. A database presenting the geographical depiction of the commercial units was built and the freight movements were studied using the CITYGOODS model developed within the SUGAR research project [11].
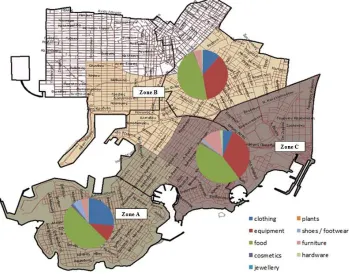
During the modelling phase of the area, the city of Piraeus divided into three main zones as presented in the Figure 3
according to the points of interest. Thoroughly, Zone A includes a part of the central market of the Piraeus city and the facilities / commercial units (i.e. cafes, restaurants) by the sea. Zone B includes the central market of the Piraeus city and port related business activity, and last Zone C includes the busy area close to the University of Piraeus. Finally, Zone D includes the area outside of the Municipality limits. The NACE code used to classify the commercial units of the area (Figure 4) and the selected supply chains were classified to 9 main categories i.e. clothing, equipment, food, cosmetics, jewelry, plants, footwear/Shoes, furniture and hardware.
higher (more than 70%) including also companies that collaborate with up to 1 carrier. The CITYGOODS model generated the urban freight distribution movements (loading/unloading operations) in the city of Piraeus presenting the correlation among movements, the economic activities and the zones of the Piraeus urban area (Figure 3).
Each supply chain modelled and implicitly defined for one or more type of goods in a yearly time horizon. Results present that supply chains of food, clothing and equipment estimated to appear the higher percentages of the total number of urban freight movements per year. In particular,
48.1% of the total urban freight movements per year in the Piraeus city are due to food commercial units. The total number of flows for clothing supply chain also presents a high percentage (27.6%) of urban freight movements and the equipment supply chain presents the third high percentage up to 13.7%. Zones A and B are similar to this general tendency while zone C slightly differs since logistics for furniture economic activities presents the third higher percentage. In general, Zone B appears the highest volume (55.1%) of urban freight distribution operations compared with the Zone A (26.1%) and Zone C (18.8%).
Figure 3. Loading/unloading operations estimated for each supply chain / zone.
Figure 4. Total number of local units for each economic sector (NACE code) in the study area.
Based on the data provided by the carriers participated in this study, diesel light goods vehicles (LGV) used for urban freight deliveries in the Piraeus city and the total distance
10l/km to a high of 15l/km according to the European Commission report [12]. As such, the corresponding carbon footprint and energy consumption are presented in Table 1 in an attempt to evaluate the energy and environmental impacts of urban freight distribution. Regarding the corresponding CO2 emissions, an average speed of around 25km/h is
considered and they are calculated according to the COPERT software that defines the CO2 emissions produced per LGV
travelling a distance of 1km is about 280gr. Given the estimated total distance travelled by the vehicles for the urban distribution services, abstract values for the generated CO2 emissions are calculated and illustrated in Table 1.
Table 1. Total distance travelled, total fuel consumption and CO2 emissions for each supply chain / year.
Supply Chain Total Distance Travelled (km) Total Fuel Consumption (kL) Total CO2 Emissions (ton)
Min Max
clothing 177556.48 17.76 26.63 49.72
equipment 186775.13 18.68 28.02 52.30
food 296843.00 29.68 44.53 83.12
cosmetics 4799.82 0.48 0.72 1.34
jewelry 1159.53 0.12 0.17 0.32
plants 2597.57 0.26 0.39 0.73
shoes / footwear 9486.51 0.95 1.42 2.66
furniture 214574.88 21.46 32.19 60.08
hardware 18590.12 1.86 2.79 5.21
5. Critical Issues for Sustainable
Development of Urban Freight
Distribution
Preparing an energy-efficient action plan for the sensitive sector of the urban logistics is a challenging procedure and a series of processes should be coordinated. Determining the “best set of measures and policies” for a city depends on multiple criteria such as the cost effectiveness, energy savings, GHG emission reductions and the required time for
implementation. The Municipality analyzed specific energy-efficient measures by indicating their potential impact through surveys, simulations and studies. Energy efficiency measures provide a common ground for dialogue between private and public sector. They are translated into both operational and environmental savings that meet both private sector profit maximization and public sector social benefit objectives. An action plan for sustainable development of freight transport was endorsed in the strategic plan of the area, highlighting the activities that should be taken ensuring a broad energy effect on the urban environment.
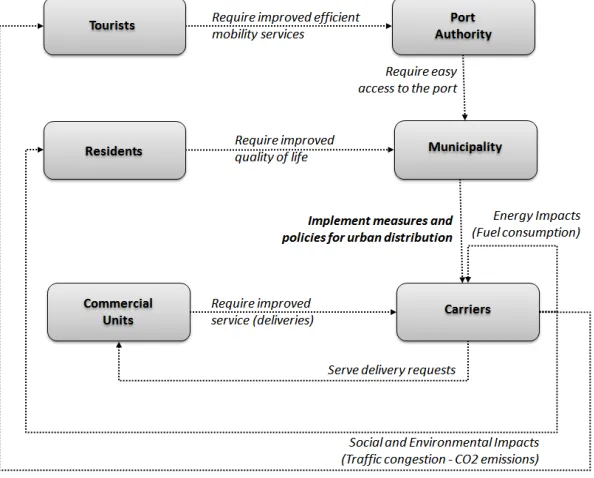
Figure 5. Interactions among relevant stakeholders.
Within the preparation stage, prospective priorities have reviewed and evaluated to determine the commitment of the relevant stakeholders in a systematic way in order to achieve synergies among local authorities and the private sector. The
mitigating air pollution and severe traffic congestion, ii) the Piraeus Port Authority that aims to offer easy access to the port area and high quality of service to tourists, iii) the commercial units that require improved service from carriers and aim to increase their profit increasing their sales and reducing their total costs providing high quality customer service, iv) carriers that aim to increase profit and minimize their operational costs providing high level of service to their customers (commercial units), v) residents who require improved quality of life, and vi) tourists who require efficient mobility services. The interactions among relevant stakeholders are provided in the Figure 5.
The survey described in Section 3 provides qualitative indicators that cover operational (i.e. the total distance travelled by the commercial vehicles), energy (i.e. the total travelled time and the energy consumption by the commercial vehicles) and environmental aspects (i.e. CO2
emissions generated due to urban freight distribution). The energy indicators support the dialogue among key stakeholders with the aim to determine the priorities of the area. Table 2 describes preparation tasks and illustrates the defined priorities at operational, energy, environmental and social level for the Piraeus city.
Table 2. Preparation Tasks and Priorities.
Preparation Tasks Priorities
Operational Level Energy Level Environmental & Social Level
Continuous dialogue with stakeholders Reduction of distribution cost Energy efficiency improvement Reduction of pollutant emissions
Geographic analysis Reduction of travel time Reduction of fuel consumption Improvement of environmental conditions
Policies and regulations analysis Reduction of traffic congestion Improvement of road safety
Inefficiencies observation Improvement of life quality
SUMP guidelines (n/a) Promotion of territorial sustainability
Legislation framework Increase of environmental consciousness
Increase of pedestrian areas
Capitalizing upon previous experience, a successful framework for measures and policies implementation should be based on the following interconnected and iterative building blocks: i) cooperation among different stakeholders, ii) data sharing among stakeholders, iii) measures and policies implemented in the area (previous and current), iv) key performance indicators of implemented measures and policies, and v) results of studies and surveys providing relevant information about the conditions of the city.
The output from a building block may be required as input for another (Figure 6). The block of cooperation among stakeholders feeds all blocks and key performance indicators have to be defined to support the results of studies and
surveys that will be used to provide detailed information of the area regarding freight transport and also to evaluate the applied and/or simulated measures and policies. Determining common priorities of different stakeholders in an area set the basis for defining the key performance indicators that allow monitoring and assessing the impact of the implemented measures and policies. On the other hand, measures and policies could be revised properly based on the results derived from the KPIs and in case that priorities change. Data sharing among different stakeholders enable consistent and coherent information for evaluating implemented measures and policies as well as conducted the necessary studies and surveys.
Figure 6. Framework of Coordinated Effort of an Action Plan for Urban Freight Distribution.
6. Conclusions
The sustainable development of freight distribution is
implemented in the case of Piraeus port-city in an attempt to contribute to the planning of urban freight delivery and more specifically to the decision making of public authorities. The proposed framework for coordinated efforts constitutes the basis of a successful action plan that aims to assist decision makers with the implementation of efficient measures and policies for urban freight distribution. Substantial cooperation among stakeholders is important to achieve sustainable development in port-cities incorporating research initiatives and technological developments.
Results from Piraeus case show that operational (economic), energy and environmental costs are strongly connected and a sustainable urban distribution can be followed if the environmental and social objectives could be also conceived as energy and economic objectives for industry stakeholders. Moreover, the vision of the city should also consider the vision of the port and the carriers’ operational goals. On the other hand, the role of research supports decision makers to undertake events effectively by maintaining an evaluation process to assess current measures and policies and propose alternative solutions to implement that cover pre-defined priorities. To this end, monitoring and data sharing are crucial to examine the performance of urban freight distribution activities as a system for the port-city area.
Acknowledgements
This research has been implemented in the context of the research project “SMILE – Smart green Innovative urban Logistics for Energy efficient Mediterranean cities” through the program “STC (Secrétariat Technique Conjoint) Programme MED (Méditerranéen), Priority – Objective 2-2”. The authors should like to acknowledge Prof. Maria Boile for her support within the SMILE project implementation and her overall contribution.
References
[1] Europe 2020 strategy, Available at:
http://ec.europa.eu/eurostat/web/europe-2020-indicators/europe-2020-strategy
[2] E. Taniguchi, and D. Tamagawa, “Evaluating city logistics measures considering the behavior of several stakeholders”,
Journal of the Eastern Asia Society for Transportation Studies, 2005, vol. 6, pp. 3062-3076.
[3] T. G. Crainic, “City logistics”, in: State-of-the-Art Decision-Making Tools in the Information-Intensive Age. INFORMS, 2008, pp. 181-212.
[4] Y. Imanishi, and E. Taniguchi, “Framework of the urban road freight transport – Lessons learnt from case studies”, Transportation Research Procedia, 2016, vol. 12, pp. 627-633.
[5] J. Allen, G. Thorne and M. Browne, “Good Practice Guide on Urban Freight”, Bestufs, Rijswijk, Pays-Bas, 2007.
[6] M. Boile, S. Theofanis and A. Strauss-Wieder, “Feasibility of Freight Villages in the NYMTC Region”, 2008, Task 3 Report.
http://www.nymtc.org/project/freight_planning/freight_village .html
[7] SMILE, “SMart green Innovative urban Logistics for Energy Efficient Mediterranean cities”, 2015, European Union, MED Programme, available
at:http://www.programmemed.eu/en/the-projects/project-database/results/view/single.html?no_cache=1&idProject=73 &cHash=fa09549f574ae5b389e27cf32e0fe36b.
[8] BESTUFS, “BESTUFS Policy and Research
Recommendations III”, 2007, Port cities and innovative urban freight solutions. Managing urban freight transport by companies and local authorities. European Commission, 6th Framework Programme for Research and Technological Demonstration, available at:
http://www.bestufs.net/bestufs2_policy.html
[9] A. Anagnostopoulou, E. Sdoukopoulos and M. Boile, “Sustainable urban logistics for efficient and environmentally friendly port-cities” in Soares, C. G., and Teixeira, A. P. (Eds) Developments in Maritime Transportation and Harvesting of Sea Resources (2-Volume set): IMAM 2017, CRC Press - Taylor & Francis Group, 2017, vol. 1, pp. 625–632.
[10] OECD - Regional Development Policy Division, “Urban Trends and Governance”, 2014, Case Study of Athens – Attica, Greece.
[11] SUGAR, Sustainable Urban Goods Logistics Achieved by Re-gional and Local Policies, “City Logistics Best Prac-tices: a Handbook for Authorities”, 2012, European Union, IN-TERREG IVC programme, Available at: http://www.cei.int/SUGAR.