http://www.sciencepublishinggroup.com/j/ajme doi: 10.11648/j.ajme.20170304.13
Combining Wind and Solar Energy to Meet Demands in
Somali Region of Ethiopia (A Case of Dembel District)
Natei Ermias Benti
College of Natural and Computational Sciences, Center for Environmental Science, Addis Ababa University, Addis Ababa, Ethiopia
Email address:
natei.ermias@aau.edu.et
To cite this article:
Natei Ermias Benti. Combining Wind and Solar Energy to Meet Demands in Somali Region of Ethiopia (A Case of Dembel District).
American Journal of Modern Energy. Vol. 3, No. 4, 2017, pp. 73-83. doi: 10.11648/j.ajme.20170304.13 Received: May 13, 2017; Accepted: May 31, 2017; Published: July 25, 2017
Abstract:
Shortage of electric power is a serious problem in Ethiopia. The population living in urban and semi urban areas connected to the national grid makes only less than 20% of the total. The remaining 80% of the population in scattered rural villages and have very remote chance to get electricity from the grid. The only realistic approach to electrify the rural areas seems therefore to be the off grid system. Study was conducted to assess suitability of stand-alone wind-solar PV hybrid power for Debmel village which is detached off the main grid line. The data required for this work (wind speed and sunshine hours) were obtained from the National Meteorological Agency (NMA) and analyzed using HOMER & MATLAB software’s. The actual data used was from Dire-Dawa station, which is the closest meteorological station to the village. Both wind power and solar PV power potentials were evaluated from wind speed and sunshine hours of the station, respectively. The electrical load for a model community is considered and a community school together with a health post is included. For the feasibility study of the hybrid system HOMOR is used. By running the software the optimization results have been generated and arranged according to their least net present cost. Furthermore, a sensitivity analysis also carried out for the major sensitivity components of the hybrid system (like PV price, hub height and diesel price). The study revealed that the area has abundant solar energy potential (6.12 KWh/m2/day) but its wind potential is not as promising. This is partly attributed to the level at which wind speed measurement was taken, 2 m, instead of the recommended 10 m height. The result of the software shows that the most cost effective system, i.e. the system with the lowest net present cost, is the PV-generator-battery-converter set-up. For this set-up, the total net present cost (NPC) is $ 155,875, the cost of energy (COE) is 0.415$/kWh, contribution from renewable resources is 91%.Keywords:
Solar PV, Sunshine Hours, Wind Power, Wind-Solar PV Hybrid Power, Wind Speed1. Introduction
In developing countries and less developed countries, a significant proportion of the population lives without usable electrical power. Ethiopia is one of developing countries with more than 80% of its population live without usable electricity [1, 2]. The development of many rural communities has been limitation due to the lack of usable electricity. The more noticeable benefits of usable electric power include: improved health care, improved education, better transportation systems, improved communication systems, a higher standard of living, and economic stability. Unfortunately, many of the rural areas of Ethiopia have not benefited from these uses of electricity. Due to the remote location and the low population densities of the rural
communities the traditional means of providing power has proven too expensive, undependable, difficult to maintain, and economically unjustifiable. Consequently, many of these communities remain without electricity and may never receive grid power from the utility [3]. Ethiopia has huge utilizable solar and wind energy potentials convenient for rural electrification [1, 4–6]. It is conceivable that a hybrid system has the advantage of improved reliability and therefore gives better energy service when compared to any particular (wind, solar, etc.) type of stand-alone supply system.
the north by Ayesha, and on the east and south by the Jijiga Zone. Towns in Dembel include Arebi, Biyo Behay, Dembel, Dure, Harmukale, and Smekeb. According to 2004 World Bank memorandum, none of the inhabitants of Dembel have access to electricity.
The remote location and the small size of these towns made it impractical to electrify with grid power system. The community with health clinic and School requires electricity for lighting, refrigeration, medical tools, communication equipment, and etc.
A hybrid solar PV-wind power generation system is proposed to supply electricity to Dembel community to power clinic and school. The Hybrid Renewable Power Generation System (HRPGS) is a system aimed at the production and utilization of the electrical energy coming from more than one source, provided that at least one of them is renewable [7]. Such a system often includes some kind of storage in order to satisfy the demand during the periods in which the renewable sources are not available and to decrease the time shift between the peak load and the maximum power produced and power conditioning unit and controller to convert and control one form of energy to other [3, 8].
The aim of this paper is to study solar PV- wind energy system for electrification of rural area of Somali region which not electrified via national grid system. The people in this village use kerosene for lamp, diesel for water pumping and grinding machines, fire wood for cooking and dry cells for radio and tape recorders. Desertification of the land is getting worse and worse due to deforestation and backward agriculture. Thus, in this work a hybrid renewable power generation system integrating these vast solar and wind
resources were designed and modeled, to electrify the small town of Dembel and surrounding communities.
2. Materials and Methods
A Hybrid study of solar PV and wind power system which comprises of PV arrays and wind turbine with battery banks and power conditioning units and diesel generator has been discussed. Before the study was conducted to design hybrid energy systems of solar PV and wind power system for Shinile Zone of the Ethiopian Somali Regional State, energy consumption, solar energy potentials and wind energy potentials of the area under study had been studied.
2.1. Energy Demand
A typical load system for community which lives in Dembel village (Model 100 households) has been considered. As one of the compulsory services for a community, a small clinic a Rural Health Clinic (RHC) is provided. The purpose of the RHC program is improving access to primary care in underserved rural areas. RHCs are required to provide outpatient primary care services and basic laboratory services such as blood sugar, urine and pregnancy test. One of the major time consuming tasks of rural women is grinding. She has to travel across several miles to the city in search of grinding machines. In solution to this problem, a grinding machine has to be provided and the energy system must be capable of satisfying the demand. In quantifying the school load light bulbs for night school has been assumed. The energy demand of the community is summarized in Table 1.
Table 1. Electricity load.
Energy Demands Appliance Watt (W) Total Number Total Power (KW) Daily use/hour Daily Energy (KWh/day)
Households
Lamp 1 (Living room) 11 100 1.1 4 4.4
Lamp 2 (Kitchen room) 11 100 1.1 2 2.2
Lamp 3 (Bed room) 11 100 1.1 5 5.5
Radio / Caste player 3 100 0.3 4 1.2
21’’ color Television 60 100 6 2 12.0
School Light bulb for class 11 7 0.077 3 0.231
Light bulb for toilet 11 1 0.011 3 0.033
Health post
Vaccine refrigerator 70 1 0.07 24 1.68
Microscopes 100 2 0.2 8 1.6
Radio 3W VHF 1 0.003 8 0.024
Light bulb 11 2 0.022 8 0.176
Small busness Grinder 12KW 1 12 6 72
Small 1.1KW 1 1.1 2 2.2
Total 103.244
2.2. Solar Radiation Estimations
To determine the PV electricity generation potential for a particular site, it is important to assess the average total solar radiation received over the year. Unfortunately in most developing countries there is no properly recorded radiation data. What usually available is sunshine duration data.
Ethiopia is one of the developing countries which have no properly recorded solar radiation data and, like many other
countries, what is available is sunshine duration data. However, given a knowledge of the number of sunshine hours and local atmospheric conditions, sunshine duration data can be used to estimate monthly average solar radiation, with the help of empirical equation 1 [9].
H = H a + b (1)
horizontal surface (MJ/m2), is monthly average daily extraterrestrial radiation on a horizontal surface (MJ/m2), is a monthly average daily hour of bright sunshine, is monthly average of the maximum possible daily hours of bright sunshine and a and b are regression coefficients
Solar radiation, known as extraterrestrial radiation, H0, on
a horizontal plane outside the atmosphere, is given by equation 2.
360 * 24 * 3600
1 0.034 cos * cos cos sin sin sin 365 180
d s
o sc s
n
H G ϕ δ ω πω ϕ δ
π
= + +
(2)
Where: nd is the day number, Gsc is the solar constant
(1368 W/m2),
φ
is the latitude of the location (0),δ
is the declination angle (0), which is given as follows:[9]284 23.45*sin 360*
365
d
n
δ= +
(3)
The solar hour angle is the angular displacement of the sun east or west of the local meridian; morning negative, afternoon positive. The solar hour angle is equal to zero at solar noon and varies by 15 degrees per hour from solar noon. The relation between these angles is given as
(
1
−
12
)
15
0=
t
Lω
(4)where tL= local solar time in hours and ω= solar hour angle
(0)
The sunset hour angle
ω
s is the solar hour angle corresponding to the time when the sun sets and it is given by(
)
1 tan tan
s Cos
ω = − − ϕ δ (5)
The day length, Ns, is the maximum possible daily
sunshine hour given by
s s
N ω
15 2
= (6)
The parametric constants (regression constants) a and b are given as [10]
0.110 0.235 cos 0.322 s s
n a
N
ϕ
= − + +
(7)
1.449 0.553cos 0.694 s s
n b
N
ϕ
= − −
(8)
The longitude & latitude of the station is taken. Then using equation (3), solar declination is calculated for each day. Then sunshine hour angle is calculated for each day using equation (5). Correspondingly maximum possible sunshine hour Ns is calculated by equation (6). Extraterrestrial
radiation Ho is calculated using equation (2) and then the
regression coefficients, a & b are calculated from the correlation equations presented in equations, (7) and (8). Finally using equations, (1), the solar radiation of the village is estimated (Table 2).
Table 2. Solar energy estimated for Dembel based on Dire Dawa data.
Mid of month nd δ( 0 ) ωs( 0 ) Ns (hrs) ns Ho(KWh/ m2/ d) ns/Ns H (KWh/m2/d) KT NASA
Ja 15 15 -21.3 93.9 12.5 9.3 11.29 0.7 7.34 0.6 6.09
Fe 14 45 -13.7 92.4 12.3 9.0 11.58 0.7 7.49 0.6 6.94
Mar 15 74 -2.9 90.5 12.1 8.1 11.15 0.7 7.05 0.6 6.26
Ap 15 105 9.3 88.3 11.8 7.9 9.77 0.7 6.18 0.6 6.18
May 15 135 18.7 86.6 11.5 8.4 8.14 0.7 5.26 0.6 6.36
Ju 15 166 23.3 85.7 11.4 8.3 7.07 0.7 4.57 0.6 6.04
Jul 15 196 21.6 86.0 11.5 7.7 7.06 0.7 4.46 0.6 5.70
Au 15 227 13.9 87.5 11.7 7.6 8.04 0.6 5.02 0.6 5.80
Sep 15 258 2.3 89.6 11.9 7.3 9.45 0.6 5.79 0.6 5.94
Oc 15 288 -9.5 91.7 12.2 7.9 10.46 0.6 6.53 0.6 5.94
Nov 15 319 -19.1 93.5 12.5 9.1 10.83 0.7 7.01 0.6 6.13
Dec 15 349 -23.3 94.3 12.6 9.5 10.95 0.8 7.13 0.7 6.01
Average 12.0 8.3 9.65 0.7 6.15 0.6 6.12
In figure 1 the monthly average daily Global solar radiation for the entire year is depicted. The maximum monthly average daily Global solar radiation occurred between October-March whereas the minimum occurred between June-august. This is as a result of the peak period of the cloud cover in the country due to the rainy season. The result shows that the monthly average daily global solar radiation values for Debmel based on Dire-Dawa data lay between 4.46 KWh/m2/day (July) and 7.49 KWh/m2/day (February). The monthly average daily global solar radiation of the site is 6.15 KWh/m2/day.
2.3. Wind Resource Data Analysis
α = o o H H V
V (9)
Where: Vo is wind speed measured at the reference height
Ho, V is wind speed estimated at height H, and α is ground
surface friction coefficient.
Figure 1. Monthly average daily Global radiations for the entire year (2006-2014).
The total wind power density, P/A is the total available power per unit area, which is given by [12-14]
= ( ρ ∑ ) (10)
Where: n is the number of days in a month and ρ is the density of air (1.2 kg/m3)
Before calculating the average wind power density, vi3 of
each day was calculated and the values are summed (∑ vi3),
and then divided by the number of days in a month (∑ ). The data collected at the measured 2 m height were first extrapolated to 10 meter which is the standard height at which a wind measurement was taken (figure 2) and then extrapolated to the desired height at which the turbine will be installed.
Figure 2. Average wind speeds at 10m and 2 m heights.
The average wind speeds measured at 2 m are not ideal for estimation of wind speed. Wind speeds at higher heights are larger and the wind forces are higher and hence, the turbine requires more and better structural support (foundation) to ensure the turbines and towers not fall. The maximum turbine height is determined based on the speed of the wind at a given height and the cost that can be allotted per unit power obtained.
For this study the height considered is 30m at which the
turbine will operate. The monthly wind speed in Dembel
after extrapolation from anemometric height to 30m for each year are shown in figure 3, the wind speed varied between 1.2 m/s in January and 4.7 m/s in June. It can be observed from figure 3 that the windiest months were from June to August with average wind speed of 4.7, 4.5 and 3.7 m/s, respectively while the calmest month was October with the average wind speed of 1.2 m/s for the study period at the extrapolated height of 30 meters. The average wind speed is 2.49 m/s. Hence, this speed will not be economically viable for wind power generation.
Figure 3. Average wind speeds at 30 m and 2 m height.
Then using equation (10), average wind power was calculated for each year at 30 m (figure 4). The average wind power density shown in figure 4 recorded a similar trend with the average wind speed (figure 3). Since wind power density is proportional to the cube of wind speed, a small variation on wind speed will lead to a significant variation in wind power density. Based on the average power density, the maximum occurred during the moth August with a peak of 224.5 W/m2. The power decreased from September to May with minimum of 1.0 W/m2 in January. The average wind power density of the village is calculated as 39.4 W/m2. According to International American wind power classification, the site under study falls under class 1 (poor resource).
3. Design of Hybrid Power Generation
System
A hybrid system is a combination of one or more resources
Jan Feb Mar Apr May Jun Jul Aug Sep Oct Nov Dec
0 1 2 3 4 5 6 7 8 9
Month of the Year
R a d ia ti o n (k W h /m 2/d a y )
Monthly average daily Global for Dire Dawa
Calculated Measured
Jan Feb Mar Apr May Jun Jul Aug Sep Oct Nov Dec
0 0.5 1 1.5 2 2.5 3 3.5 4
Months of the year
W in d S p e e d ( m /s )
Average wind speed at height 10m
(10 m) (2 m)
Jan Feb Mar Apr May Jun Jul Aug Sep Oct Nov Dec
0 0.5 1 1.5 2 2.5 3 3.5 4 4.5 5
Months of the year
W in d S p e e d ( m /s )
Average wind speed at height 30m
of renewable energy such as solar, wind, micro/mini-hydropower and biomass with other technologies such as batteries and diesel generator [8, 15-30]. The hybrid system studied in this work is one combining solar PV and wind turbine with diesel generator(s) and bank of batteries, which are included for backup purposes. Power conditioning units, such as inverters, are also part of the supply system. Hybrid wind turbine and PV modules, offer greater reliability than any one of them alone because the energy supply does not depend entirely on any one source [31-34]. Figure 5 shows the schematic diagram representing the scheme as implemented in the HOMER simulation tool.
Figure 4. Average monthly wind power density at 30 m.
Figure 5. HOMER diagram for the hybrid system.
HOMER simulates the operation of the considered system by making energy balance calculations for each of the 8760 hours in a year. For each hour, HOMER compares the electric and thermal demand in the hour to the energy that the system can supply in that hour and calculates the flows of energy to and from each component of the system. For systems that include batteries or fuel- generators, HOMER also decides for each hour how to operate the generators and whether to charge or discharge the batteries.
HOMER performs these energy balance calculations for each system configuration under consideration. It then determines whether a configuration is feasible, i.e., whether it can meet the electrical demand under the specified conditions
and estimates the cost of installing and operating the system over the lifetime of the project. The system cost calculations account for costs such as capital, replacement, operation and maintenance, fuel and interest. Information about the load, resources, economic, constraints, controls and other components used in HOMER for this case are given below:
3.1. Performance Metrics
In this study, total NPC, COE and RF have been considered as performance metrics to evaluate and compare different systems. The total NPC of a system is the present value of all the costs that it incurs over its lifetime, minus the present value of all the revenues that it earns over its lifetime. Costs include capital costs, replacement costs, operational and maintenance costs, fuel costs, and emissions penalties. On the other hand, COE is the average cost per kWh of electricity. The NPC is a more trustworthy number than the COE, therefore in this analysis, NPC has been taken as the primary metric. The RF is that portion of the system’s total energy production originating from renewable power sources [5].
3.2. Electric Load
A typical load system (Table 1) for community which lives in Dembel village has been considered for the analysis. Monthly average hourly load demand has been given as an input to HOMER which then generates the daily and monthly load profile for a year for a community (figure. 6). It is found that for this system the Dembel communities’ energy consumption is summarized in section 2.1 with a peak demand of nearly 23 KW.
(a) The daily energy consumptions of the households are calculated to be approximately 25.3 kWh/day.
(b) The total energy daily energy demand for school is 0.264kWh/day.
(c) The total energy consumption of a health post calculated to be 3.48 kWh/day.
(d) The total energy consumption of grinding mills calculated to be 74.2kWh/day.
Figure 6. Daily load profile of the model village.
Figure 6 shows the time distribution of the load. Grinding machines consist of the major daily load and light bulbs are the major evening loads. The refrigerator is working all day and after 09:00 the grinding business is to reach a peak of 13
Jan Feb Mar Apr May Jun Jul Aug Sep Oct Nov Dec
0 50 100 150 200 250
Months of the year
W
in
d
p
o
w
e
r
d
e
n
s
it
y
(W
/m
2)
KW. At night light bulbs, TV and radio add to the load to reach a peakof 10 KW power.
3.3. Renewable Resources
The solar resource and wind speed of the desired site is estimated under section 2.2 and 2.3, respectively. HOMER provides a library of several predefined fuels, and users can add to the library if necessary [3, 8, 20].
3.4. Equipment to Consider
The power sources used in the hybrid system are chosen according to the project developer’s preference. For this case, wind turbines, PV, diesel generator, batteries including an energy converter with the capacity to act as both an inverter (DC to AC) and a rectifier (AC to DC) to help propagate energy through the entire system easily were chosen.
3.4.1. Wind Turbine
The primary criterion for the selection of the wind turbine is its cost. Other selection criteria used are: the type of current they generate (ac or dc), how low the cut-in wind speed is, and for what application the wind turbine be used for. The type of current they generate, whether ac or dc, is also considered as it have impacts on the size of the inverter. As the aim of the work is to supply electric energy to remotely located communities, the wind turbines selected should be those which are applicable for home or off-grid applications [8, 35-36].
Based on the selection criteria mentioned above, the type of wind turbine to be used is HY-5 KW which has a good cut- in speed of 2m/s. This wind turbine was obtained from those wind turbine website owned by Hulk Energy Machinery. The turbine is a 5 kW turbine commonly available on the market such as the one for which the power curve is given in figure 7.
Figure 7. Power curve for HY-5 wind turbine [37].
3.4.2. Photovoltaic (PV) Module
In the same manner with the wind power system, HOMER has got a window where different design parameters will be fed for considering PV module in the simulation. These data include the size of PV system, the cost (capital, replacement, and O&M), the life time, and other related design data. Sizes of PV systems have been proposed in the range of 0kW to
40kW to study the sensitivity of the variation in the PV system beginning from no PV from the system to the maximum of 40kW. Accordingly the capital cost of each sizes have been linked to the appropriate sizes. Here it should be noted that the capital cost estimation has been taken directly from Table 2, consequently $3/W of capital cost has been used as cost multiplier. In the replacement column also, a cost multiplier of $1.8/W has been used [15, 38-40]. In the O and M section of the input, almost the cost is negligible, therefore left to be null. Moreover the estimated life time (25 years).
3.4.3. Diesel Generators
The diesel generator in this hybrid system acts as the secondary power source. It is set to support the PV & wind turbine generators when they are not producing enough electricity to meet the load. Diesel generators are cheaper to install but have higher operational costs than the wind turbines and PV therefore they are run for as few hours as possible. One diesel generator was chosen and different sizes were considered for simulation, 0, 6, 10, 15, & 20 kW. This allows the software to select the most economical generator capacity for the system. The capital cost for the generator was set at $0.6/W, cost of replacement at $0.48/W and $0.5/ hour is the operation and maintenance cost excluding fuel cost [23,41].
3.4.4. Batteries
The batteries in a hybrid system work as reserve or back up energy. They are charged when the electricity produced in the system is greater than the load and discharged when the demand is higher than the power generated. The Surrette 6CS25P battery was chosen for this research because its financial information was available and results of its operation in a hybrid system could be accessed [3, 8, 15]. The capital cost input is assumed to cover all mounting, installation and labor costs related to the batteries’ acquisition. In this case, the capital and replacement costs for one battery were $833 and $555 respectively while O and M costs were $15/year [3, 8, 15]. The default minimum battery life for Surrette 6CS25P that is considered by HOMER is 4 years and is thus used in this study.
3.4.5. Converter
The converter is necessary when a power system requires the conversion of alternating current AC to direct current DC or vice versa. If both conversions are needed, the converter acts as both an inverter (DC to AC) and a rectifier (AC to DC). The capital and replacement costs for the converter were taken as $0.7/watt and lifespan as 15 years [3, 8, 15, 20].
3.4.6. Other Parameters
Table 3. Inputs to the HOMER software.
PV Module Wind turbine Diesel Generator Battery S6CS25p Converter
Size (kW) 1 5 15 1156Ah 1
Capital ($) 1200-4500 4990 9000 833 700
Replacement Cost($) 1200-4500 3327 7200 555 700
O & M cost($/yr) 0 100 0.5/hr 15 0
Sizes (kW) considered 0,5,10,15, 20,25,30,35,40 --- 0,6,10,15,20 --- 0,10,15,20
Quantities --- 0,1, 2,3 --- 0,1,4,8,12,16,24,32 ---
Life Time 25 years 25 years 20,000hrs 9645KWh (4 yrs) 15yr
The Economics section covers interest rates and helps in the calculation of net present value. (Annual real interest rate is a term used to express the discount rate used to convert between onetime cost and annualized costs. Here in Ethiopia, the interest rate from Ethiopian National Bank is 10% and 25 years project life time is used for present cost analysis). The emissions section lets the developer calculate the amounts and consequent penalties of hazardous gases emitted by the power system. To account greenhouse effect, a $15/tone of penalty for CO2 emission is considered. The constraints
section allows the modeler to set operational limits in which the system is feasible. These operational limits include the maximum annual capacity shortage, renewable energy
fraction, operating reserve and primary energy savings. Maximum annual energy shortage and minimum renewable fraction are set to 5% and 0% respectively [5].
3.5. Summary of Sensitivity Cases and Optimization Variables
Table 4 shows the Sensitivity inputs, and the Optimization Variables. A diesel price of $0.8/l, $1.0/l and $1.2/l, turbines hub height at 10m and 30 m and a PV capital and replacement cost multipliers of 0.6, 0.8 and 1 are taken for sensitivity analysis.
Table 4. Summary of Optimization Variables and Sensitivity Inputs.
Optimizations variable Sensitivity Inputs
PV (kW) HY-5 (Quan) Gen (kW) Batteries (Quan) Conv (kW) Diesel ($/L) Turbines Hub
height (meters)
PVcapital and replacement cost multipliers
0, 5, 10, 15, 20,
25, 30, 35, 40 0, 1, 2, 3
0, 6, 10, 15, 20
0, 4, 8, 12, 16, 24,
32 0, 10, 15, 20 0.8, 1, 1.2 10, 30 0.6, 0.8, 1
4. Results and Discussion
After entering the wind and solar resource data into software, to find the optimum solutions, HOMER is run repeatedly by varying parameters that have a controlling effect over the output. The parameters that have controlling effect on output are given in table 3.
4.1. Optimization Results
The output of the simulation is a list of feasible combinations of PV, wind-turbine, generator, converter, and battery hybrid system set-up. The resulting list of optimal combinations of realizable setups obtained is given in both overall and categorized forms.The tables are generated based
on a particular set of inputs selected from the input summary table (table 3) and the solar and wind resource data for site. Table 5 shows the resulting list of feasible combinations of system components in the overall form. As the table is too long to fit in this section, it has been truncated and only a selected part is kept here.
The following remarkable results can be noted from the table. The most cost effective system, i.e. the system with the lowest net present cost, is the PV-generator-battery-converter set-up with the generator operating. For this set-up, the total net present cost (NPC) is $ 155,875, the cost of energy (COE) is 0.415$/kWh, contribution from renewable resources is 91%, the amount of diesel oil used annually is 2,233 liters and the generator operates for 1,859 hours per year.
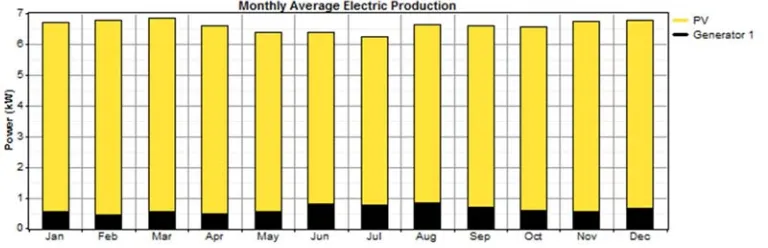
In this set-up the part that renewable resources contribute to the supply system is quite significant, being 91%. This setup could be a good choice for implementation. Figure 8 shows the monthly average electrical production of this
system. Table 6 gives some of the main information about the system. The cost breakdown supported by a column-chart for this set-up is also given in Figure 9.
Figure 9. Cost summary for the 91% renewable resource contribution.
Table 5. Overall optimization results.
PV (kW) HY-5 Gen.(kW) Battery Converter (kW)
Dispatch strategy
Initial capital
Operating
cost($/y) Total NPC COE ($/kWh)
Renewable fraction
Capacity shortage
Diesel
(L) Gen.(hrs)
30 6 32 15 LF $ 121,756 3,759 $ 155,875 0.415 0.91 0.04 2,233 1,859
30 6 32 20 LF $ 125,256 3,408 $ 156,190 0.419 0.92 0.05 1,885 1,443
35 6 24 20 LF $ 132,092 2,774 $ 157,272 0.419 0.94 0.03 1,555 1,213
35 6 24 15 LF $ 128,592 3,237 $ 157,975 0.419 0.93 0.03 2,012 1,707
20 6 16 10 CC $ 77,928 9,000 $ 159,624 0.422 0.61 0.03 8,007 4,879
20 10 8 15 LF $ 77,164 9,135 $ 160,080 0.426 0.64 0.05 7,917 3,812
20 10 8 10 LF $ 73,664 9,540 $ 160,263 0.425 0.63 0.04 8,347 4,031
20 10 12 15 LF $ 80,496 8,846 $ 160,787 0.427 0.66 0.05 7,514 3,650
35 6 32 20 LF $ 138,756 2,431 $ 160,822 0.424 0.96 0.02 978 765
25 10 16 15 LF $ 97,328 7,003 $ 160,894 0.424 0.76 0.03 5,674 2,887
20 10 12 10 LF $ 76,996 9,248 $ 160,942 0.426 0.64 0.04 7,927 3,889
25 10 12 15 LF $ 93,996 7,382 $ 161,001 0.425 0.75 0.03 6,148 3,105
30 1 6 32 15 LF $ 126,746 3,859 $ 161,771 0.431 0.91 0.04 2,233 1,859
25 10 8 15 LF $ 90,664 7,847 $ 161,888 0.428 0.73 0.03 6,703 3,348
40 32 20 CC $ 148,656 1,458 $ 161,893 0.436 1.00 0.04
40 32 20 LF $ 148,656 1,458 $ 161,893 0.436 1.00 0.04
20 10 16 15 LF $ 83,828 8,620 $ 162,070 0.430 0.67 0.04 7,178 3,503
30 1 6 32 20 LF $ 130,246 3,507 $ 162,076 0.435 0.92 0.05 1,883 1,442
20 10 16 10 LF $ 80,328 9,018 $ 162,186 0.429 0.66 0.03 7,573 3,757
25 10 16 20 LF $ 100,828 6,762 $ 162,206 0.428 0.77 0.03 5,431 2,684
35 6 32 15 LF $ 135,256 2,990 $ 162,394 0.427 0.95 0.02 1,518 1,348
Table 6. System report for the 91% renewable resource contribution.
System Architecture Annual Electric Production(kWh/yr)
PV Array 30 KW Sensitivity case PV Array 52,479 91%
Wind Turbine 0 Solar Data (kWh/m²/d) 5.9 Wind Turbine 0 0%
Gen1 6KW Wind (m/s) 1.1 Gen1 5,361 9%
Battery 32 Surret6CS25 Diesel Price ($/L): 1 Total 57,840 100%
Inverter 15KW PV Capital Cost Multiplier: 1 Excess electricity 9,380 16.2
Rectifier 15KW PV Repl. Cost Multiplier: 0.6 Unmet load 990 2.3
Dispatch Strategy Load Following Capacity shortage 1,576 3.7
Table 6. Continued.
System Architecture Annual Electric consumption
(kWh/yr) Emissions
PV Array 30 KW Sensitivity case AC primary
load 41,350 100% Pollutant
Emissions (kg/yr)
Wind Turbine 0 Solar Data (kWh/m²/d) 5.9 Total 41,350 100% CO2 5,879
Gen1 6KW Wind (m/s) 1.1 CO 14.5
Battery 32 Surret6CS25 Diesel Price ($/L): 1 Cost summary Unburned HC 1.61
Inverter 15KW PV Capital Cost Multiplier: 1 Total NPC $155,875 Particulate
matter 1.09
Rectifier 15KW PV Repl. Cost Multiplier: 0.6 Levelized CoE $0.415/KWh SO2 11.8
Dispatch Strategy Load Following Operating cost $3,759 NOx 129
4.2. Sensitivity Result
Sensitivity analysis was also carried out and figure 10 shows the variation of PV capital cost multiplier against diesel price for a fixed average wind speed of 1.1m/s (measured at 2 meters) and average solar radiation of 5.9 kWh/m2/day. In the figure, the net present cost of the most cost-effective set-up for a particular set of diesel and PV prices is also included. In this figure (fig.10) it can be seen that the wind plays no role in supplying energy to the community.
5. Conclusion
the results, the wind energy potential of the site is found to be considerable very low and the area has huge utilizable solar energy potential. HOMER simulation program developed by NREL has been used as optimization and simulation tool and the result was analyzed and the PV-generator-battery-converter hybrid system was selected among the many feasible systems based on some important parameters such as less net present cost, high renewable penetration, small levelized cost of energy, less annual diesel consumption, less unmet load, and less capacity shortage. The COE of the feasible setup in this study is 0.415$/kWh, which is high compared to the current global electricity tariff and the tariff in the country (<5 cents/kWh). However, considering the shortage of electricity in the country (<20% coverage) and absence of electricity usage in rural areas (<2% coverage), this cost should not be taken as a decisive factor. Taking these issues into account the free solar and wind energy of the country should be utilized to improve the quality of life of the communities living in rural areas.
Acknowledgments
I would like to acknowledge Jijiga University for sponsorship and National meteorological agency of Ethiopia (NMA) for the meteorological data they have supplied to me. The comments and suggestions provided by the Mr Asnake Sahele, Dr. Yedilfana Setarge and Dr. Girum Ayalneh are highly appreciated and duly acknowledged.
References
[1] C. Breyer et al., “ELECTRIFYING THE POOR: HIGHLY ECONOMIC OFF-GRID PV SYSTEMS IN ETHIOPIA – A BASIS FOR SUSTAINABLE RURAL DEVELOPMENT,” 2007.
[2] “CIA the world fact book,” 2010. [Online]. Available: http://www.umsl.edu/services/govdocs/wofact2007/geos/et.ht ml#People. [Accessed: 01-Jan-2001].
[3] B. Getachew, “STUDY INTO THE POTENTIAL AND FEASIBILITY OF A STANDALONE SOLAR- WIND HYBRID ELECTRIC ENERGY SUPPLY For Application in Ethiopia.,” Royal Institute of Technology KTH, Doctoral Thesis, 2009.
[4] A. Dalelo, “RURAL ELECTRIFICATION IN ETHIOPIA ”
Addis Ababa Univ. Coll. Educ. Dep. Geogr. Environ. Educ., 2003. [5] HOMER, “The micropower optimization model,
ver.2.81Beta.” [Online]. Available: http://www.nrel.gov/homer.
[6] Japanese Embassy in Ethiopia, “Study on the Energy Sector in Ethiopia,” 2008.
[7] A. Gupta, R. P. Saini, and M. P. Sharma, “Modelling of hybrid energy system d Part I : Problem formulation and model development,” Renew. Energy, vol. 36, no. 2, pp. 459–465, 2011. [8] G. Boneya, “Design of a Photovoltaic-Wind Hybrid Power
Generation System for Ethiopian Remote Area,” Addis Ababa University, Institute of Technology, Department of Electrical and Computer Engineering, MSc. Thesis, 2011.
[9] J. A. Duffie and W. A. Beckman, Solar Engineering of Thermal Processes, Fourth Edi. New York: Wiley.
[10] A. Usman, M. Akhtar, and K. Jamil, “Empirical Models for the Estimation of Global Solar Radiation with Sunshine Hours on Horizontal Surface in Various Cities of Pakistan,”
Pakistain J. Meteorol., vol. 9, no. 18, pp. 43–49, 2013. [11] P. Gipe, Wind Power: Renewable Energy for Home, Farm,
and Business. Chelsea Green Publishing Company., 2004. [12] A. V. da Rosa, Fundamentals of Renewable Energy processes.
Elsevier Inc, 2005.
[13] M. R. Patel, Wind and Solar Power Systems: Design, Analysis, and Operation, Edition, S. Taylor & Francis Group, 2006. [14] J. Twidell and T. Weir, Renewable Energy Resources, 2nd
Edn. London: Taylor & Francis, 2006.
[15] R. Chemeda, “ROYAL INSITITUTE OF TECHNOLOGY FEASIBILITY STUDY OF STAND ALONE WIND-SOLAR PV HYBRID ENERGY SYSTEMS FOR SMALL.,” ROYAL INSITITUTE OF TECHNOLOGY KTH, MSc. Thesis Final Report, 2009.
[16] A. H. Abraha, M. B. Kahsay, and C. Z. M. Kimambo, “Hybrid Solar – Wind – Diesel Systems for Rural Application in North Ethiopia : Case Study for Three Rural Villages using HOMER Simulation,” Momona Ethiop. J. Sci., vol. 5, no. 2, pp. 62–80. [17] S. Pradeepkumar, P. Azhagiri, T. Senthilkumar, and B.
Kumaragurubaran, “Generation of Electrical Energy Using Hybrid Energy of PV Solar Cell, Wind Turbine, Rain Water and Perpetual Motion,” Imp. J. Interdiscip. Res., vol. 2, no. 6, pp. 1512–1521, 2016.
[18] S. T. Bahta, “Design and Analyzing of an Off-Grid Hybrid Renewable Energy System to Supply Electricity for Rural Areas,” KTH Royal Institute of Technology, Master of Science Thesis, 2013.
[19] N. A. Bila, “Feasibility Study of Solar-Wind Hybrid Power System for Rural Electrification at the Estatuene Locality in Mozambique,” KTH Royal Institute of Technology, Master of Science Thesis, 2015.
[20] G. Tadesse, “Feasibility Study of Small Hydro / PV / Wind Hybrid System ystem for Off Off-Grid Grid Rural Electrification in Ethiopia.,” Addis Ababa University, Institute of Technology, Department of Electrical and Computer Engineering, MSc. Thesis, 2011.
[21] A. Mohajer, O. Nematollahi, M. M. Joybari, S. A. Hashemi, and M. R. Assari, “Experimental investigation of a Hybrid Solar Drier and Water Heater System,” Energy Convers. Manag., vol. 76, pp. 935–944, 2013.
[22] B. Moges and A. Retta, “ROYAL INSITITUTE OF TECHNOLOGY MODELING AND ANALYSIS OF WIND HYDROGEN ENERGY Msc thesis final report,” ROYAL INSITITUTE OF TECHNOLOGY KTH, MSc. Thesis, 2010. [23] C. Arthur, O. Supervisor, and B. Uzunoglu, “Hybrid Energy
[24] R. K. Akikur, R. Saidur, H. W. Ping, and K. R. Ullah, “Comparative study of stand-alone and hybrid solar energy systems suitable for off-grid rural electri fi cation : A review,”
Renew. Sustain. Energy Rev., vol. 27, pp. 738–752, 2013. [25] A. S. Tiwari, “Solar and Wind Hybrid System for Rural
Electrification,” Int. J. Recent Innov. Trends Comput. Commun., vol. 2, no. 5, pp. 1074–1077, 2014.
[26] A. González, J. R. Riba, and A. Rius, “Optimal sizing of a hybrid grid-connected photovoltaic-wind-biomass power system,” Sustain., vol. 7, no. 9, pp. 12787–12806, 2015. [27] A. M. Yebi, “Techno-economic Assessment of Wind Energy
to Supply the Demand of Electricity for a Residential Community in Ethiopia.,” YAL INSITITUTE OF TECHNOLOGY KTH, MSc. Thesis, 2011.
[28] I. Tzanakis, “COMBINING WIND AND SOLAR ENERGY TO MEET DEMANDS IN THE BUILT ENVIRONMENT (GLASGOW-HERAKLION CRETE ANALYSIS),” University of Strathclyde, MSc in Energy Systems and the Environment, 2006.
[29] Natei Ermias Benti, “FEASIBILITY STUDY OF STAND ALONE WIND-SOLAR PHOTOVOLTAIC (PV) HYBRID ENERGY SYSTEMS FOR ELECTRIFICATION FOR RURAL ETHIOPIA (A CASE STUDY HADAS VILLAGE),” Haramaya University, CNCS, Department of Physics, MSc. Thesis, 2012.
[30] B. Ali, K. Sopian, M. A. Rahman, M. Y. Othman, A. Zaharim, and A. M. Razali, “Performance of a Hybrid Photovoltaic Diesel System in a Cable Car Resort Facility,” in 4th IASME/WSEAS International Conference on ENERGY,
ENVIRONMENT, ECOSYSTEMS and SUSTAINABLE
DEVELOPMENT (EEESD’08), 2008, pp. 183–187.
[31] G. C. Bakos, “Feasibility study of a hybrid wind / hydro power-system for low-cost electricity production,” Elsevier, Appl. Energy, vol. 72, pp. 599–608, 2002.
[32] D. Connolly, H. Lund, B. V Mathiesen, and M. Leahy, “A review of computer tools for analysing the integration of renewable energy into various energy systems,” Appl. Energy, vol. 87, no. 4, pp. 1059–1082, 2010.
[33] R. P. Saini and M. P. Sharma, “Integrated renewable energy systems for off grid rural electrification of remote area,”
Renew. Energy, vol. 35, no. 6, pp. 1342–1349, 2010.
[34] T. Ma, H. Yang, and L. Lu, “A feasibility study of a stand-alone hybrid solar – wind – battery system for a remote island for a remote island,” Appl. Energy, vol. 121, no. May 2014, pp. 149–158, 2015.
[35] “All Small Wind Turbines website.” [Online]. Available: http://www.allsmallwindturbines.com/. [Accessed: 20-Feb-2016].
[36] “HUAYING Wind Turbine:” [Online]. Available: http://www.huayingwindpower.com/. [Accessed: 19-Feb-2016].
[37] “Hulk Energy Machinery.” [Online]. Available: http://www.hulkenergy.com. [Accessed: 20-Feb-2016]. [38] “Eco Business Links,.” [Online]. Available:
http://www.ecobusinesslinks.com. [Accessed: 20-Feb-2016]. [39] “Solar buzz.” [Online]. Available:
http://www.solarbuzz.com/industry-news. [Accessed: 22-Feb-2016].
[40] “Solar Panel Price.” [Online]. Available:
http://solarpanelprices.org. [Accessed: 22-Feb-2016].


![Figure 7. Power curve for HY-5 wind turbine [37].](https://thumb-us.123doks.com/thumbv2/123dok_us/8483991.1714730/6.595.51.285.515.651/figure-power-curve-hy-wind-turbine.webp)