I
In
nt
t
er
e
rn
na
at
ti
io
on
n
a
a
l
l
J
J
ou
o
ur
rn
na
al
l
o
o
f
f
B
Bi
io
ol
lo
o
gi
g
ic
ca
a
l
l
S
S
ci
c
ie
en
nc
ce
es
s
2016; 12(1): 100-108. doi: 10.7150/ijbs.13498Review
Genome Wide Sampling Sequencing for SNP
Geno-typing: Methods, Challenges and Future Development
Zhihua Jiang1, , Hongyang Wang1,2, Jennifer J. Michal1, Xiang Zhou1, Bang Liu2, Leah C. Solberg Woods3
and Rita A. Fuchs4
1. Department of Animal Sciences, Washington State University, Pullman, WA 99164-7620, USA;
2. Key Laboratory of Agricultural Animal Genetics, Breeding and Reproduction of Ministry of Education and The Cooperative Innovation Center for Sustainable Pig Production, Huazhong Agricultural University, Wuhan, China;
3. Department of Pediatrics, Human and Molecular Genetics Center and Children's Research Institute, Medical College of Wisconsin, Milwaukee, WI 53226, USA;
4. Department of Integrative Physiology and Neuroscience, Washington State University College of Veterinary Medicine, Pullman, WA 99164-7620, USA.
Corresponding author: Dr. Zhihua Jiang ([email protected]).
© Ivyspring International Publisher. Reproduction is permitted for personal, noncommercial use, provided that the article is in whole, unmodified, and properly cited. See http://ivyspring.com/terms for terms and conditions.
Received: 2015.08.07; Accepted: 2015.11.07; Published: 2016.01.01
Abstract
Genetic polymorphisms, particularly single nucleotide polymorphisms (SNPs), have been widely used to advance quantitative, functional and evolutionary genomics. Ideally, all genetic variants among individuals should be discovered when next generation sequencing (NGS) technologies and platforms are used for whole genome sequencing or resequencing. In order to improve the cost-effectiveness of the process, however, the research community has mainly focused on de-veloping genome-wide sampling sequencing (GWSS) methods, a collection of reduced genome complexity sequencing, reduced genome representation sequencing and selective genome target sequencing. Here we review the major steps involved in library preparation, the types of adapters used for ligation and the primers designed for amplification of ligated products for sequencing. Unfortunately, currently available GWSS methods have their drawbacks, such as inconsistency in the number of reads per sample library, the number of sites/targets per individual, and the number of reads per site/target, all of which result in missing data. Suggestions are proposed here to im-prove library construction, genotype calling accuracy, genome-wide marker density and read mapping rate. In brief, optimized GWSS library preparation should generate a unique set of target sites with dense distribution along chromosomes and even coverage per site across all individuals.
Key words: restriction site associated DNA sequencing, genotyping by sequencing, reduced representation li-brary sequencing, complexity reduction of polymorphism sequencing; dominant and co-dominant markers, genome wide association study, human, animals and plants
Introduction
Single nucleotide polymorphisms (SNPs) are the predominant forms of sequence variations in both plant and animal genomes [1]. For example, approx-imately 150 million SNPs have been discovered in the human genome (see dbSNP database at the National Center for Biotechnology Information, http://www.ncbi.nlm.nih.gov/SNP/). The urgent need for simultaneous genotyping of many thousands of SNPs on large numbers of individual samples has accelerated the innovation of novel SNP genotyping
platforms, such as oligonucleotide arrays (Affymetrix, Inc., Santa Clara, CA, USA) [2,3] and BeadArray mi-croarrays (Illumina, Inc., San Diego, CA, USA) [4]. Currently, Affymetrix offers genotyping arrays for livestock and aquaculture species (buffalo, cattle, chicken, pig, salmon and trout), crops (cotton, maize, soybean, strawberry and wheat) and biomedical and model organisms (human, dog, mouse and Arabidopsis
thaliana) (http://www.affymetrix.com/estore/),
while Illumina markets whole genome genotyping
Ivyspring
BeadArrays for human and non-human species (cat-tle, dog, maize, pig and sheep) (http://www.illumina.com/index-d.html).
These SNP arrays or chips have been widely used in 1) long range linkage disequilibrium analyses for determination of population structures/individual ancestries, 2) genome wide association studies (GWAS) for understanding genetic complexity of complex phenotypes that affect human health or economically important traits in animals and plants, 3) detection of genome instability for evaluation of somatic copy number lesions and germline copy number variation and 4) even transcriptome profiling for investigating allele-specific expression patterns [5-7]. However, these commercially available SNP arrays or chips cannot be easily modified to suit indi-vidual experimental designs. In addition, relevant research cannot be conducted for species that do not have commercially available SNP arrays/chips. It is true that customized SNP arrays/chips can be manu-factured, but they are cost-prohibitive to many re-searchers.
Next generation sequencing (NGS) technologies, on the other hand, generate millions of reads in a rel-atively short amount of time, making them powerful tools for genome research [8,9]. For example, one full NGS run can produce 1 million to 5,000 million reads in 8 hours to 11 days, depending on the platform [10]. Such a high throughput capability of genome se-quencing or re-sese-quencing projects should efficiently and accurately discover and genotype many thou-sands of genetic polymorphisms, mainly SNPs, which can be used to investigate quantitative, functional, and evolutionary genomics in human, animals, and plants. To date, high (20x to 30x, for example) or low (approximately 5x, for example) whole genome se-quencing or resese-quencing coverage has been pro-posed as a useful strategy to discover these genetic variants [11].
It is obvious that a high coverage strategy can lead to a high cost project, in particular when it deals with large eukaryotic genomes (such as mammalian and many plant species) and large sample sizes. However, a low coverage strategy also has drawbacks because SNP calling is difficult and will result in low genotyping accuracy and high genotyping errors [11]. Furthermore, whole genome sequencing/ resequencing for SNP genotyping is technically un-necessary and is cost-prohibitive, because linkage disequilibrium relationships (r2 values) can be as high
as 95% - 100% among genetic markers within a gene or a genomic region [12,13]. In practice, only one of the highly linked markers is usually selected as a tagged SNP in data analysis.
In order to address the limitations associated
with SNP arrays/chips and the high/low coverage whole genome sequencing/resequencing platforms described above, the genome research community has been developing alternative strategies to discover and genotype genetic variants in a cost effective manner. Basically, these alternative methods/techniques are NGS-based, but different laboratory procedures can result in different data outcomes in terms of reduced genome complexities, reduced genome representa-tions or selected genome targets. In contrast to whole genome sequencing/re-sequencing, a basic feature associated with these methods/techniques is to have a subset of a genome sampled and sequenced. As such, we collectively term these techniques as genome-wide sampling sequencing (GWSS) methods. Recently, Davey and co-workers [14] indicated that these methods are applicable to both model organisms with known genomes and non-model organisms with un-known genomes. For example, GWSS applications were used for SNP discovery in common bean [15], eggplant [16], flax [17] and pigs [18].
Traditionally, GWSS methods involve three common steps: 1) DNA digestion with restriction en-zymes, 2) ligation with adapters that fit into the rele-vant sequencing platforms and 3) PCR amplification to increase the yield of library products for sequenc-ing. The genome sampling process depends on the use of rare-cutter enzymes, size selection of products, or selective amplification of products. Because exome sequencing samples all exons within a genome, we will include it in the present review. Nevertheless, these methods have their drawbacks, such as incon-sistency in not only the number of reads per sample library, but also the number of sites/target per indi-vidual and the number of reads per site/target. Con-sequently, missing data and uneven distribution of markers along each chromosome is unavoidable. Therefore, GWSS methods must be improved to ad-dress these issues.
GWSS method review
Currently available GWSS methods have mainly evolved from reduced representation (library) se-quencing (RRS or RRLS) [19,20], complexity reduction of polymorphism sequencing (CRoPSTM) [21],
with size selection and 4) GWSS with selective ampli-fication. Generally speaking, GWSS libraries can be constructed by digesting DNA with one or two re-striction enzymes and analyzing the subsequent li-brary with Illumina or Ion Torrent sequencing plat-forms.
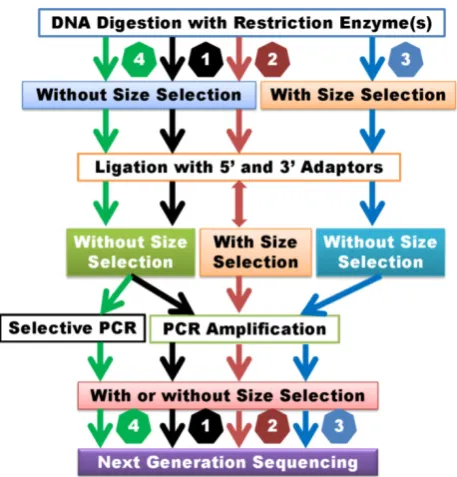
Figure 1.Classification of GWSS methods. 1) GWSS without size selection after DNA digestion and ligation. Size selection may be employed after PCR ampli-fication. 2) GWSS with semi-size selection. These methods perform size selection after ligation with adapters. Some methods may combine random shearing with size selection and then ligate with the second adapter. 3) GWSS with size selection immediately after DNA digestion. 4) GWSS with selective amplification. These methods are dependent on primer design for selective amplification of products for sequencing. Theoretically, the former two groups of methods can lead to reduction of genome complexity, while the latter two groups of methods may result in reduction of genome representation.
GWSS without size selection
Examples of methods designed to prepare li-braries without size selection include GBS [23], GBS with two restriction enzymes [24] and genome re-ducing and sequencing (GGRS) [25] (Supplemental Table 1). The main steps in these methods include digestion of DNA with restriction enzymes, simulta-neous ligation of adapters, and selective amplification of products with PCR using primers complementary to ligated adapter sequences (Figure 1). Of the three methods above, only GGRS [25] employs selection of 300- to 500-bp PCR products for sequencing. Size se-lection at this stage of library preparation probably does not significantly affect the sequencing outcome in terms of genome complexity when compared to GBS and two-enzyme GBS methods. Rather, these three methods differ in the design of their adapters. Sample preparation with the GBS method uses a barcode adapter and a common adapter, which allow
for multiplexing of 48 or 96 samples [23]. In compar-ison, when libraries are prepared with two-enzyme GBS, a conventional adapter is designed for ligation to one cohesive end of the fragmented DNA, while a Y-type adapter is designed for ligation to the other end of the DNA fragment. This design ensures spe-cific amplification of only fragments produced by digestion with the two restriction enzymes [24]. The GGRS approach requires usage of only one Y-type adapter for library preparation [25]. In brief, these methods rely on usage of five- or 6-cutter enzymes to prepare sequencing libraries with reduced genome complexity. In theory, DNA fragments too long to be amplified by polymerase would be excluded from the library. Overall, libraries prepared with GWSS with-out size-selection methods are relatively simple, ro-bust, time and cost-efficient approaches [23]. Obvi-ously, these methods require specific sets of custom-ized barcoded adapters for different enzymes or en-zyme combinations.
GWSS with semi-size selection
(Supplemental Table 1). The flexible and scalable GBS [11] technique uses restriction enzymes to produce DNA fragments with blunt ends. Obviously, blunt ends do not require end-repair, but dA-tailing is used for ligation to universal Illumina adapters. If the liga-tion step is not optimized, size selecliga-tion of ligated products may lead to inefficient genome representa-tion reducrepresenta-tion. As such, the reduced genome com-plexity of libraries prepared with GWSS methods that do not employ size selection or use only semi-size selection may not be significantly different if DNA is digested with the same enzyme(s).
GWSS with size selection
Seven examples of GWSS library preparation with size selection are presented in this review, in-cluding reduced representation shotgun sequencing (RRS) [19], reduced representation libraries (RRLs) [20], paired-end reduced representation libraries (paired-end RPLs) [27], GBS with one enzyme digest [28], GBS with two enzyme digest [29], improved RRLs (iRRL) [30] and type IIB endonucleases re-striction-site associated DNA (2b-RAD) [31] (Sup-plemental Table 1). Terminologically, these methods seem quite different, but their library preparation procedures are almost identical: DNA digestion, size selection, adapter ligation, PCR amplification and sequencing (Figure 1). Only the original RRS method [19] used the traditional cloning technique. When libraries were prepared for 66 cattle DNA samples using the RRLs method, Van Tassell and colleagues [20] discovered over 62,000 SNPs based on approxi-mately 50 million reads. Kerstens and co-workers [27] used the same method to investigate structure varia-tion in chickens. They made four DNA pools: a white egg layer line, brown egg layer line, and two different broiler lines, each with 25 individuals. The AluI di-gested DNA was separated on a 10% precast poly-acrylamide gel (BioRad). DNA fragments of 100-200 bp in length were sliced out of the gel, followed by elution and precipitation for library preparation using the Illumina sequencing technology platform. Gre-minger et al. [30] reported an iRRL protocol for dis-covery of genetic markers using samples derived from two orangutan populations. They selected HaeIII for their method after analyzing in silico digestion with 23 blunt-end cutters (4–6 bp recognition sites) in multiple combinations. During the library preparation, Gre-minger and colleagues [30] paid special attention to size selection: the digested DNA fragments were separated on high-resolution gels and only 104 bp -123 bp fragments were excised from the gels and recovered by electro elution. The remaining steps in their method followed the SOLiD ChiP-Seq protocol [30]. The 2b-RAD method [31] uses one enzyme, such
as BsaXI or AlfIfor digestion, but it can produce tags of uniform size for amplification and sequencing.
GWSS with selective amplification
Two examples of GWSS with selective amplifi-cation are listed in Supplemental Table 1. The CRoPSTM method, which is based on the AFLP®
(Amplified fragment length polymorphisms) tech-nique [21,32,33] belongs to this group of GWSS methods. This technology involves digestion of ge-nomic DNA with a pair of enzymes, followed by liga-tion with adapters and PCR amplificaliga-tion (pre-amplification and selective-amplification). The amplified products are separated on a gel for tradi-tional AFLP analysis [32] or sequenced using a Ge-nome Sequencer (GS) 20/GS FLX next-generation sequencing platform [21]. Although it is called scala-ble GBS, the method developed by Sonah and col-leagues [34] is also a good example of GWSS with selective amplification. The authors used longer 3’ primers that contained three parts: the entire common adapter, the 3’ restriction site, and an extension of 1 or 2 bases into the insert fragments. In brief, these methods do not involve size selection, but employ selective amplification of products for sequencing (Figure 1). Although it is a totally different approach, here we briefly discuss the whole exome sequencing (WES) method [35]. The WES technique usually starts with construction of a whole genome shotgun library. Fragments that range in size from 150 bp to 250 bp are collected after gel electrophoresis, and exome capture arrays are designed based on Refseq mRNA se-quences. The shotgun library is then hybridized to the exome arrays and exon region related products are captured. The hybridized products are recovered from the slides and amplified for sequencing [36]. The WES method selectively sequences 2 – 3% of the ge-nome; however, this represents more than 98% of the exon regions [35].
GWSS technical challenges
with paired-end reads) can be collected for each di-gested product. Size selection immediately after re-striction digestion can certainly reduce genome rep-resentation as not all digested products will be se-quenced. However, quality control of size selection can be practically challenging. When techniques that utilize selective amplification are employed, the re-duction of genome representation depends on primer design, but mismatch amplification can jeopardize the process. Therefore, the genome research community must address these problems to improve preparation of GWSS libraries.
Inconsistency in the number of reads per sample
Although the same set of primers is used to am-plify a pool of libraries/samples under the same PCR conditions, the number of reads per library or per sample varies. Using RAD-seq, Baird and colleagues [22] tested 96 F2 fish and found variable numbers of
reads sequenced per sample: 68% of individuals had between 50 K and 150 K RAD tags sequenced. Using GBS, Elshire and coworkers [23] reported a high CV (coefficient of variation) in the number of reads con-taining the appropriate barcode. Further, the cut sites with reads collected ranged from 23% among barley samples to 43% among maize samples when ApeKI was used to digest the genomic DNA. When 47 cattle DNA samples were digested with PstI, De Donato and colleagues [37] observed that read number per individual varied by 39%. Byrne and coworkers [38] investigated genetic diversity among eight perennial ryegrass varieties. After separate digestion with ApeKI and PstI, the CV for the number of reads per sample ranged from 27% to 62%. Moreover, the barcode (F(31, 223) = 20.93, p = 0.001) and barcode length (F(4, 250) = 29.89, p = 0.001) had significant effects on read num-bers per sample [38].
Inconsistency in the number of sites sequenced per sample
In addition to variation in the number of reads per library, Chen et al. [25] observed disparities in the number of sites with reads mapped per library, ranging from 171,472 to 447,051 sites per sample and site number among individuals had a CV of about 21%. When eight restriction enzymes (MlyI, AluI, RsaI,
DraI, EcoRV, StuI, HaeIII and HincII) were used to create blunt-end GBS libraries, Heffelfinger and coworkers [11] found that total percentage of pre-dicted sites covered with reads ranged from 5.04% (digested with HincII) to 26.84% (digested with HaeIII)
in maize and from 8.67% (digested with StuI) to 51.32% (digested with AluI) in rice.
Inconsistency in the number of reads per site
Beissinger and colleagues [28] collected over 118 million GBS sequence reads to determine the number of reads per site using Zea mays inbred B73 as a ref-erence and enzyme ApeKI for digestion. During the library preparation, they selected ApeKI fragments of 70 to 318 bp in length for sequencing. This strategy should have yielded a predicted total of 1,406,269 sites as the number of reads per site is expected to follow a Poisson distribution with a mean equal to the average coverage (~40 reads per site). However, they found 0 reads for 1,021,382 sites, while the remaining sites had 1 – 95,014 read(s) per site.
Missing data
Inconsistencies in the number of reads per sam-ple library, the number of sites/target per individual, and the number of reads per site/target can easily result in missing data. For example, Beissinger and colleagues [28] revealed that highly overrepresented sites (>500 reads per site), which comprised ~0.5% of the sequenced ApeKI sites in maize, accounted for 41.7% of the total reads. The authors predicted that the missing data would be 30%, 20%, or 10% of sites when sequencing produced 23, 41, or 80 million reads, respectively. Working on perennial ryegrass with
ApeKI digestion, Byrne and coworkers [38] were able to discover 643,798 SNPs with a minor allele fre-quency of ≥5%. However, only 80,902 (~12.5%) SNPs were successfully genotyped in 75% of individual samples at 5X coverage. Although over 270,000 SNPs were identified using GBS in an F1 population of
ap-ples (Malus x domestica) segregating for skin color, Gardner et al. [29] found that a high proportion of data for SNPs was missing across samples and there-fore could not be used for genetic mapping. Out of the 85 million DNA sequence reads produced in that study, only 6% could be used to generate a linkage map with 3,967 SNPs in the species. In addition, markers were not evenly distributed along each chromosome. For example, the physical distance be-tween “adjacent” markers exceeded 15 Mb in some cases [29]. Using outbred male Sprague-Dawley (SD) rats, GBS analysis only revealed a total of 2,256 high confidence SNPs with a minor allele frequency of larger than 0.2 [39]. Such a number of SNPs seems too few to pursue any GWAS analysis.
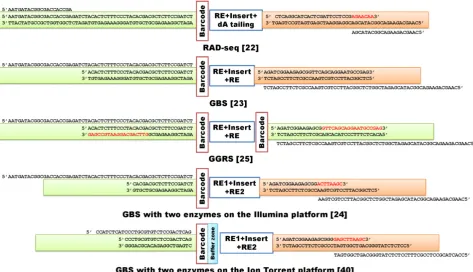
Figure 2. Examples of GWSS NGS library construction methods used to discover genome-wide representative variants, mainly SNPs, among individuals.
RE indicates the use of a single restriction enzyme in the assay, while RE1 and RE2 indicate the use of two enzymes for digestion of genomic DNA. The buffer zone contains additional nucleotides to tighten the restriction site ligation. The first four examples are designed for assessment with Illumina analyzers, while the last example is a library built to meet Ion Torrent platform requirements.
Suggestions for future GWSS
develop-ment
Improvement of library construction process
Preparation of a GWSS library is relatively sim-ple, but the process needs to be further optimized in order to radically address the challenges discussed above. First, we may need to prepare a library for each individual rather than a library for pooled samples. Such a “one sample-one library” approach will enable quantification of each library before sequencing so that equal amounts of libraries are sequenced and yield a similar number of total reads, thus minimizing inconsistency in number of reads per sample. Second, we need to compare efficiencies of primers designed with different binding positions that control the number of sites amplified. Currently, there are three types of primers used in final amplification of libraries for sequencing. These primers bind to 1) attachment sites (flowcell binding regions) alone (e.g., RAD-seq [22]) (Figure 2), 2) attachment sites + sequencing read sites (e.g., GBS [23]) (Figure 2), and 3) attachment sites + sequencing read sites + 3’ restriction sites + exten-sion of 1 or 2 bases into the insert fragments [34]. Theoretically, this last set of primers is more specific and should amplify only the targeted sites; however, in reality this may not be true and further
investiga-tion is warranted. Third, the Y-adapter design and the subsequent primers for amplification should be well matched. As illustrated in Figure 2, Chen and col-leagues [25] used a universal adapter as well as a re-verse primer to initiate synthesis. Notably, both for-ward and reverse primers can initiate the first round of amplification, as they share 14 identical nucleotides at their 3’ ends. Lastly, size selection of products for sequencing is also important. Gel separation and subsequent retrieval of products may contribute to variation in the number of sites involved in reduced genome complexity sequencing. Gel-free size selec-tion with beads should reduce site variaselec-tion. On the other hand, reducing uneven coverage of reads per site remains one of the most challenging issues in the construction of reduced genome complexity libraries [28].
Improvement of genotype calling accuracy
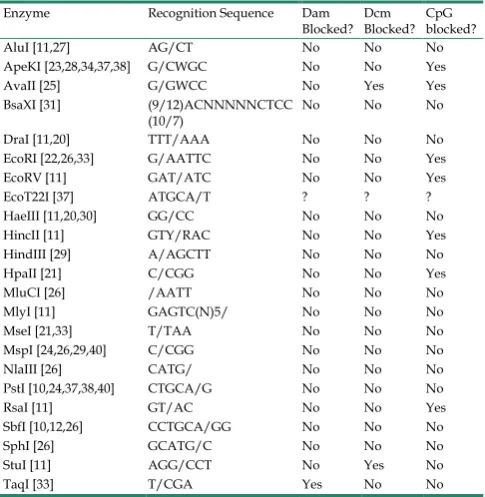
DraI, HaeIII, HindIII, MluCI, MlyI, MseI, MspI, NlaIII,
PstI, SbfI and SphI are resistant to Dam (methylated by the dam methylase), Dcm (methylated by the dcm methylase) and CpG (methylated by the CpG methylase) blocks, digestion with these enzymes will not produce epigenetic polymorphisms. However, the remaining ten enzymes shown in Table 1 may pro-duce genetic, epigenetic or both types of polymor-phisms depending on nucleotide mutations and the methylation status of recognition sequences. Never-theless, genetic and epigenetic markers associated with recognition sites can jeopardize genotype calling accuracy in individuals because they are dominant markers, rather than the co-dominant markers. As such, only homozygotes and heterozygotes with one allele that contain an enzyme cut site or that lack methylation blocks can be digested, ligated, ampli-fied, sequenced, and scored. Therefore, GWSS meth-ods need to use enzymes with recognition sequences that are rarely mutated in the genome and that are insensitive/resistant to Dam, Dcm, and CpG blocks, thus producing millions of NGS reads that can be used to maximize the discovery of co-dominant markers for linkage mapping or genome wide associ-ation studies. In order to be most effective, these en-zymes must also produce an even distribution of fragment sizes and cannot generate any concentrated bands after DNA digestion.
Improvement of marker density
As listed in Table 1, four-, five- or six-cutter en-zymes have been mainly used in library preparation. Yield estimates determined by in silico digestion of the soybean genome (1.1 – 1.5 Gb in length) were up to 9.5 million fragments for MseI (four-cutter), 800 K frag-ments for ApeKI (five-cutter) and 100 K fragments for
PstI (six-cutter), respectively [34]. These numbers clearly show that five-cutter enzymes provide a rea-sonable number of cut sites (i.e., roughly one site per kb of sequence). When five- or six-cutter enzymes are used; however, the average fragment size is still too large to fit into NGS platforms. Therefore, the first adapter-ligated products are often randomly sheared, size-selected and then ligated with the second adapter to yield constructs that contain flowcell binding re-gions, sequencing primer binding sites, and barcodes for library separation. Obviously, these steps add complexity to library preparation. Six-cutter enzymes are often combined with four-cutter enzymes. When only two-enzyme digested products are targeted, the six-four cutter enzyme combination probably doesn’t add many more sites to the library pool as compared to six-cutter digestion enzyme alone. Nevertheless, missing sites (over 70% sites with zero reads, see Beissinger et al. [28]) and missing genotypes (marker
gaps up to 15 Mb in length, see Gardner et al. [29]) indicate that marker density needs to be improved. The use of four-cutter enzymes in library preparation may be the answer to this problem. In this case, size selection will play an important role in the reduction of genome representation. In particular, in silico di-gestion should be performed, followed by selection of products of appropriate sizes that evenly distributed along each chromosome with reasonable distances between any adjunct sites.
Table 1. Restriction enzymes frequently used in the construction of GWSS libraries.
Enzyme Recognition Sequence Dam
Blocked? Dcm Blocked? CpG blocked? AluI [11,27] AG/CT No No No ApeKI [23,28,34,37,38] G/CWGC No No Yes AvaII [25] G/GWCC No Yes Yes BsaXI [31] (9/12)ACNNNNNCTCC
(10/7) No No No DraI [11,20] TTT/AAA No No No EcoRI [22,26,33] G/AATTC No No Yes EcoRV [11] GAT/ATC No No Yes EcoT22I [37] ATGCA/T ? ? ? HaeIII [11,20,30] GG/CC No No No HincII [11] GTY/RAC No No Yes HindIII [29] A/AGCTT No No No HpaII [21] C/CGG No No Yes MluCI [26] /AATT No No No MlyI [11] GAGTC(N)5/ No No No MseI [21,33] T/TAA No No No MspI [24,26,29,40] C/CGG No No No NlaIII [26] CATG/ No No No PstI [10,24,37,38,40] CTGCA/G No No No RsaI [11] GT/AC No No Yes SbfI [10,12,26] CCTGCA/GG No No No SphI [26] GCATG/C No No No StuI [11] AGG/CCT No Yes No TaqI [33] T/CGA Yes No No Source: Reprinted from www.neb.com (2015) with permission from New England Biolabs.
Improvement of read mapping rate
this strategy can be integrated in the construction of GWSS libraries needs to be tested.
In brief, we continue to face challenges in mak-ing NGS-based GWSS libraries, even though the pro-cedure is relatively simple. The library construction process can certainly be improved if we redesign adapters and primers, reconsider selection of re-striction enzymes and optimize PCR conditions. The ultimate goal is to amplify a unique set of targets with dense distribution and even coverage across all indi-vidual samples.
Supplementary Material
Supplementary Tables.
http://www.ijbs.com/v12p0100s1.xlsx
Competing Interests
The authors have declared that no competing interest exists.
Acknowledgements
This work was supported by the Eunice Kenne-dy Shriver National Institute of Child Health & Hu-man Development of the National Institutes of Health under Award Number R21HD076845 to ZJ. The con-tent is solely the responsibility of the authors and does not necessarily represent the official views of the Na-tional Institutes of Health. This work was also sup-ported in part by funds provided for medical and biological research by the State of Washington Initia-tive Measure No. 171. Mr. Hongyang Wang’s training at Washington State University was also supported by the Major International Cooperation NSFC (31210103917) (http://www.nsfc.gov.cn/) to BL. Dr. Zhihua Jiang serves as a guest professor in the Key Laboratory of Agricultural Animal Genetics, Breeding and Reproduction of Ministry of Education and the Cooperative Innovation Center for Sustainable Pig Production, Huazhong Agricultural University, Wu-han, China.
References
1. Brookes AJ. The essence of SNPs. Gene. 1999;234:177-186.
2. Kennedy GC, Matsuzaki H, Dong S, Liu WM, Huang J, Liu G, Su X, Cao M, Chen W, Zhang J, Liu W, Yang G, Di X, Ryder T, He Z, Surti U, Phillips MS, Boyce-Jacino MT, Fodor SP, Jones KW. Large-scale genotyping of complex DNA. Nat Biotechnol. 2003;2:1233-1237.
3. Matsuzaki H, Dong S, Loi H, Di X, Liu G, Hubbell E, Law J, Berntsen T, Chadha M, Hui H, Yang G, Kennedy GC, Webster TA, Cawley S, Walsh PS, Jones KW, Fodor SP, Mei R. Genotyping over 100,000 SNPs on a pair of oli-gonucleotide arrays. Nat Methods. 2004;1:109-111.
4. Steemers FJ, Gunderson KL. Whole genome genotyping technologies on the BeadArray platform. Biotechnol J. 2007 Jan;2(1):41-9.
5. LaFramboise T. Single nucleotide polymorphism arrays: a decade of biologi-cal, computational and technological advances. Nucleic Acids Res. 2009;37:4181-4193.
6. Zhang L, Mousel MR, Wu X, Michal JJ, Zhou X, Ding B, Dodson MV, El-Halawany NK, Lewis GS, Jiang Z. Genome-wide genetic diversity and dif-ferentially selected regions among Suffolk, Rambouillet, Columbia, Polypay, and Targhee sheep. PLoS One. 2013;8:e65942.
7. Zhang L, Zhou X, Michal JJ, Ding B, Li R, Jiang Z. Genome wide screening of candidate genes for improving piglet birth weight using high and low esti-mated breeding value populations. Int J Biol Sci. 2014;10:236-44.
8. Jiang Z, Rokhsar DS, Harland RM. Old can be new again: HAPPY whole genome sequencing, mapping and assembly. Int J Biol Sci 2009;5(4):298-303. 9. Jiang Z, Zhou X, Li R, Michal JJ, Zhang S, Dodson MV, Zhang Z, Harland RM.
Whole transcriptome analysis with sequencing: methods, challenges and po-tential solutions. Cell Mol Life Sci. 2015;72(18):3425-3439.
10. Deschamps S, Llaca V, May GD. Genotyping-by-Sequencing in Plants. Biology (Basel) 2012;1(3):460-483.
11. Heffelfinger C, Fragoso CA, Moreno MA, Overton JD, Mottinger JP, Zhao H, Tohme J, Dellaporta SL. Flexible and scalable genotyping-by-sequencing strategies for population studies. BMC Genomics 2014;15:979.
12. Jiang Z, Michal JJ, Chen J, Daniels TF, Kunej T, Garcia MD, Gaskins CT, Bus-boom JR, Alexander LJ, Wright RW Jr, Macneil MD. Discovery of novel genetic networks associated with 19 economically important traits in beef cattle. Int J Biol Sci 2009;5(6):528-542.
13. Zhang L, Michal JJ, O'Fallon JV, Pan Z, Gaskins CT, Reeves JJ, Busboom JR, Zhou X, Ding B, Dodson MV, Jiang Z. Quantitative genomics of 30 complex phenotypes in Wagyu x Angus F₁ progeny. Int J Biol Sci 2012;8(6):838-858. 14. Davey JW, Hohenlohe PA, Etter PD, Boone JQ, Catchen JM, Blaxter ML.
Genome-wide genetic marker discovery and genotyping using next-generation sequencing. Nat Rev Genet. 2011;12(7):499-510.
15. Zou XL, Shi C, Austin RS, Merico D, Munholland S, Marsolais F, Navabi A, Crosby WL, Pauls KP, Yu KF, Cui YH. Genome-wide single nucleotide poly-morphism and insertion-deletion discovery through next-generation se-quencing of reduced representation libraries in common bean. Molecular Breeding. 2014;33:769-778.
16. Barchi L, Lanteri S, Portis E, Acquadro A, Valè G, Toppino L, Rotino GL. Identification of SNP and SSR markers in eggplant using RAD tag sequencing. BMC Genomics. 2011;12:304.
17. Kumar S, You FM, Cloutier S. Genome wide SNP discovery in flax through next generation sequencing of reduced representation libraries. BMC Ge-nomics. 2012;13:684.
18. Bovo S, Bertolini F, Schiavo G, Mazzoni G, Dall'Olio S, Fontanesi L. Reduced representation libraries from DNA pools analysed with next generation sem-iconductor based-sequencing to identify SNPs in extreme and divergent pigs for back fat thickness. Int J Genomics. 2015;2015:950737.
19. Altshuler D, Pollara VJ, Cowles CR, Van Etten WJ, Baldwin J, Linton L, Lander ES. An SNP map of the human genome generated by reduced representation shotgun sequencing. Nature. 2000;407(6803):513-516.
20. Van Tassell CP, Smith TP, Matukumalli LK, Taylor JF, Schnabel RD, Lawley CT, Haudenschild CD, Moore SS, Warren WC, Sonstegard TS. SNP discovery and allele frequency estimation by deep sequencing of reduced representation libraries. Nat Methods 2008;5(3):247-252.
21. van Orsouw NJ, Hogers RC, Janssen A, Yalcin F, Snoeijers S, Verstege E, Schneiders H, van der Poel H, van Oeveren J, Verstegen H, van Eijk MJ. Complexity reduction of polymorphic sequences (CRoPS): a novel approach for large-scale polymorphism discovery in complex genomes. PLoS One 2007;2(11):e1172.
22. Baird NA, Etter PD, Atwood TS, Currey MC, Shiver AL, Lewis ZA, Selker EU, Cresko WA, Johnson EA. Rapid SNP discovery and genetic mapping using sequenced RAD markers. PLoS One 2008;3(10):e3376.
23. Elshire RJ, Glaubitz JC, Sun Q, Poland JA, Kawamoto K, Buckler ES, Mitchell SE. A robust, simple genotyping-by-sequencing (GBS) approach for high di-versity species. PLoS One 2011;6(5):e19379.
24. Poland JA, Brown PJ, Sorrells ME, Jannink JL. Development of high-density genetic maps for barley and wheat using a novel two-enzyme genotyp-ing-by-sequencing approach. PLoS One 2012;7(2):e32253.
25. Chen Q, Ma Y, Yang Y, Chen Z, Liao R, Xie X, Wang Z, He P, Tu Y, Zhang X, Yang C, Yang H, Yu F, Zheng Y, Zhang Z, Wang Q, Pan Y. Genotyping by genome reducing and sequencing for outbred animals. PLoS One 2013;8(7):e67500.
26. Peterson BK, Weber JN, Kay EH, Fisher HS, Hoekstra HE. Double digest RADseq: an inexpensive method for de novo SNP discovery and genotyping in model and non-model species. PLoS One 2012;7(5):e37135.
27. Kerstens HH, Crooijmans RP, Dibbits BW, Vereijken A, Okimoto R, Groenen MA. Structural variation in the chicken genome identified by paired-end next-generation DNA sequencing of reduced representation libraries. BMC Genomics 2011;12:94.
28. Beissinger TM, Hirsch CN, Sekhon RS, Foerster JM, Johnson JM, Muttoni G, Vaillancourt B, Buell CR, Kaeppler SM, de Leon N. Marker density and read depth for genotyping populations using genotyping-by-sequencing. Genetics 2013;193(4):1073-1081
29. Gardner KM, Brown P, Cooke TF, Cann S, Costa F, Bustamante C, Velasco R, Troggio M, Myles S. Fast and cost-effective genetic mapping in apple using next-generation sequencing. G3 (Bethesda) 2014;4(9):1681-1687.
30. Greminger MP, Stölting KN, Nater A, Goossens B, Arora N, Bruggmann R, Patrignani A, Nussberger B, Sharma R, Kraus RH, Ambu LN, Singleton I, Chikhi L, van Schaik CP, Krützen M. Generation of SNP datasets for orangu-tan population genomics using improved reduced-representation sequencing and direct comparisons of SNP calling algorithms. BMC Genomics 2014;15:16. 31. Wang S, Meyer E, McKay JK, Matz MV. 2b-RAD: a simple and flexible method
32. Vos P, Hogers R, Bleeker M, Reijans M, van de Lee T, Hornes M, Frijters A, Pot J, Peleman J, Kuiper M, et al. AFLP: a new technique for DNA fingerprinting. Nucleic Acids Res 1995;23(21):4407-4414.
33. Truong HT, Ramos AM, Yalcin F, de Ruiter M, van der Poel HJ, Huvenaars KH, Hogers RC, van Enckevort LJ, Janssen A, van Orsouw NJ, van Eijk MJ. Sequence-based genotyping for marker discovery and co-dominant scoring in germplasm and populations. PLoS One 2012;7(5):e37565.
34. Sonah H, Bastien M, Iquira E, Tardivel A, Légaré G, Boyle B, Normandeau É, Laroche J, Larose S, Jean M, Belzile F. An improved genotyping by sequencing (GBS) approach offering increased versatility and efficiency of SNP discovery and genotyping. PLoS One 2013;8(1):e54603.
35. Hodges E, Xuan Z, Balija V, Kramer M, Molla MN, Smith SW, Middle CM, Rodesch MJ, Albert TJ, Hannon GJ, McCombie WR. Genome-wide in situ exon capture for selective resequencing. Nat Genet. 2007;39(12):1522-1527. 36. Ng SB, Buckingham KJ, Lee C, Bigham AW, Tabor HK, Dent KM, Huff CD,
Shannon PT, Jabs EW, Nickerson DA, Shendure J, Bamshad MJ. Exome se-quencing identifies the cause of a mendelian disorder. Nat Genet. 2010;42(1):30-35.
37. De Donato M, Peters SO, Mitchell SE, Hussain T, Imumorin IG. Genotyp-ing-by-sequencing (GBS): a novel, efficient and cost-effective genotyping method for cattle using next-generation sequencing. PLoS One 2013;8(5):e62137.
38. Byrne S, Czaban A, Studer B, Panitz F, Bendixen C, Asp T. Genome wide allele frequency fingerprints (GWAFFs) of populations via genotyping by sequenc-ing. PLoS One 2013;8(3):e57438.
39. Fitzpatrick CJ, Gopalakrishnan S, Cogan ES, Yager LM, Meyer PJ, Lovic V, Saunders BT, Parker CC, Gonzales NM, Aryee E, Flagel SB, Palmer AA, Rob-inson TE, Morrow JD. Variation in the form of Pavlovian conditioned ap-proach behavior among outbred male Sprague-Dawley rats from different vendors and colonies: sign-tracking vs. goal-tracking. PLoS One 2013;8(10):e75042.