Anomaly Detection and Localization by Diffusion
Wavelet-based Analysis on Traffic Matrix
Teng Sun, Hui Tian, and Xuan Mei
Dept. of Electronics and Information Engineering Beijing Jiaotong University
Beijing, China [email protected]
Abstract. Diffusion wavelets (DW) transform has been successfully used in Multi-Resolution Analysis (MRA) of traffic matrices because it inherently adapts to the structure of the underlying network. There are many potential applications based on DW analysis such as anomaly detection, routing optimization and capacity plan, which, however, have not been well developed. This paper shows how to apply two-dimensional DW transform in traffic matrix analysis and anomaly detection. The experimental results demonstrate the effectiveness of DW-based technique in traffic matrix analysis and anomaly detection in practical networks. It also shows this new technique is potential to be used in many other network applications.
Keywords: traffic matrices, diffusion wavelets, multi-resolution analysis, anomaly detection.
1.
Introduction
As development of computer technology, networks become more and more large and complex. As a result, management on networks becomes more and more difficult. Various problems, such as intrusion anomaly, links anomaly, are hard to be detected in networks. The knowledge of traffic matrix (TM) is very helpful for network managers to find out useful information from Internet data [1]. Here a TM denotes an overview of all end-to-end traffic flows. How to detect these anomalies from TMs efficiently has been a hot topic in recent years. Researchers are keen on developing good methods for TM analysis so as to find out efficient solutions to various tasks, such as network management and traffic engineering.
domain. As far as we know, none of them can perform an efficient analysis on complex traffic, especially in space domain.
In this paper, we conduct Multi-Resolution Analysis (MRA) on TMs by using Diffusion Wavelets Transform (DWT). MRA-based methods work well for sparse matrices where many elements are zero or very small compared to other elements. A TM is such a sparse matrix because there is no or little traffic flow between many end-to-end node pairs. Such sparse models may be characterized by a small number of coefficients,
M. In comparison with the number of elements in TM, N2, M is much smaller, that is, M
<<N2. Since M parameters describe the main characteristics of the original TM, it enables fast computation and efficient analysis on TMs.
The DW was firstly proposed in 2006 [9] and applied to TM analysis in networking fields in 2008 [11]. The DW-based technique can perform Multi-Resolution Analysis on TM and find out the main characteristics of such sparse models. It can adapt to analyze irregular topologies of the underlying networks. DW-based techniques can conduct TM analysis in both time domain and space domain. This guarantees the effectiveness of analysis on practical networks’ TMs. DW-based MRA can provide meaningful characteristic parameters in different scales, which includes only a small set of significant parameters. Analysis on these parameters may help to solve various problems: inference, synthesis, anomaly detection, traffic prediction [23] and so on.
2.
Related Work
Diffusion wavelet-based analysis is a sparsification technique which represents a TM as a sufficiently sparse signal in wavelet domain. The application of diffusion wavelets in TM analysis is similar to Compressed Sensing (CS) technique applied in many applications. Such sparsification technique shows that any sufficiently compressible signal can be accurately recovered from a small number of non-adaptive, randomized linear projection samples [18]. Mark Coates et al. [19] applied Compressed Sensing in estimation of network performance metrics. They address the problem of inferring end-to-end performance metrics such as end-to-end delays in an IP network or bit-error rates in an all-optical network from observations on a selected set of paths. However, they didn’t apply this technique in anomaly detection.
propose an efficient method to detect the anomaly and find its possible location based on these significant parameters.
Principal Components Analysis (PCA) is applied to anomaly detection and localization in [20, 21]. PCA is combined with source data similarity or similarity among nodes to detect and localize anomaly in networks. We will compare DW-based analysis and localization results with the results by these PCA-based techniques.
In order to analyze TMs by DW-based MRA methods effectively, selecting an appropriate DW operator is critical. In [6], DW-based analysis results and anomaly detection results by two different diffusion operators are compared. But both work in [6] and [11] didn’t study anomaly localization. To the best of our knowledge, it is very new to perform anomaly localization based on DW analysis results. We conduct TM analysis in space domain efficiently and localize the anomaly for two cases, node disconnection and Distributed Denial of Service (DDoS).
The paper is organized as follows. In Section 2, we introduce the background. In Section 3, we describe a method to diagnose anomalies by analyzing the diffusion wavelets coefficients. In Section 4, an approach to distinguish different anomalous situations is proposed. In Section5, we develop an anomaly localization method and compare localization results with existing results. Section6 concludes the paper.
3.
Diffusion Wavelets-based Analysis
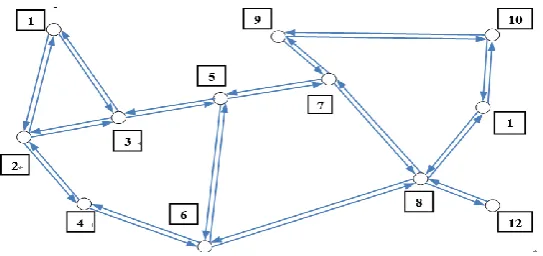
A backbone network consists of many nodes connected by links. These nodes are also called Points of Presence (PoPs). Fig.1 shows the backbone network of America, Abilene, where each node represents a state. An Origin-Destination (OD) flow is defined as a traffic matrix component. It describes the volumes of traffic Ti,j for every ingress point i into the network and every egress point j out of the network, over a given time interval. The path followed by each OD flow is described by the routing matrix, the traffic observed on each backbone link arises from the superposition of these OD flows. We use the term volume anomaly to refer to a sudden change in an OD flow’s traffic which reflects Ti,j has a positive or negative change [10].
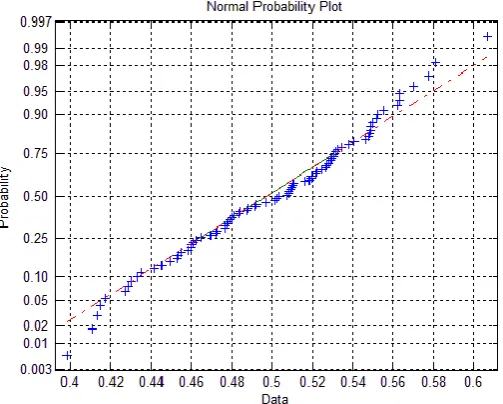
Since the Abilene Network has 12 nodes, its TM is 12 by 12 dimensions. It’s difficult to directly monitor every Ti,j of TM to diagnose if the network is normal or abnormal. Existing studies show that the traffic distribution is long-related in a given period of time for a stable network, especially a backbone network. We study the traffic distribution as Fig.2 shows. If the data follow normal distribution the plot should be linear. Fig. 2 shows that all data lie on or near the red line, so the data can be approximated by a normal distribution. This forms the basis of our proposed analysis method.
Fig. 2. Distribution of Normal probability
According to David Rincón’s study in [11], 15% of the DW coefficients retain more than 90% of the original TM energy on average. Thus we can characterize the original TM by a limited number of coefficients which may be regarded as the most significant parameters.
Traffic matrices can be represented as two dimensional functionsF(i,j). 2D DW
transform is to project the functionF(i,j) twice onto the approximation and detail subspace bases by using 1D DW diffusion operator, once along each “direction”. We denote VVj, to be the transform coefficients corresponding to the low-pass approximation
subspace and VWj, WVj and WWj the transform coefficients of the high-frequency detail
subspaces respectively. Here V denotes the approximation and W the detail in 1-dimension DW transform. The coefficients are contained by Equation (1)
vCTree{lIndex}(vv).Coeffs=cWtTree{lIndex}(v).Basis’ * vCTree{lIndex-1}(vv).Coeffs * cWTree{lIndex}(v).Basis,
lIndex = lLevel+1
(1)
lLevelis the wavelet decomposition level, like the scalein Wavelets Transform. Since the
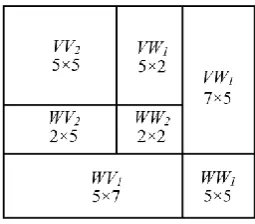
increased as Fig.4 shows, it presents a simple illustrative example on a 12 nodes matrix. The 1D DW transform decomposes the spectrum in 3 subbands with 5, 2 and 5 eigenvalues for theW1, W2 and V2subbands respectively, while 2D DW divides the
spectrum into the approximation VV2andthe details VW2, WV2, WW2, VW1, WV1, WW1,
where each one includes a set of n × m eigenvalues/eigenvectors. We focus on the approximation coefficients VVj [12, 13].
Fig. 3. 1D diffusion wavelet transform decomposition of TM
Fig. 4. 2D diffusion wavelet transform decomposition of TM
4.
Anomaly detection
Network traffic anomaly refers to the flow of network deviating from the normal behavior caused by a variety of reasons, such as network equipment breakdown, failed network operation, flash crowd, network intrusion, etc. The network may experience very hard period due to the characteristics of anomaly such as sudden-burst, unpredictability and so on. Therefore it is very important to ensure the network to work properly by detecting the anomaly effectively and responding appropriately. At present, network anomalies are divided into two main categories: nodes disconnected to the network and malicious abnormal behavior, such as Distributed Denial of Service (DDoS) [14, 15].We focus on these two categories and study how to detect anomaly.
In our first experiment on detecting anomaly caused by nodes disconnected to the network, we apply two-dimensional DW analysis on 84 TM samples from datasets of Abilene Network. The granularity of the TMs is 5 minutes in Abilene as used in [11].
We consider four largest coefficients T(1,1),T(2,1),T(2,2),T(2,3), from the 5-th level
approximation matrix to be significant parameters because their changes are apparent when the network experiences any anomaly situation. For convenience, we denote them byV1, V2, V3 and V4.We define Contribution Ratio to be Ri, which means the ratio of the
7
2 2
1
/
i i j
j
R
V
(2)j
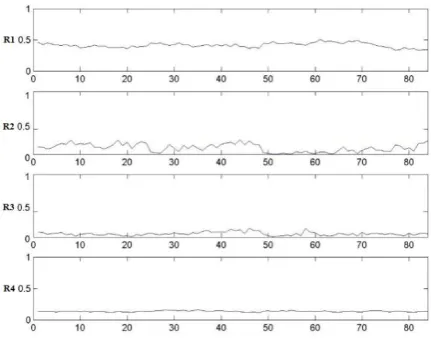
is the eigenvalue of T.It is found that the averages of R1, R2,R3and R4 are 0.4132, 0.0062, 0.0029 and 0.1355
with variance of R1, R2,R3 and R4 are 6.9 ×10 -4
, 6.7×10⁻⁶, 1.13 ×10⁻⁶ and 1.01 ×10⁴, so they tend to be smooth in the normal cases as Fig.5 shows.
Fig. 5. Contribution Ratio in normal cases (9:30 - 10:00 from 2nd to 8th Mar. 2004, 84 samples in total)
It is found that the ratios changes when node 1 is disconnected at the 40th moment as Fig.6 shows. R2 increases 3 times than average of normal case while R3 increases 5 times
than average of normal case at this moment compared with Fig. 5
When node 9 is disconnected at the 40th moment as Fig. 7 shows, the ratio R1
decreases 0.6 times than average of normal case while R4 decreases 0.8 times than
average of normal case at this moment compared with Fig. 5
Fig. 7. Node 9 disconnected at the 40th moment
When other single-node experiences abnormal situation, one or more parameters among R1-R4would change abruptly at abnormal moments. Similar to above figures,
these abnormal situation could be detected.
5.
Anomaly Localization for Disconnection
As described above, we can detect anomaly successfully through monitoring Ri, we
cannot distinguish which node is disconnected. Since the data follow the normal distribution as discussed in Fig. 2, we know the most data are within a very limited range. We use this property to distinguish different “Anomaly Categories”.
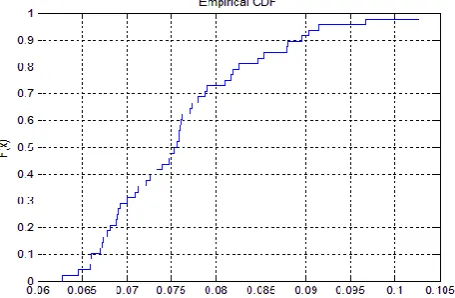
Firstly we study the distributions of the four ratios when different nodes are disconnected. For example, we let all T(1, j) and T(i, 1) from TM of all samples be zeros with the assumption of node 1 being disconnected, where i, j are from 1 to 12. Fig.8 shows the cumulative distribution function (CDF) of R1. According to the result in Fig.2,
we can get the distribution of R1. We then calculate a range within which covers 95% of
samples and call this range 95% probability range. Depending on different ranges for the four ratios R1-R4 calculated as above, we can infer which node is disconnected with high
accuracy. Finally, we collect all the circumstances in Table 1 named “Anomaly Dictionary” for judgment.
Fig. 9. Normal distributions and 95% probability interval
In Table 1, node 0 represents the normal state and node 1 to 12 represent circumstances where node i is disconnected respectively. The ranges in this table show 95% probability ranges ofR1, R2, R3 and R4.
When we get four ratios of samples, we first figure out if the values of all ratios are within statistically normal range listed as above. If not, it means the sample may be abnormal. We then compare the values of 4 ratios to the following rows which show statistic abnormal ranges in Table 1. It is found that the single-node disconnection can be determined uniquely by comparing their ratios to these statistical abnormal ranges.
Figure 10 describes one example where node 11 is disconnected at the 15th moment. The values of R1-R4 are given in Table2. Compared with Fig.5, we can find there is an
anomaly at the 15th moment when R2 and R3 increase sharply. What’s more, we can
determine which node is disconnected by statistic results given in Table1. Four ratios’ values in Table 2 are within ranges in 11th row which indicates node 11 is disconnected.
Fig. 10. Node 11 Disconnected at 15th moment.
Table 2. Ratios
Based on this comparison, we can detect and distinguish anomaly successfully. Since we get the 95% probability ranges of R1, R2, R3and R4,the accuracy rate of single-node
anomalyis not 100%. If a normal sample is determined to be normal, we regard the case as true positive (TP). If a normal sample is determined to be abnormal, we regard the case as false negative (FN). If an abnormal sample is determined to be abnormal, we call this to be true negative (TN). If an abnormal sample is determined to be normal, we call this to be false positive (FP). Thus the accuracy rate should be calculated by Equation (3).
It is obtained that the accuracy ratio can be 89.78% theoretically since we are use the 95% range to localize single-node disconnection. This rate though not 100%, has been a breakthrough result in anomaly localization. We may also choose 98% probability range to get a higher accuracy rate. However, this introduces more complicated overlapped cases for coefficients and thus increases computational complexity.
To compare with existing anomaly localization skills in [20, 21, 22], we conduct experiments on our data sets. Authors in [21] obtained their FP and FN ratios were less than 20%, while the ratio of our false judgment (including FP and FN) is 18.55% theoretically. In experiments, we obtain the false judgment ratio of 15.21%. This means we can guarantee a higher accuracy ratio. Anomaly localization based on PCA was discussed in [20]. They tried to figure out which source among 8 sources exists anomaly by combing pair-wise correlation between any two sources in Graph Guided Joint Sparse PCA. When applying this method to our data sets, the accuracy ratio is only less than 50%. The reason is our data sets are not pair-wise correlated as stocks data sets they used.
Therefore, our method outperforms these existing methods in anomaly localization for large-scale backbone networks. However, same as existing work, localization is still limited to single-node or single-link. It is very challenging to extend our work to multi-node anomaly localization. It’s also demanding to localize more complicated anomaly cases, such as Distributed Denial of Service (DDoS).
6.
Anomaly Localization for DDoS
We have obtained the ranges of 4 ratios in normal and abnormal cases. These ranges, though implying location information of single-node disconnection, are overlapped with each other. In order to locate anomaly nodes accurately and fast, we study the numerical relationship between abnormal cases and normal cases, and propose a Huffman Coding-based method [16].
It has been found abnormal cases’ ranges are different from normal cases’ in above experiments. We define abnormal ratios Mi in Equation (3).
'
, 1
, 1, 2,3, 4; 1, 2,3,..., ; 84 1 i i n i j j R
M i j n n
R
n
(4)
To calculate the abnormal ratios Mi, we use the parameter Ri andRi' to describe
Contribution Ratio in normal and abnormal cases respectively.
7 2 j 1
7 2 i,j i 1 1
'
, 1, 2,..., 7; 1, 2,..., ; 84
1 n
j n
j
P j i n n
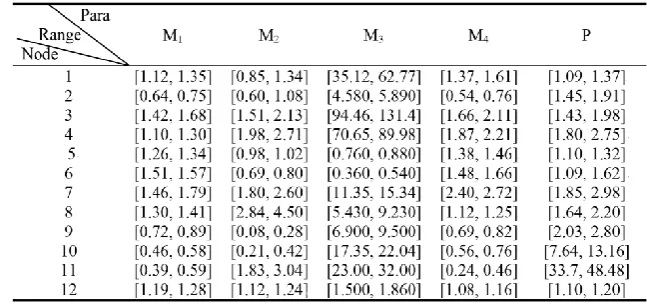
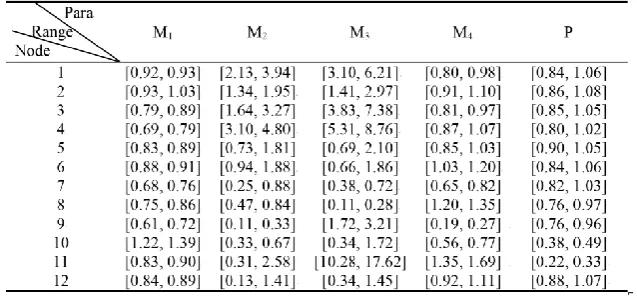
(5)As proposed in Section 4, we now study the ranges of Mi, the results when DDoS happens are given in Table 3, and results of nodes when single-node disconnection happens in network are given in Table 4.
Table 3. Ranges of Mi and P in DDoS case
Table 4.Ranges of Mi and P of in single-node disconnection case
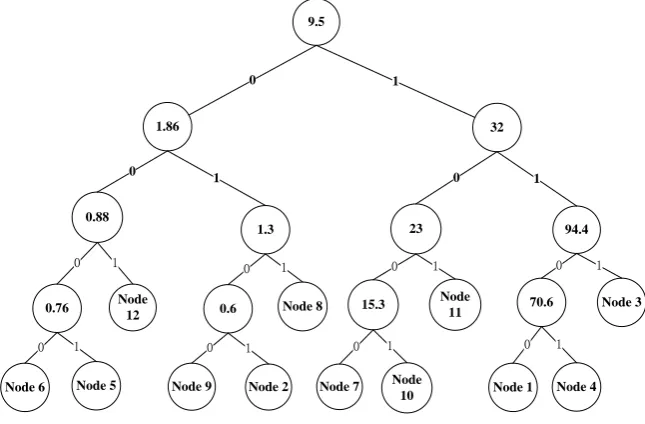
According to Table 3, we can distinguish most circumstance of DDoS: node 1, 3, 4, 5, 6, 7, 10, 11 and 12 only by M3, while other circumstance: node 2, 8 and 9 can be distinguished by M1 combined with M3. We propose a Huffman Coding method to
obvious that different anomaly locations in two categories of abnormal cases, single-node disconnection and DDoS, can be represented by binary codes uniquely.
9.5
32 1
1.86
0
0.88
1.3
0.6 15.3
94.4 23
Node 9
Node 8
0 1 0
1
Node 11
0 1
Node 10 Node 7
1 0 1
0
0
Node 2
1
0.76 Node 12
Node 6 Node 5
0 1
0 1
Node 3
1
70.6
Node 1 Node 4
0 1
0
Fig. 11. Huffman Coding Tree
In Fig.11, the numbers in the circle represents thresholds, which are obtained from Table 3. Once we have calculated a Mi, we find its corresponding code by this coding tree. It will finally locates where the anomaly happens and what kind of anomaly it is.
Table 5. Binary Code
7.
Conclusion
In this paper, we showed that DW-based techniques can perform an effective multi-resolution analysis for traffic matrices. Based on the study of analysis results, we presented a novel method on anomaly detection and localization. This method can not only detect whether the anomaly is caused by single node disconnection or DDoS, but also localize the anomaly. To our knowledge, it is the first piece of work that applies DW-based analysis results to localize anomaly. In the future, we will extend this method to detect more complicated network problems, such as anomalies caused by multiple-node disconnections and traffic prediction. Study on important coefficients from DW transform can also be used to develop applications in traffic prediction, network optimization and so on.
Acknowledgment. This work was done under the support of National Natural Science Foundation of China No. 61100218 and General Projects funding No. 61170232, the Fundamental Research Funds for the Central Universities No. 2011JBM206.
References
1. Rahman, M. M., Saha, S., Chengan, U.: IP Traffic Matrix Estimation Methods: Comparisons and Improvements, IEEE International Conference on Communications, 90 - 96. (2006) 2. Li, S., Xu, L. D., Wang, X: Compressed Sensing Signal and Data Acquisition in Wireless
Sensor Networks and Internet of Things, IEEE Transactions on Industrial Informatics, Vol.9, No. 4, 2177-2186. (2013)
3. Cattaneo, A., Park, G., Farrar, C., et al.: The application of compressed sensing to long-term acoustic emission-based structural health monitoring, Proc. of SPIE Smart Structures and Materials, Nondestructive Evaluation and Health Monitoring, International Society for Optics and Photonics. (2012)
4. Ren, H. P., Li, J. P.: Bayes Estimation of Traffic Intensity in M/M/1 Queue under a New Wei ghted Square Error Loss Function. Advanced Materials Research, Vol. 485, 490-493. (2012) 5. Tian, H., Sang, Y., Shen, H.: New Methods for Network Traffic Matrix Estimation Based on a
Probability Model. Proc. of IEEE ICON, 270-274. (2011)
6. Tian, H., Zhong, B., Shen, H.: Diffusion wavelet-based analysis on traffic matrices by different diffusion operators. Computers & Electrical Engineering, Vol.40, No. 6, 1874-1882. (2014)
7. Agrawal, S.: Diagnosing Link-Level Anomalies Using Passive Probes, IEEE International Conference on Computer Communications, 1757-1765. (2007)
8. Barford, P., Duffield, N., Ron, A. et al.: Network Performance Anomaly Detection and Localization. Proc. of INFOCOM, 1377-1385. (2009)
9. Coifman, R. R., Maggioni, M: Diffusion Wavelets, Applied and Computational Harmonic Analysis, Vol. 21, No. 1, 53-94. (2006)
10. Qian, Y., Chen, M., Hao, Q.: ODC: a method for online detecting & classifying network-wide traffic anomalies, Journal on Communications,134-141, (2011).
11. Willinger, W., Rincón, D., Roughan, M: Towards A Meaningful MRA Of Traffic Matrices, IMC Proceedings of ACM Sigcomm Conference on Internet Measurement, 331-336. (2008)
13. Hammond, D. K., Vandergheynst, P., Gribonval, R.: Wavelets on graphs via spectral graph theory. Applied and Computational Harmonic Analysis, Vol. 30, No. 2, 129–150. (2009) 14. Wang, C., Mahadevan, S.: Multiscale Dimensionality Reduction Based on Diffusion Wavelet
s, Technical Report, University of Massachusetts, Department of Computer Science. (2009) 15. Beitollahi, H., Deconinck, G.: Connection Score: a statistical technique to resist
application-layer DDoS attacks, Journal of Ambient Intelligence and Humanized Computing, Vol. 5, No. 3, 425-442. (2014)
16. Zargar, S. T., Joshi, J., Tipper, D.: A Survey of Defense Mechanisms against Distributed Denial of Service (DDoS) Flooding Attacks, Communications Surveys & Tutorials, Vol. 15, No. 4, 2046-2069. (2013)
17. Soto Hernandez, M. A., Alvarado-Nava, O., Rodriguez-Martinez, E., et al.: Tree-less Huffman coding algorithm for embedded systems, International Conference on Reconfigurable Computing and FPGAs (ReConFig), 1-6. (2013)
18. Haupt, J., Bajwa, W. U., Rabbat, M., Nowak, R.: Compressed sensing for Network Data. ( 2007)
19. Coates, M., Pointurier, Y., Rabbat, M.: Compressed network monitoring for IP and all-optical networks, In ACM SIGCOMM Internet Measurement Conference (IMC), 241-252. (2007) 20. Ruoyi, J., Fei, H., Huan, J.: Anomaly localization for network data streams with graph joint
sparse PCA, Proceedings of the 17th ACM SIGKDD international conference on Knowledge discovery and data mining ACM, 886-894. (2011)
21. Ziming, Z., Li, Y. Lan, Z.: Anomaly localization in large-scale clusters , IEEE International Conference on Cluster Computing, 322-330. (2007)
22. Salhi, E., Lahoud, S., Cousin, B.: Localization of single link-level network anomalies. International Conference on Computer Communications & Networks, Vol. 7204, No. 4, 1291-1294. (2012)
23. Yu, Y., Song, M., Fu, Y., Song, J.: Traffic prediction in 3G mobile networks based on multifractal exploration, Tsinghua Science and Technology, Vol. 18, No. 4, ,398-405. (2013)
Teng Sun received B.E. degree from Shangdong University and M.E. from Beijing Jiaotong University, China. His main research interests are network performance analysis.
Hui Tian, Associate Professor in School of Electronics and Information Engineering, Beijing Jiaotong University. She received B. Eng. and M. Eng. degrees from Xidian University, China and Ph.D. from Japan Advanced Institute of Science and Technology. Her research interests include network performance evaluation, telecommunications and wireless sensor networks. Hui Tian is the corresponding author of this paper.
Xuan Mei received B.E. degree from Neijiang Normal University. He is currently a master student in Beijing Jiaotong University, China. His main research interests are network performance analysis.