INTRODUCTION
Fish, an important source of animal protein, is in increasing demand in Nigeria1. This increase in demand is due to a number of factors such as high population growth rate2, increasing national income and increasing cost of meat and other sources of animal protein. Currently, about 40% of animal protein consumed in the country is derived from fish3. The relatively high per caput consumption of fish has been attributed to greater availability of this product at relatively cheaper prices4. The total demand for fish in Nigeria was estimated at 0.940, 1150 and 1450 million tonnes respectively in 1975, 1980 and 19855.
The mineral elements present in the body of tropical freshwater fishes have been little investigated. Some reported investigations included
Biosciences, Biotechnology Research Asia Vol. 5(1),125-134 (2008)
those of Odukoya and Ajayi6,7, Olaleye and Akintunde8, Ipinmoroti and Oshodi9 and Adeyeye10. Some of these minerals might be involved in haematopoiesis while others might be involved in regulation of metabolic processes.
In tropical African waters, fishes of the Tilapia group are usually the most important in abundance and commercial value1. Oreochromis niloticus is an important member of this group which figure prominently in the fisheries of Nigeria. The impor tance of this fish warrants some biochemical studies.
In the present study, an attempt was made to determine some mineral elements in the fish parts (scales, gills, intestine, eyes, head and trunk muscle) of two different sized Oreochromis niloticus in a freshwater fish pond. Such attributes as flavour,
The likely influence of size in the distribution and
concentration of some metals in the organs of
Oreochromis niloticus (l.) fish in a freshwaer pond
E.I. ADEYEYE¹ and M.K.O. ARIFALO²
¹Department of Chemistry, University of Ado-Ekiti, P.M.B. 5363, Ado-Ekiti (Nigeria). ²Department of Chemistry, College of Education, P.M.B. 250, Ikere-Ekiti (Nigeria).
(Received: February 03, 2008; Accepted: April 27, 2008)
ABSTRACT
Levels of cobalt, zinc, lead, manganese, copper, iron, sodium and potassium were determined by means of atomic absorption spectrophotometer in the fish organs (scales, gills, intestine, eyes, head and trunk muscle) of two different sized Oreochromis niloticus (L.) in a freshwater pond. Cobalt and copper were not detected in both the fish organs, stock water and associated sediments. Lead was not detected in water, sediments and smaller sized fish (SSF) but was found accumulated in some organs of the bigger sized fish (BSF). Metals most concentrated in the SSF were manganese and sodium while those most concentrated in the BSF were zinc, lead, iron and potassium. However, for all the metals detected, the BSF trunk muscle had the overall highest concentration but the lead level was below the deleterious level. Significant differences occurred in the sizes of the SSF and BSF; and also in the metal concentrations in the scales, gills, intestine, eyes, head, and trunk muscles of the two different sized fish at p < 0.05.
odour, texture and even the appearances which govern the desirability of fish muscle as food are related directly or indirectly to the mineral composition8.
MATERIAL AND METHODS Sampling
Samples were taken from one artificial pond located at the Ondo State Government Hatchery Centre, Alagbaka, Akure. Grass was planted around the pond to prevent erosion and inwash of muddy water.
Grab water samples were taken just below the water surface in the fish pond using a one-litre acid-leached polythene bottle. This water was stored under deep freezing at-18°C. An auger was used to take soil sediment samples from the surface down to a depth of about 15cm at various locations. These were stored in polythene bags and kept in the deep freezer pending analysis. Two pieces of fresh fish (Oreochromis niloticus) of different sizes (two samples of small size and big size each) were caught from the pond with the assistance of the pond attendant. Each fish was briefly washed with distilled de-ionised water to remove any adhering contamination and then drained under folds of filter paper. Fish from the pond was identified, weighed, wrapped in aluminium foil and deep-frozen at-18°C.
Sample treatment
Temperature was measured with a simple thermometer demarcated in oC and the pH of water determined with a pH meter (Kent EIL 7020, Kent Industrial Measurement Ltd., UK) before the water was stored at-18°C.
5cm3 of concentrated hydrochloric acid was added to 250cm3 of water samples and evaporated to 25cm3. The concentrate was transferred to a 50cm3 flask and diluted to the mark with distilled de-ionised water12.
After air-drying, the soil sediments were sieved using 200mm mesh. 5g of the soil sediments were put into a 150cm3 conical flask. 50cm3 of 0.1M HCl was added and the flask was agitated on an
orbital flask shaker (Gallenkamp) for two hours at 200 rev/min. The contents were filtered into 50cm3 standard flask and made up to mark with 0.1M HCl. This extraction was used to determine heavy metals. 5g of soil sediments were put into another series of 150cm3 conical flasks. Three extractions using 30cm3 ammonium acetate solution each were carried out. The contents were filtered into a 100cm3 standrd flask and made up to the mark13. The extraction here was used to determine the sodium and potassium in the soil samples.
The fish samples were given about two hours of defrosting before processing for analysis. After defrosting, the scales were removed, rinsed with de-ionised water and each fish separated into the head, eyes, gills, intestine, trunk muscle and scales. Different fish parts were dried at 105°C, blended and samples ranging from 0.8728g to 1.1577g were accurately weighed from digestion. The weighed fish samples were put in crucibles and ashed for three hours at a temperature of 540°C in the furnace (NEY.M – 525). The crucibles were then cooled to room temperature in a dessicator. Each ash sample was transferred to 50cm3 beaker, crucible washed with 25cm3 of 10% (v/v) nitric acid solution and then added to the ash sample in breaker and heated to boiling to break the ash. Each solution was carefully filtered into a 50cm3 standard flask and made up to mark with distilled deionised water14,15.
Based on the whole fish samples, they were labelled as bigger sized fish (BSF) and smaller sized fish (SSF).
All data generated were analysed statiscally17. From the average values obtained for metals in the pond water, concentration factors were calculated18. The metal concentrations in BSF and SSF were also subjected to the analysis of variance at p<0.05 significance level.
RESULTS AND DISCUSSION
The size distribution of the whole fish samples for this study is shown in Table 1. All the
parameters considered like weight, length and trunk diameter varied among the fish samples. Weights varied between 85.60g to 54.0g, length varied between 16.50cm to 14.00cm, while the trunk muscle diameter varied between 6.00cm to 5.00cm. The coefficient of variation for weight is 22.64%, for length it is 8.40% while it is 9.0% for trunk diameter. The weight, length and diameter differences were significant at p<0.05. The fish samples were of the same female sex. The age of the SSF was estimated at about twelve months while the BSF was estimated to be about eighteen months.
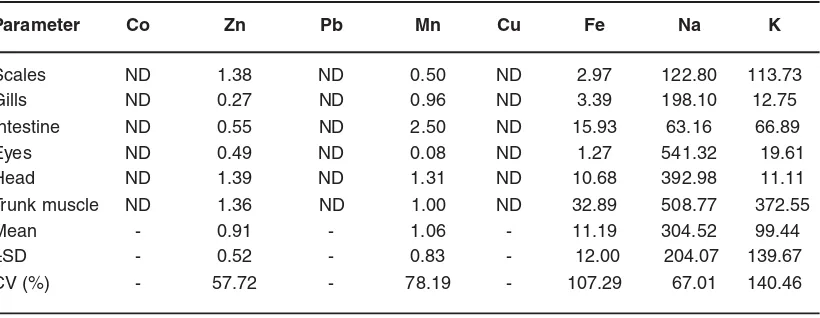
The levels of the various metals and their distribution in the SSF are shown in Table 2. Both
Table 2: Distribution of various metals in the smaller sized fish (SSF) organs of Oreochromis niloticus (mg/kg dry weight)
Parameter Co Zn Pb Mn Cu Fe Na K
Scales ND 1.38 ND 0.50 ND 2.97 122.80 113.73
Gills ND 0.27 ND 0.96 ND 3.39 198.10 12.75
Intestine ND 0.55 ND 2.50 ND 15.93 63.16 66.89
Eyes ND 0.49 ND 0.08 ND 1.27 541.32 19.61
Head ND 1.39 ND 1.31 ND 10.68 392.98 11.11
Trunk muscle ND 1.36 ND 1.00 ND 32.89 508.77 372.55
Mean - 0.91 - 1.06 - 11.19 304.52 99.44
±SD - 0.52 - 0.83 - 12.00 204.07 139.67
CV (%) - 57.72 - 78.19 - 107.29 67.01 140.46
*Determinations were in triplicate. ND = Not detected.
Table 1: The size distribution of the samples available for studya
Description Weight (g) Length (cm) Trunk diameter (cm)
Bigger sized fish (BSF) 85.60(1.10)b 16.50 (0.85) 6.00 (0.40)
Smaller sized fish (SSF) 54.00 (1.00) 14.00 (0.50) 5.00 (0.50)
Mean 69.80 15.25 5.50
±SD 15.80 1.50 0.50
CV (%) 22.64 8.20 9.09
SD = Standard deviation: CV = Coefficient of variation.
aValues significant at p <0.05.
bValues in parentheses are standard deviations.
cobalt, lead and copper were not detected in any part of the SSF. Zinc was mostly concentrated in the head, scales and trunk in that order, the gills had the lowest value of 0.27 mg/kg. The overall mean for zinc in the SSF is 0.91±0.52 mg/kg and a coefficient of variation of 57.72%. Manganese was mostly concentrated in the intestine and least concentrated in the eyes, head and muscle trunk of SSF while potassium was mostly concentrated in the trunk muscle. Sodium was generally more concentrated in the various parts of SSF than potassium but potassium was unevenly distributed than sodium: while CV is 140.40% in potassium, it is 67.01% in sodium.
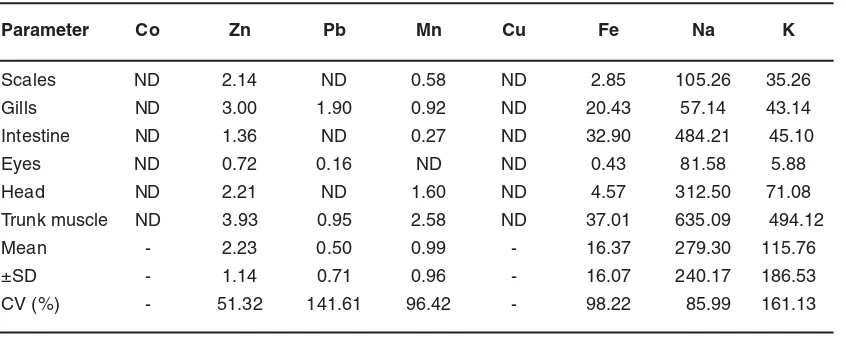
The metal concentrations and their distribution in the BSF are shown in Table 3. As observed in SSF, cobalt and copper were not detected in BSF. Lead was found in some organs of the BSF; the organs were gills, eyes and trunk muscle. The trunk lead concentration was 0.85mg/ kg. Zinc values in the BSF were generally higher when compared with corresponding organs in the SSF. Zinc mean value in the BSF is 2.23± 1.14mg/ kg with a CV of 51.32%. Manganese was not detected in the eyes of BSF but where detected, it is of higher concentration in comparison with the corresponding organs in the SSF. Because of the non detection of manganese in the eyes of BSF, the
Table 3: Distribution of various metals in the bigger sized fish (BSF) organs of Oreochromis niloticus (mg/kg dry weight)
Parameter Co Zn Pb Mn Cu Fe Na K
Scales ND 2.14 ND 0.58 ND 2.85 105.26 35.26
Gills ND 3.00 1.90 0.92 ND 20.43 57.14 43.14
Intestine ND 1.36 ND 0.27 ND 32.90 484.21 45.10
Eyes ND 0.72 0.16 ND ND 0.43 81.58 5.88
Head ND 2.21 ND 1.60 ND 4.57 312.50 71.08
Trunk muscle ND 3.93 0.95 2.58 ND 37.01 635.09 494.12
Mean - 2.23 0.50 0.99 - 16.37 279.30 115.76
±SD - 1.14 0.71 0.96 - 16.07 240.17 186.53
CV (%) - 51.32 141.61 96.42 - 98.22 85.99 161.13
*Determinations were in triplicate.
CV of manganese in the BSF is high with a value of 96.42%. Iron concentration was also high in the BSF particularly in the gills, intestine and the trunk muscle. Mean value of iron in the BSF is 16.37±16.07 mg/kg but a CV of 98.22% which is lower than 107.29% in the SSF showing that iron was less unevenly distributed in the BSF than in the SSF. Like the situation in the SSF, both sodium and potassium were highly concentrated in the BSF. As shown by the CV of both sodium and potassium in the BSF, both metals were unevenly distributed in the BSF than in the SSF. The trunk muscles in the BSF contained the highest concentrations of sodium and potassium.
gasoline. Lead is known to inhibit active transport mechanisms involving ATP, to depress the activity of the enzyme cholinesterase, to suppress celluar oxidation-reduction reactions, and to inhibit protein synthesis26. Virtually, all metals are toxic if the exposure is sufficiently high to exceed the tolerance level20,23.
Meats and fish are excellent sources of some of the minerals, such as iron, copper, zinc and manganese, and play impor tant role in the prevention of zinc deficiency and particularly of iron deficiency which is widespread27. Half of the iron in meat and fish is present as haeme iron (in haemoglobin). This is well absorbed, about 15- 35%, a figure that can be contrasted with other forms of iron, such as that from plant food, at 1-10%27. Not only is the iron of fish well absorbed but it enhances the absor ption of iron from other sources,
for example, the addition of fish to a legume/cereal diet can double the amount of iron absorbed and so contributes significantly to the prevention of anaemia, which is so wide-spread in developing countries like Nigeria27,28. Iron facilitates the oxidation of carbohydrates, proteins and fats. Zinc is present in all tissues of the body and is a component of more that 50 enzymes27. Zinc dietary deficiency has been found in adolescent boys in the Middle East eating a poor diet based largely on unleavened bread27.
Families and individuals who may be using vegetable and cereal sources of protein may not be able to meet the zinc allowance per day. The zinc in these sources is not as available as animal sources29. Manganese functions as an essential constituent for bone structure, for reproduction and for normal functioning of the nervous system, it is
Table 4: Mean* concentration of metals in stock water and sediments (mg/kg)
Parameter Co Zn Pb Mn Cu Fe Na K
Water ND 0.01 ND 0.04 ND ND 4.95 0.04
Sediments ND 0.41 ND 6.43 ND 78.95 6.67 1.56
Mean - 0.08 - 3.24 - 39.48 5.81 0.80
±SD - 0.07 - 3.20 - 39.47 1.36 0.76
CV (%) - 87.50 - 98.80 - 99.97 23.41 95.00
*Determinations were in triplicate.
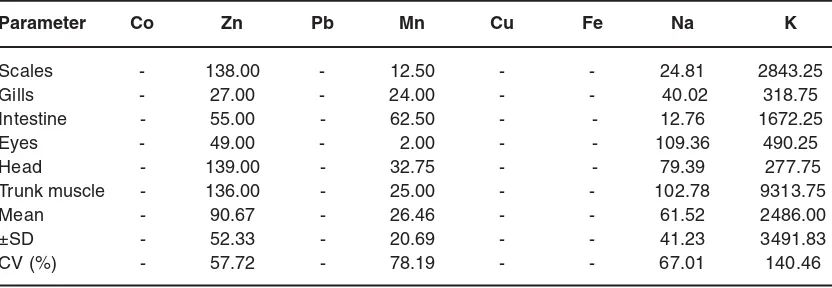
Table 5: Bioconcentration factors* of the various metals in the smaller sized fish (SSF) organs
Parameter Co Zn Pb Mn Cu Fe Na K
Scales - 138.00 - 12.50 - - 24.81 2843.25
Gills - 27.00 - 24.00 - - 40.02 318.75
Intestine - 55.00 - 62.50 - - 12.76 1672.25
Eyes - 49.00 - 2.00 - - 109.36 490.25
Head - 139.00 - 32.75 - - 79.39 277.75
Trunk muscle - 136.00 - 25.00 - - 102.78 9313.75
Mean - 90.67 - 26.46 - - 61.52 2486.00
±SD - 52.33 - 20.69 - - 41.23 3491.83
CV (%) - 57.72 - 78.19 - - 67.01 140.46
*Ratio concentration in fish parts (ìg/g to concentration in water mg/1).
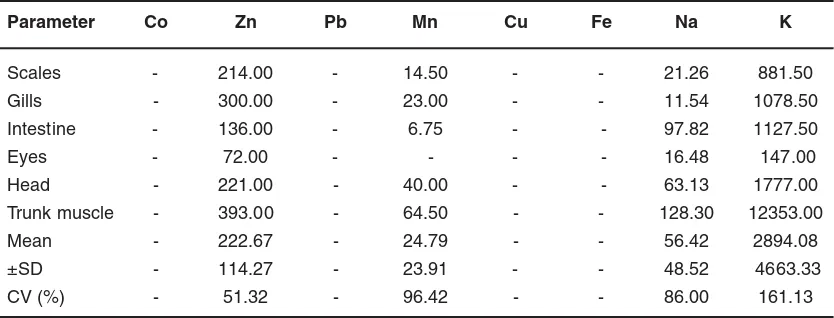
Table 6: Bioconcentration factors of the various metals in the bigger sized fish (BSF) organs
Parameter Co Zn Pb Mn Cu Fe Na K
Scales - 214.00 - 14.50 - - 21.26 881.50
Gills - 300.00 - 23.00 - - 11.54 1078.50
Intestine - 136.00 - 6.75 - - 97.82 1127.50
Eyes - 72.00 - - - - 16.48 147.00
Head - 221.00 - 40.00 - - 63.13 1777.00
Trunk muscle - 393.00 - 64.50 - - 128.30 12353.00
Mean - 222.67 - 24.79 - - 56.42 2894.08
±SD - 114.27 - 23.91 - - 48.52 4663.33
CV (%) - 51.32 - 96.42 - - 86.00 161.13
also a part of the enzyme system. Meat and poultry products contribute a little of this micromineral30; this observation agrees with this report. The fish samples are good sources of sodium and potassium. Potassium is primarily an intracellular cation, in large part this cation is bound to protein and with sodium influences osmotic pressure and contributes to normal pH equilibrium31.
All the metals detected in the fish parts are more concentrated in the trunk muscle than any part in the BSF. This pattern of metal concentration is not observed in the SSF except for iron and potassium (Tables 2 and 3). The metal concentration in the BSF may be an evidence of gradual accumulation of metals in fish as a fish ages. In fish, parts normally consumed mostly are the trunk muscles, although the head is now becoming a delicacy32. This means the bigger the fish, the likely is its ability to supply the human requirements of zinc, manganese, iron, sodium and potassium. The result of this study agrees with the results of Olaleye and Akintunde8 who concluded that the factors which affect the quantity of mineral elements in the muscle tissue could be summarised as the size, state of maturity, sex and body location from where the samples were taken. The variable accumulation and fall in concentration of the various elements recorded in the muscle of fish is in agreement with the result of Thurston33 and Love34 who attributed such variation to changes in fish physiology associated with maturation processes
and spawning. Other factors which might have affected the concentration of the elements in the various regions of the fish include the distribution of the dark and white muscle fibres each of which has different sizes35 and which contained different amounts of different elements34.
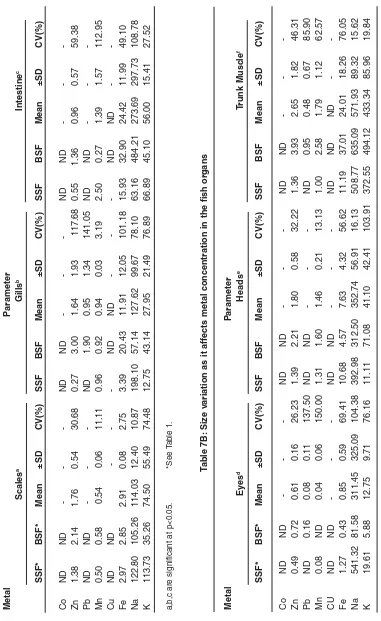
T a ble 7A: Siz e v a
riation as it aff
ects metal concentration in the fish or
gans Metal P arameter Scales a Gills b Intestine c SSF* BSF* Mean ±SD CV(%)
SSF BSF Mean
±SD CV(%) SSF BSF Mean ±SD CV(%) C o ND ND -N D N D -ND ND -Zn 1.38 2.14 1.76 0.54 30.68 0.27 3.00 1.64 1.93 117.68 0.55 1.36 0.96 0.57 59.38 Pb N D N D -N D 1.90 0.95 1.34 141.05 N D N D -Mn 0.50 0.58 0.54 0.06 11.11 0.96 0.92 0.94 0.03 3.19 2.50 0.27 1.39 1.57 112.95 C u ND ND -N D N D -ND ND -F e 2.97 2.85 2.91 0.08 2.75 3.39 20.43 11.91 12.05 101.18 15.93 32.90 24.42 11.99 49.10 Na 122.80 105.26 114.03 12.40 10.87 198.10 57.14 127.62 99.67 78.10 63.16 484.21 273.69 297.73 108.78 K 113.73 35.26 74.50 55.49 74.48 12.75 43.14 27.95 21.49 76.89 66.89 45.10 56.00 15.41 27.52 a,b
,c are significant at p<0.05.
*See T a b le 1. T a ble 7B: Siz e v
ariation as it aff
ects metal concentration in the fish or
gans Metal P arameter Ey es d Heads e T runk Musc le f SSF* BSF* Mean ±SD CV(%)
SSF BSF Mean
±SD CV(%) SSF BSF Mean ±SD CV(%) C o ND ND -N D N D -ND ND -Zn 0.49 0.72 0.61 0.16 26.23 1.39 2.21 1.80 0.58 32.22 1.36 3.93 2.65 1.82 46.31 Pb N D 0.16 0.08 0.11 137.50 N D N D -N D 0.95 0.48 0.67 85.90 M n 0.08 N D 0.04 0.06 150.00 1.31 1.60 1.46 0.21 13.13 1.00 2.58 1.79 1.12 62.57 C U N D N D ---N D N D -N D N D N D --F e 1.27 0.43 0.85 0.59 69.41 10.68 4.57 7.63 4.32 56.62 11.19 37.01 24.01 18.26 76.05 Na 541.32 81.58 311.45 325.09 104.38 392.98 312.50 352.74 56.91 16.13 508.77 635.09 571.93 89.32 15.62 K 19.61 5.88 12.75 9.71 76.16 11.11 71.08 41.10 42.41 103.91 372.55 494.12 433.34 85.96 19.84 d, e
, f are significant at p<0.05.
it was detected in the gills, eyes and trunk muscle of the BSF thus suggesting that the use of fish to assess the level of water pollution from such bio-accumulated metals may be misleading if not carefully interpreted. This same observation has
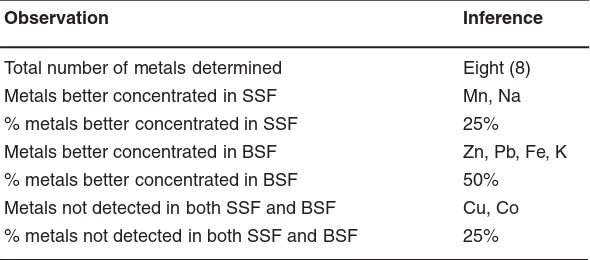
Table 8: Summary of metal concentration (on average basis) in the fish samples
Observation Inference
Total number of metals determined Eight (8)
Metals better concentrated in SSF Mn, Na
% metals better concentrated in SSF 25%
Metals better concentrated in BSF Zn, Pb, Fe, K
% metals better concentrated in BSF 50%
Metals not detected in both SSF and BSF Cu, Co
% metals not detected in both SSF and BSF 25%
been made fir cadmium and copper by Ipinmoroti and Oshodi9. The level of lead concentration in the BSF trunk muscle is lower than the maximum permissible level (MPL) for metals in fish muscle set by the US Food and Drug Administration6 which
is 2.0mg/kg wet weight for lead. When it is realised that the determination is on dry weight basis then the present report is still within the safe level.
The size variation as it affects the metal concentration and distribution in the fish organs pairwise is shown in Table 7. An examination of the metal concentration can be done at a glance in this Table. In the majority of the fish organs, the pairwise comparison showed that most of the metals were more concentrated in the BSF than in the SSF. This observation is also depicted in the CV which is more than 50% in most cases. The analysis of variance showed that significant differences occurred in the metal concentrations between the SSF and the BSF in the scales, gills, intestine, eyes, heads and trunk muscles at a significant level of p<0.05.
CONCLUSION
In a survey carried out by Adeniyi1 he reported that when consumers were asked to indicate the sources of animal protein they preferred most, 60.2% of them indicated that they preferred fish to any other sources of animal protein. Fish have thus become the major source of animal protein to the average Nigeria citizenry. There is a reasonable level of the beneficial metals (zinc, iron, manganese, sodium and potassium) in the fish samples studied and the metal concentrations appear enhanced by the bigger size of the fish. A summary of the various concentrations in SSF and BSF is shown in Table 8.
REFERENCES
1. Adeniyi JP, Journal of West African Fisheries,
3(2): 151 (1987).
2. Oyenuga VA, Nigeria’s foods and feeding-stuffs. Ibadan, Ibadan University Press
(1968).
4. Osajuyigbe O, Public investment in fisheries development in Nigeria. M.Sc. Thesis,
University of Ife, Ile-Ife, Nigeria (1981).
5. Williams SS, A structural analysis of government investment in the fish industry in Nigeria. Nigerian Agricultural outlook
(1986).
6. Odukoya OO, Ajayi SO, Nig. J. Nutr. Sci.,
8(2): 105 (1987).
7. Odukoya OO, Ajayi SO, Nig. J. Nutr. Sci.,
8(1): 41 (1987).
8. Olaleye VF, Akintunde EA, Concentration and distribution of some mineral elements in the fillet of Sarotherodon galilaneus (Artedi) in a Nigerian freshwater. Paper presented at the
8th annual conference of the fisheries Society of Nigeria (FISON), Federal University of
Technology, Akure, Nigeria (5th-9th November) (1990).
9. Ipinmoroti KO, Oshodi AA, Discovery and Innovation, 5: 135 (1993).
10. Adeyeye EI, Intern. J. Eviron.Stud., 45:231 (1994).
11. Fryer G, Iles TD, The cichlid fishes of great lakes of Africa – their biology evolution. Oliver
and Boyd (1972).
12. Parker RC, Water analysis by atomic absorption spectroscopy. Switzerland Varian
techtron (1972).
13. Udo EJ, Ogunwale AJ, Laboratory manual for the analysis of soil, plant and water samples. Depar tment of Agronomy,
University of Ibadan, Ibadan, Nigeria
(1978).
14. Harper BJ, Fileman CF, May PV, Potmann JE, Methods of analysis for trace metals in marine and other samples. Lowestoft Aquatic
Environment Protection Analytical Methods,
Number 3 (1989).
15. Varian Techtron, Basic atomic absorption spectroscopy-a modern introduction.
Victoria, Dominican Press, Australia (1975).
16. Vogel AI, Textbook of quantitative inorganic analysis 4th edition. England, Longman Group Ltd. (1985).
17. Steel RGD, Torrie JH, Principles of procedures of statistics. London, Mc
Graw-Hill (1960).
18. Varshney CK, Water pollution and
Management. New Delhi, Wiley Eastern Ltd.
(1991).
19. Buss D, Robertson J, Manual of Nutrition.
8th edition. London, Her Majesty’s Stationery Office (1976).
20. Mertz W, Science, 213: 1332 (1981). 21. Oshodi AA, Ipinmoroti KO, Ghana J.
Chemistry, 1(2): 138 (1990)
22. Fagbemi TN, Oshodi AA, Nig. Fd. J, 9: 26 (1991)
23. Carter DE, Fernando Q, J. Chem. Educ.,
56(8): 490 (1971)
24. Crosby NT, The Analyst, 102(1213): 225 (1977)
25. Mombershora CO, Osibanjo O, Ajayi SO, Environ. Intern., 9:81 (1983)
26. Waldron HA, Stofen D, Sub-clinical lead poisoning. New York, Academic Press
(1974).
27. Bender A, Meat and meat products in human nutrition in developing countries. Rome, FAO
Food and Nutrition paper 55: FAO (1992). 28. Wheby MS, Systemic effects of iron
deficiency. In Iron (Crosby, W.H. ed), New
York, Medicom, Inc., 39(1974).
29. National Academy of Sciences. Food nutrition board: zinc in human nutrition. In
summary of proceedings of a workshop,
December 4th - 5th, 1970, National Academy of Sciences. Washington DC, National
Research Council (1971).
30. Fleck H, Introduction to nutrition, 3rd edition. New York, Macmillan Publishing Co., Inc.
(1976).
minerals. In knowledge in Nutrition, 3rd edition. Nutrition Foundation, Chap. 28, New
York, (1987).
32. Okoye BCO, Afolabi OA, Ajoa EA, Int. J. Environ. Stud., 37: 285 (1991)
33. Thurston CE, J. of Agric. and Fd. Chem., 9(4): 313 (1961)
34. Love RM, The chemical biology of fishes.
New York, Academic Press (1970).