World Maritime University World Maritime University
The Maritime Commons: Digital Repository of the World Maritime
The Maritime Commons: Digital Repository of the World Maritime
University
University
World Maritime University Dissertations Dissertations
11-5-2017
A case study: an economic evaluation of liqufied natural gas
A case study: an economic evaluation of liqufied natural gas
(LNG) fuel for new ships of Korean ship owners
(LNG) fuel for new ships of Korean ship owners
Hyuntae Kim
Follow this and additional works at: https://commons.wmu.se/all_dissertations
Part of the Power and Energy Commons, and the Transportation Commons
Recommended Citation Recommended Citation
Kim, Hyuntae, "A case study: an economic evaluation of liqufied natural gas (LNG) fuel for new ships of Korean ship owners" (2017). World Maritime University Dissertations. 558.
https://commons.wmu.se/all_dissertations/558
WORLD MARITIME UNIVERSITY
Malmo, Sweden
A Case Study: An Economic Evaluation of
Liquefied Natural Gas (LNG) Fuel for New Ships
of Korean Ship Owners
By
Hyuntae KIM
The Republic of Korea
A dissertation submitted to the World Maritime University in partial
Fulfilment of the requirements for the award of the degree of
MASTER OF SCIENCE
In
MARITME AFFAIRS
(MARITIME ENERGY MANAGEMENT)
2017
II
DECLARATION
I certify that all the material in this dissertation that is not my own work has been identified, and that no material is included for which a degree has previously been conferred on me.
The contents of this dissertation reflect my own personal views, and are not necessarily endorsed by the University.
(Signature):
(Date):
Supervised by: Dimitrios Dalaklis Josefin Madjidian World Maritime University
III
ACKNOWLEDGEMENT
First of all, I express my deepest appreciation to the Korean Register of Shipping for giving me this honorable opportunity to study at World Maritime University (WMU). I would like to especially, express my profound gratitude to the former CEO, the late Dr. Beomsik Park, not only for granting me the fellowship but also for his immense encouragement.
My sincere gratitude also goes to the faculty in charge of the Maritime Energy Management Specialization, Dr. Aykut I. Olcer and Dr. Fabio Ballini for their immeasurably valuable knowledge imparted to me, and to my supervisor, Dr. Dimitrios Dalaklis for taking time out of his busy schedule to support for this study.
I also would like to thank NAPA LTD., for the valuable information they shared with me, enabling this research to become a successful one.
IV
ABSTRACT
Title of Dissertation: A Case Study: An Economic evaluation of
Liquefied Natural Gas (LNG) Fuel for New Ships of Korean Ship Owners
Degree: MSc
This dissertation is a case study of an economic evaluation of lifetime cost for the ships using different fuel types and navigating based on Korea in order to give more practical references to Korean ship owners to choose better fuel for their ships to comply with upcoming Sulphur cap 2020 in a LNG favorable view.
The dissertation briefly outlines the necessity of introduction of the new fuel types/systems, current status of potential alternatives, strengths and weaknesses of the 3 most feasible alternatives, LNG, emission abatement system and low Sulphur content oil. In consideration of the fact that current costs related to the 3 alternatives are not revealed and future costs are surrounded by uncertainties, the dissertation conducts logical and reasonable inferences and assumptions based on collected fragmentary data which has been released to the public. One key assumption is that the current price differential of LNG by region will be maintained for decades, meaning that ships with different routes have accesses to different LNG price.
Based on those data and assumptions, lifetime costs including CAPEX for various types and sizes of ships on diverse routes are calculated on the basis of 3 different fuel types. The results of the calculation are presented as tables and analyzed. Considerations and areas for further study are discussed in the final part of the dissertation.
V
TABLE OF CONTENTS
DECLARATION ... II ACKNOWLEDGEMENT ... III ABSTRACT ... IV TABLE OF CONTENTS ... V LIST OF TABLES ... VII LIST OF FIGURES ... VIII LIST OF ABBREVIATIONS ... IX
I. INTRODUCTION ... 1
1.1 Background of Study ... 1
1.2 Research Problem Statement ... 3
1.3 Research objectives & Questions ... 6
1.4 Outline and limitation of the Study ... 6
II. LITERATURE REVIEW ... 9
2.1 International Convention ... 9
2.2 Possible Alternative Methods ... 15
2.2.1 Clean and Renewable Energy source ... 15
2.2.2 Less Pollution Fuels ... 17
2.3 Conclusion ... 21
III. FEASIBLE ALTERNATIVE METHODS ... 22
VI
3.2 HFO with Emission Abatement System ... 24
3.3 LNG ... 27
3.4 Conclusion ... 31
IV. OPERATIONAL EXPENDITURE ... 33
4.1 Location of LNG Bunkering Station and the Price ... 34
4.2 Fuel Consumption ... 38
4.3 Conclusion ... 43
V. CONCLUSION ... 51
5.1 Summary of Dissertation ... 51
5.2 Other Consideration and Further Areas for Research ... 53
VII
LIST OF TABLES
Table 1.1 Available Investment Cost 26
Table 1.2 Available Investment Cost (by €/Kw) 27
Table 2 Main Characteristics of the Different Tank Types 29
Table 3 Main Characteristics of the Different LNG Fuel
Engine Types 30
Table 4 Price for Newbuilding Ships (June 2017) 31
Table 5 CAPEX for 3 Fuel System (M$) 32
Table 6 Average Price of LNG and Index 36
Table 7 Assumed Landed LNG Price 37
Table 8 Standard Fuel Price by Region 38
Table 9 Ratio of Regional Fuel by Navigation Routes 39
Table 10 Calorific Value of Each Fuel 40
Table 11.1 Fuel Consumption of Bulk Carrier in Return 40
Table 11.2 Fuel Consumption of Tanker in Return 41
Table 11.3 Fuel Consumption of Container in Return 42
Table 12 Annual Fuel Consumption 43
Table 13.1 Total Cost for USA (West) Route 44
Table 13.2 Total Cost for USA (East) Route 44
Table 13.3 Total Cost for Australia Route 45
Table 13.4 Total Cost for EU Route 45
Table 13.5 Total Cost for Mid-East Route 46
Table 13.6 Total Cost for SE Asia Route (Cheap LNG Access) 46
VIII
LIST OF FIGURES
Figure 1 World LNG Estimated Landed Price. Feb-17 5
Figure 2 NOx Emission Limits 11
Figure 3 Fuel Sulphur Limits 12
Figure 4 Required EEDI 14
Figure 5 Hybrid Scrubber in Open Mode (up)
and Closed Mode (down) 25
Figure 6 Process Diagram for LNG Fuel System 28
Figure 7 Global Infrastructure for LNG Bunkering 34
Figure 8 LNG Price by Region (~2013) 35
Figure 9 LNG Estimated Landed Price by Region 36
Figure 10.1 the Percentage of Total Cost for LNG to Non-application 47
Figure 10.2 the Percentage of Total Cost for Scrubber
to Non-application 48
Figure 11 the Probability on Each Option for Capesize
on USA West Coast Route 49
Figure 12 the Probability on Each Option for 8800 TEU
IX
LIST OF ABBREVIATIONS
ABS American Bureau of Shipping
AirClim Air Pollution and Climate Secretariat
BIMCO Baltic and International Maritime Council
CAPEX Capital Expenditure
COP Conference of the Parties
DOCs Diesel Oxidation Catalysts
DPF Diesel Particulate Filter
ECA Emission Control Area
EEDI Energy Efficiency Design Index
EGR Exhaust Gas Recirculation
EGS Exhaust Gas Scrubber
EIA Energy Information Administration
ESI Environmental Ship Index
ESP Electrostatic Precipitators
EU European Union
FERC Federal Energy Regulatory Commission
FGS Fuel Gas Supply
GHGs Green House Gases
HFO Heavy Fuel Oil
IGC Code International Code for the Construction and Equipment of
Ships Carrying Liquefied Gas in Bulk
IGF Code International Code of Safety for Ships Using Gases or Other
Low-Flashpoints Fuels
IMO International Maritime Organization
IPCC Intergovernmental Panel on Climate Change
IPIECA International Industry Environmental Conversation
Association
IQPC International Quality and Productivity Center
IWSA International Windship Association
KR Korean Register of Shipping
X LPG Liquefied Petroleum Gas
LSFO Low Sulphur Fuel Oil
MARPOL International Convention for the Prevention of Pollution from
Ships
MGO Marine Gas Oil
MDGs Millennium Development Goals
MDO Marine Diesel Oil
NECA NOx Emission Control Area
NOx Nitrogen Oxides
OPEX Operational Expenditure
RF Radiative Forcing
SCR Selective Catalytic Reduction
SDGs Sustainable Development Goals
SECA Sulphur Emission Control Area
SOx Sulphur Oxides
Topsis Technique Order of Preference by Similarity to Ideal Solution
UNFCCC United Nations Framework Convention on Climate Change
USEPA United States Environmental Protection Agency
VLCC Very Large Crude Carrier
I. INTRODUCTION
1.1 Background of Study
Frequently occurring natural disasters are a current threat to humans. Extreme hurricanes, floods and droughts have claimed lives and properties, and rising sea water level and unpredictable weather changes can threaten humankind’s very existence. Therefore, in recent decades the world has started to pay attention to these issues and has taken measures to reduce the global warming phenomenon which is one of the main causes of this situation.
The maritime industry is no exception. The International Maritime Organization (IMO) has established countermeasures to reduce emissions of Green House Gas (GHGs) and air pollutants such as Nitrogen Oxides (NOx) and Sulphur Oxides (Sox) from vessels and some measures have already entered into force for example regulations in Annex VI/Chapter 3 and 4 of the International Convention for the Prevention of Pollution from Ships (MARPOL). Moreover, the criteria for emissions will become stricter, so relevant parties such as equipment manufacturers, shipyards and ship owners/managers continue to study and research to make ships compliant with the regulations.
At the result of the efforts from relevant parties, at the moment, many technologies and operational methods have been developed in order for ships to comply with international regulations. These methods can be divided into three groups;
2
of alternative energy, and the details are as follows (Fernandez, et al., 2010; International Maritime Organization, 2015; Vogler, et al. 2016; “7 Technology”, 2016):
Improvement of ship’s efficiency
- Operational Method : Slow steaming, Improved voyage planning,
Constant shaft rpm operation, Hull and propeller maintenance, Trim optimization, Weather routing
- Technical Method : Optimized ship design (ex: modifying bulbous bow),
Use of slide valve for fuel injection in engine, Optimized fuel injection (timing and pressure), Waste heat recovery system, Swirl,
Advanced rudder and propeller, Air bubble projection
Emission abatement system
- Electrostatic precipitators (ESP), Diesel particulate filter (DPF),
Diesel oxidation catalysts (DOCs), Selective catalytic reduction (SCR), Exhaust gas recirculation (EGR), Exhaust gas scrubbers (EGS)
Alternative energy
- Renewable energy : Solar power, Wind power, Hydrogen Fuel Cells
- Better fuel (in air pollution perspective) : LNG, MGO/MDO, Bio fuels
Many methods for reduction of emissions by improving efficiency have been
developed and while are very good means of assistance, they are definitely not the solutions. Most renewable energy resources are elusive due to insufficiently
developed technologies and/or having some reasons not enough to replace current fossil fuel. Bio-fuel, additionally, has problems with its economic feasibility and productivity (Fernandez, et al., 2010; International Maritime Organization, 2015; Vogler, et al., 2016, “7 Technology”, 2016). Therefore, in order to comply with current and upcoming regulations the following three options will be considered as
3
1.2 Research Problem Statement
The three different systems, more specifically, LNG, HFO with abatement systems and low sulphur content oil are considered as fuel types for new building ships to satisfy the current and near future emission regulations (Dalaklis et al, 2016). Using HFO in normal condition and switching fuel from HFO to MDO/MGO in Emission Control Areas is the only practice to comply with current Sulphur controls, but it will not be effective after 2020 which is the starting time for the reduced Sulphur content fuel limit from 3.5% to 0.5%.
Moreover, it is expected that the regulations will continue to get stricter and there is a strong possibility that other air pollutants like particulate matters will be regulated in the near future (Schinas & Butler, 2016). Therefore, LNG which has more margin for further emission control of many air pollutants is often given to center stage as a future fuel. It is already well-known that LNG produces zero percent of Sulphur dioxide emission and can reduce Nitrogen oxide up to 90 percent, particulate matter emissions by 98 percent and carbon dioxide emissions by 25 percent, compared to conventional fossil fuels of ships (as cited in Xu et al, 2015).
In addition to the strength of LNG in cleanness, introduction of shale gas ensures that LNG has a quantitative advantage as an alternative fuel replacement for current heavy oil. Furthermore, one of the biggest barriers for commercializing LNG as ships’ fuel which is lack of LNG bunkering stations, is expected to be solved in the near future because many major bunkering ports in the world have planned to build LNG bunkering stations (WPCI, 2016). Therefore, in consideration of the time to build a ship and a bunkering station, it would not be a barrier anymore for ships ordered from now on.
4
and the ships will be delivered from the second half of 2018 (‘Scvcomflot Order’, 2017). The markets for LNG fuel ship and bunkering ship is estimated to be worth 130 and 20 billion USD respectively by 2025 (Ministry of Trade, Industry and Energy, 2015) and about 30 percent of new ships are expected to have gas engines (Det Norske Veritas, 2012).
Although LNG has benefits compared to its competitors, LNG still has some problems to be solved. LNG has to be stored in liquid form for its economic feasibility, which is only possible under temperatures lower than – 162 degrees Celsius.This causes a problem in terms of building a storage tank on board. The storage tank requires 2~3 times more volume (5,000 CBM for 100,000 ton oil tank (Tae-Woo Kim et al, 2012)) compared to the same size of conventional ships and substantial cost. Additional cost for an LNG tank is estimated at 5 to 20 million USD, depending on the ship’s size (DNVGL, 2014)). In addition, many problems such as high cost for initial investment, unfamiliarity of use of LNG fuel, uncertainty of future fuel prices, reliability of LNG fuel main engine, security and uncertainty of regulatory structure still remain (Schinas & Butler, 2016).
Above all, lack of information on the use of LNG fuel, especially from the economic perspective, is one of the biggest reasons that ship owners hesitate to choose this fuel type or system for their new ships. Several organizations including classification societies and manufactures have already released their research results comparing CAPEX and OPEX of the three options. For instance, according to KR and DNVGL, the results are generally in favorable to HFO with emission abatement system (KR, 2017; DNVGL, 2016). Of course those reports are heavily depending on wide-open future changes like fuel prices and installation capital
5
bunkering stations for ships, it is impossible to get very accurate LNG price for ships but prices could be estimated based on landed prices. As it is shown in Figure 1, LNG prices are very diverse by region, the price in the Far East Asia is more than twice as expensive as the price in the USA. Different routes mean different access to different prices of LNG, which should have been included in the reports, but was not. Therefore, In order to provide more practical information for ship owners, more various cases should be calculated and the price differential of LNG by region should be considered.
Because of the deep economic recession in the shipping business worldwide and the sluggish economy of Korea, Korean ship owners have seldom placed orders for new ships in the last few years. However, considering the perpetuation of their business and time period to build a ship, they have to deliberate and decide the type of fuel for their new ships. For better decision concerning proper fuel, a more
practical cost evaluation of using LNG in their circumstance and an evaluation of the pros and cons compared to conventional fuels will be needed.
Figure 1 World LNG Estimated Landed Prices: Feb-17
6
1.3 Research objectives & Questions
This dissertation aims to help Korean ship owners to comprehend the different types of fuels among the three options stated earlier with focus on the use of LNG when they plan to build new ships. Therefore, this dissertation will consider the situation after 1 January 2020 when stricter SOx regulations enter into force from 3.5 % m/m to 0.5 % m/m worldwide.
In order to achieve the objectives, this dissertation will answer the following questions:
1) Why do ships need to change their fuel/engine systems and which alternatives are available?
2) What are the pros and cons of the three fuel types in comparison to each other with a focus on LNG?
3) How much Capital Expenditure (CAPEX) is needed to build new ships using different fuels? How much Operational Expenditure (OPEX) is needed for a ship’s lifetime (30 years)?
4) In the circumstance of uncertainties, what are the probabilities for each option to be the best option?
1.4 Outline and limitation of the Study
In order to achieve the objectives, this dissertation contains five (5) chapters. Chapter 1 explains the background knowledge, objectives and outline of this dissertation.
Chapter 2 introduces current trends in the international regulatory framework
7
In chapter 3, pros and cons of each fuel type and its systems will be explained. Additionally, the necessary equipment for use with each fuel type in order to comply with the regulations will be explained along with its price. Unfortunately, at the moment, at a time of feverous competition among manufactures and shipyards, the prices are mostly confidential. Moreover, the prices are very diverse depending on various factors such as shipyards and size/type/cargo of ships. Therefore, in this chapter, information related to prices will be collected and examined the best assumptions.
In chapter 4, OPEX for ships, over an average 30 years life term, using different fuel types will be calculated. Firstly, locations of LNG bunkering facilities at the moment, under construction and in contemplation will be identified and landed LNG prices by region will be estimated. Using this information, OPEXs will be estimated for the 3 most dominant ship types in Korea, which are bulk carriers, container ships and tankers in several sizes and for several routes. Ships on different routes can access different prices of LNG, so OPEX will be examined by ship type, ship size and ship route. In the last part of chapter 4, the best option will be determined using CAPEX and OPEX from chapter 3 and 4. Moreover, considering the possibility of price fluctuation, all the factors affecting cost are given 25% of price deviation, and the probabilities of each option and the chance to be best option, 2nd option and 3rd
option, will be determined using the Monte Carlo Method for probability distribution and Topsis method for deciding the priority.
8 dissertation.
This dissertation has some limitations. Firstly, many calculations and estimations of prices have limitations in terms of accuracy. This is due to the complexity of the calculation itself, lack of accurate information, limited number of LNG fuel ships in operation and unreliability of future price prediction. Therefore, during the
calculation, factors which have minor effect on operational cost may be ignored. The operational cost, including incentives like special tariffs or benefits provided from ports by using the Environmental Ship Index (ESI) developed by the World Port Climate Initiative (WPCI) for low emission ships and additional training cost for crews could be ignorable because they are minor compared to fuel expense and mostly they offset each other.
Secondly, this dissertation intends to enumerate the elements which should be considered to decide on a proper fuel type. It does not intend to create the ultimate formula to produce perfect answer because shipping companies are in different situations, and, therefore, different elements have to be considered when building their ships. There is no perfect answer for all ship owners. Therefore, this
dissertation will enumerate useful and accurate information as much as possible and leave the final decision to Korean ship owners.
As stated in the problem statement, this dissertation aims to help Korean ship owners to select proper fuel types when they plan to build new ships. This
dissertation intends to cover the main concepts which should be considered from an economic perspective before choosing LNG as the main fuel and introduce the pros and cons compared to other possible candidates. Moreover, all the calculation will be carried out for ships navigating based on Korea, so the result can be a good reference when Korean ship owners choose proper fuel for propulsion of their future vessels and strong evidence supporting the current strategy of the Korean
9
II. LITERATURE REVIEW
2.1 International Convention
Since the world started perceiving the seriousness of the global warming, the
necessity of working at a global level has been raised and has led to meetings of the United Nations. In 1992, the United Nations Framework Convention on Climate Change (UNFCCC) was agreed and the world started working together more seriously and effectively. Then it made a very meaningful agreement which was the ‘Kyoto Protocol to UNFCCC’ ratified in 2002. Although it was considered as a “half” protocol because most CO2 emitting countries such as the USA and China were not involved, in the respect that it was the first legally binding written agreement to have a specific target (5% reduction of CO2 emission) for developed countries, it had a great significance.
Due to continuous dedication worldwide, eventually, in the 2015 UNFCCC (21ST
Conference of the Parties (COP21)), significant progress was made by way of the, “Paris Agreement”. Although it did not contained legal binding force, it was
meaningful in that it was the first agreement to obligate all member states (195 member states) to mitigate Global Warming Emissions. In consideration that COP21 (30 November 2015) was held right after the Paris terror attack (13 November 2015), leading to cancellation of most of events scheduled to be held in Paris, we can see how it was an important issue which should not be delayed.
10
Gas (GHG) emission was late compared to other industries on land. Eventually, the International Maritime Organization (IMO) legislated regulations Annex VI / Chapter IV “Regulation on Energy Efficiency for Ships”, which entered into force after 1 January 2013, in the International Convention for the Prevention of Pollution for Ships (MARPOL Convention) in order to mitigate GHG emissions.
Chapter III “Requirements for Control of Emissions from Ships” mainly controlling Nitrogen Oxides (NOx) and Sulphur Oxides (SOx) in the same Annex in the MARPOL Convention does not looks like it is related to Chapter IV, Energy
Efficiency. However, at the moment when there is no way to use alternative energy as a replacement for current fossil fuel, using less fuel in more efficient ways with minimum waste, and using less emitting fuels generally apply to both regulations, chapter III and IV.
Those regulations are related but affect ships in different ways, so ship owners have to consider all the factors when they plan new ship building. There are tens of combinations to comply with all the regulations because each regulations can be complied with by several methods. Furthermore, all of the methods are new and unfamiliar to ship owners. These two complicating facts make ship owners hesitant to choose proper fuel type for their new building ships. They have to examine the requirements of each regulation in accordance with their ships’ features such as ship type and navigation route.
A. NOx regulation (Reg.13 of Annex VI in MARPOL)
11
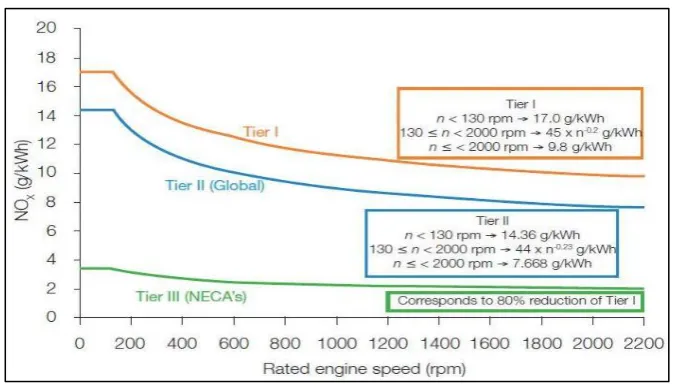
In contrast with SOx, formation of NOx heavily relies on the process of combustion in the engine. Therefore, it is difficult for new regulations to apply to existing ships retroactively, so it is applicable only to ships built after the regulations come into effect. Tier I is applied to ships constructed after 1 Jan. 2000, Tier II is for ship constructed after 1 Jan. 2010 and Tier III is for ships constructed after 1 Jan. 2016 only in NOx Emission Control Area (NECA), and their detailed requirements are shown in Figure 2.
At the moment, only North America and U.S. Caribbean areas are designated as NECA by IMO (since 1 Jan. 2016) but the Baltic Sea and North Sea were approved as NECA after 1 Jan. 2021. Moreover, it is expected that more areas will proposed to be designated as NECA, so ship owners should be cautious of the construction date of their new building ships.
Figure 2 NOx emission limits
12
B. SOx Regulation (Reg.14 of Annex VI in MARPOL)
SOx normally refers to SO2 and sometimes to SO3. It can harm the human
respiratory system making breathing difficult and it is particularly serious for children, the elderly and people suffering from asthma. Moreover, high concentrations of gaseous SOx can harm plants and trees and it can cause acid rain which can harm sensitive environment (USEPA, n.d.). It was the main cause for London Smog with NOx. It is produced by oxidation of sulphur during engine combustion. In contrast with NOx, Sulphur in SOx is mainly from contents in fuel, barely related to the combustion process in engines. Therefore regulations on SOx are always applicable to new building ships and existing ships.
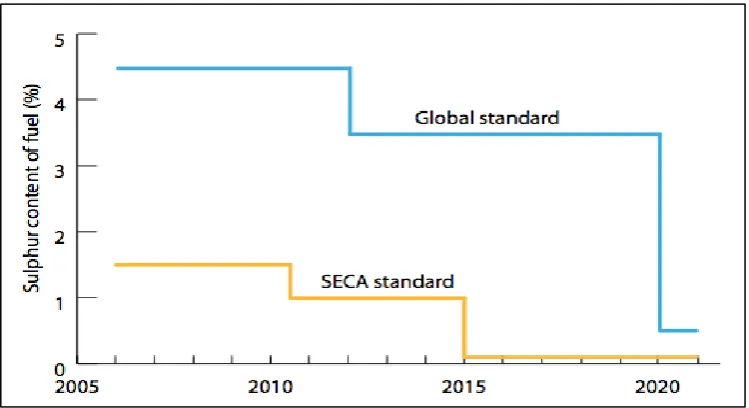
Switching fuel from HFO to MGO near SECA is, so far, typical practice to comply with SOx regulation, but it does not seem to be proper after the global standard is reduced from 3.5 %m/m to 0.5 % m/m on 1 Jan. 2020, as it is shown in Figure 3.
Figure 3 Fuel Sulphur limits
13
It is expected, at the moment, that there are generally two ways to control SOx emission, one is controlling Sulphur content in fuel and the other is using exhaust gas cleaning systems. The easiest way to meet new SOx standards is by changing fuel from HFO to low sulphur fuels like MGD/MDO, but the price of low Sulphur fuel is very expensive, IFO180 is 317 $/mt and MGO is 451 $/mt at Rotterdam on 29 Apr. 2017 (from World Bunker Price), so it is the worst way from the economic
perspective. Moreover, as mentioned earlier, the regulation is not only applicable to new building ships but also to existing ships, so existing ships have narrow options to meet regulations. At the moment, it is considered that cleaning systems like the SOx scrubber system, which is very feasible technically, are more attractive to existing and new building ship owners both and using other propulsion systems like gas fueled engines is more attractive to new building ship owners.
C. CO2 Regulation (Reg.19 ~ 23 of Annex VI in MARPOL)
CO2 is very well-known as a global warming gas and has the biggest effect among GHGs like CH4, N2O and Halocarbons. According to IPCC (2014), in 2011, the total anthropogenic Radiative Forcing (RF)1 relative to year of 1750 was 2.29. An RF of
1.68 was caused by emission of CO2, which means that the CO2 emission caused 73.3% of the total global warming phenomenon caused by human activities followed by CH4 (0.97), Halocarbons (0.18) and N2O (0.17).
CO2 is formed in ships when carbon (C) in fuel meets with oxygen. Fossil fuel contains a hydrocarbon compound which is the one making works and consist of hydrogens (H) and carbons (C). The numbers of Cs and Hs determines different gases like methane (CH4), ethane (C2H6) and propane (C3H8). Refinery can be simply called separation of fuels having different average numbers of Cs. For example, on average, petrol has 8 Cs and diesel has 12 Cs (Eric Hahn, n.d.).
1 The strength of drivers is quantified as Radiative Forcing in units watts per square meter (W/m^2). RF
14
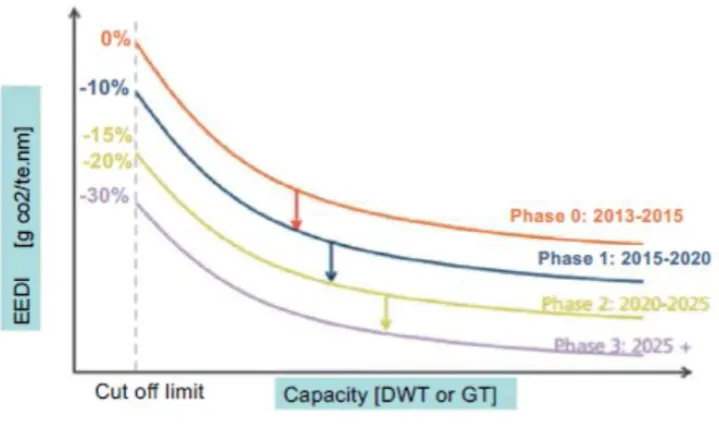
When those carbons meet oxygen in the cylinder during combustion, CO2 is generated. In order to reduce CO2 emission, using less fossil fuel, thereby improving ship’s energy efficiency or using less CO2 emitting fuel like LNG have been examined and applied. IMO regulates CO2 emission through the Energy Efficiency Design Index (EEDI) and its unit is amount of CO2 emissions / cargo ton * mile and its limits are shown in Figure 4.
Phase 1 which is the 10 % reduced index was normally achieved by slow steaming (Motorship, 2015). Ships constructed after 2020, phase 2, have to consider another method for a further 10 % reduction of CO2 emissions. Therefore, in addition to improving energy efficiency, using another fuel that emits less CO2 such as LNG would be better to consider.
Figure 4 Required EEDI
Source : Tien Ahn Tran. (2016). Calculation and Assessing the EEDI in the Field of Ship Energy Efficiency for M/V Jules Garnier. Journal of Marine Science: Research & Development. Retrieved from https://www.omicsonline.org/open-access/
15
2.2 Possible Alternative Methods
In order to comply with all the requirements which are becoming stricter as stated previously, ship owners have to identify solutions and apply them to their ships. If clean and renewable energy can be used on ships and perfectly replace current fossil fuels, it would be the best solution. They may not emit any NOx, SOx and CO2. In this section, the status of application of typical clean and renewable energy sources is examined and less pollution fuels are also studied for second string.
2.2.1 Clean and Renewable Energy source
A. Solar Energy
Solar Energy is the most promising energy and it has been used widely and
successfully in many industries on land. Photovoltaic solar panels absorb solar light
and convert it into electricity. A 9 𝑚2 panel can produce 1Kw of electrical power and
5,400 𝑚2 of panels will be needed to generate 600 Kw (Fernandez, et al., 2010). It
is clean and has an unlimited resource of energy, so it is considered as an ideal
resource.
However, solar panels cannot work at night or overcast days. Furthermore, the
panels have to be installed on exposed decks so it is not applicable to ships which
have wide openings or cargo stacks on exposed decks such as bulk carriers and
container ships. Additionally, its capacity to generate electricity is not high enough to
cover all consumers in a ship. One more critical problem is that its initial cost is very
high, more than10 times the conventional method using fossil fuel (Fernandez, et al.,
2010). In conclusion, due to its dependency on weather and low efficiency, solar
energy cannot be considered as the main energy source on a ship. The solution is
open for consideration as an auxiliary source, but it may not be attractive either
16 B. Wind energy
In general, wind energy is a clean and unlimited energy, but it is heavily reliant on
weather like solar energy, so it cannot work all the time. According to the
International Windship Association (IWSA), wind propulsion technology can save
10~30% of fuel in retrofit ship and 50% in new building ships (Allwright, 2017).
Wind energy can be used in three different ways, sails, kites and wind turbines.
Sails are a very traditional method of ship’s propulsion. According to the feasibility
studies (Fernandez, et al., 2010), 10% of additional cost is required to install the
sails on a ship and possibly saves 20~27 percent of fuel on certain routes. However,
it cannot be installed on ships with wide cargo hatches like containerships. Kites are
more feasible than sails. The kite is used at high altitude which has stronger wind
compared to on the sea surface so its efficiency is higher than sails. In order to tow
a vessel, 150~600 𝑚2of kite is needed, which means that it can generate 5 times
greater power than sails. Moreover, its initial cost is very low compared to others
and it can be installed in any type of ship. Additionally, its maintenance cost is
notably low. A more attractive method is using a wind turbine, which is very similar
to a windmill. It is widely used and mostly developed on land. However, in addition
to its continuity its weight and negative effect on a ship’s stability are the main
problems with its installation on ships. The most well-known method in wind systems
is rotors using the Magnus Effect. It has already been installed in several ships and
has proved its efficiency.
Although wind technology has improved significantly and can contribute to reducing
air emissions from ships, and even if it is developed more in the near future, it is not
a proper solution to meet the regulations because firstly, its work is dependent on
weather and secondly, current regulations for NOx and SOx emission do not much
care about renewable energy. For example, if a ship can use renewable energy for
its propulsion more than 80% of total ship operation, the power system in the ship
has to meet the latest regulation. Replacing 80 % of total propulsion power with
renewable and clean energy means that the ship can reduce 80 % of NOx and SOx
17 C. Hydrogen fuel cells
Hydrogen fuel cells is one of the most feasible methods considered as the next
alternative energy in the vehicle industry. It uses a reverse process of electrolyzing
water into Oxygen and Hydrogen. In order to operate the system continuously, it
requires only Nitrogen and Oxygen which are the most abundant matters on earth.
Therefore, it is clean energy having limitless resource. Its wastes are only water and
CO2, and the amount of CO2 emitted is significantly lower than a diesel engine.
Furthermore, its noise level is less than a quarter of a diesel engine and its size is
much smaller (Jose, et al., 2016).
One of the main problems with its use is its very high initial cost. Its investment cost
is approximately 6,000 Euros per kW which is more than 10 times higher than
conventional diesel engines. One other problem is the difficulty of providing
hydrogen continuously on a ship. Its evaporation point is lower than -250 ℃ so it
need ultralow temperature or extra-high pressure of more than 1600 bar. Producing
hydrogen on a ship, not using storage is also being developing but each way has
different technical problems at the moment (Jose, et al., 2016)
2.2.2 Less Pollution Fuels
A. Biofuel
According to the Sustainability Co-Op (DeMates, 2016), ‘Biofuel is energy made
from living matter, usually plants. Bioethanol, biodiesel and biogas are types of
biofuels.” As emission control is getting stricter, biofuels are becoming increasingly
popular due to their low emission property. A ship can reduce CO2 emissions by
80~90% and NOx emissions by 10%, and eliminate SOx emissions when it uses
biofuels as a main fuel (Konemeijer, 2016). Biofuels can significantly reduce air
pollutants and are degraded by about 85 percent in water within 14 days (Fernandez,
et al., 2010). Other benefits are low initial costs and good adaptation to conventional
18
or with minor adjustments enough. Therefore, the first methanol propulsion cruise
ship and tanker were already delivered in 2015 and 2016, and more ships are now
in operation.
However, its production cost, of course depending on type, is generally higher than
fossil fuel, and the capacity of production is very low compared to current fuel
consumption in shipping and it is not available all over the world, so it is not proper
for ships owned by Korean ship owners.
B. LNG
At the moment, LNG is considered to be the most attractive and feasible alternative fuel, especially for new building ships as emission control is getting stricter. It is already well-known that LNG produces zero percent of Sulphur dioxide emission and can reduce Nitrogen oxide up to 90 percent, particulate matter emissions by 98 percent and carbon dioxide emissions by 25 percent compared to conventional fossil fuels of ships (as cited in Xu et al, 2015). An additional factor making LNG even more attractive is that it is cheaper than current marine oil. (It is complicated to compare both prices because of the big price variation by region and lack of
commercial LNG bunkering stations) Moreover, introduction of shale gas ensures that LNG has a quantitative advantage compared to other competitors (shale gas reserves are estimated at about 7,299 trillions of cubic feet in the world (EIA, 2013)).
19
Although LNG has huge benefits compared to its competitors in terms of cleanness, there are still barriers and constraints to its becoming an alternative fuel. The first one is high CAPEX. LNG should be stored in liquid form for its economic feasibility, which is only possible under the condition of temperatures lower than – 162 degrees Celsius. As such, it induces a high cost on building a storage tank and related system in a ship. Additionally, unfamiliarity with LNG fuel systems including engine for personnel on board and shore can be barriers to its use.
C. HFO with emission abatement system
Using LNG fuel for ship’s main energy is very attractive for new building ships but not for existing ships because significant modification is necessary and it entails huge cost. This method does not require modification for engines and fuel supply system, it only needs additional installation which is comparatively cheaper than an LNG fuel propulsion system. Therefore, a system using HFO with exhaust gas treatments could be more attractive for existing ships.
At the moment, the treatment system for SOx reduction, normally called SOx scrubber, and treatment system for NOx reduction, typically EGR (Exhaust Gas Recirculation) and SCR (Selective Catalytic Reduction) are technically feasible. Scrubbers can reduce SOx emission by 90~95 percent and EGR and SCR can reduce NOx emissions by 35~80 percent and up to 95 percent respectively
(LITEHAUZ, 2013). This method can use HFO as a main fuel so, it does not require additional cost for fuel, but it needs, depending on type of scrubber, constant use of a sodium hydroxide solution, to neutralize water influenced by SOx, so it may entail high operational cost. (KR, 2017)
20
water respectively. SOx gases are naturally water soluble. SO2 and SO3 (generally 95% and 5% respectively in exhaust gas from diesel engine) become H2SO3 and H2SO4 after reaction with water. Those are very strong acids but they react with alkaline water (seawater is naturally alkaline and fresh water treated by sodium hydroxide is also alkaline) and form sodium sulfate salt which is a natural salt in the seas. (ABS, 2013)
Dry scrubbers are widely used in plants on land. Dry scrubbers can reduce NOx emissions significantly and do not generate effluents to be discharged into sea water. However, dry scrubbers create calcium sulfate, so a ship has to have significant storages on board for this calcium sulfate and chemical reactants. The chemical reactants are quiet costly. Closed wet scrubbers use a fresh water circulation system with sodium hydroxide and water treatment device. The system also requires some storage spaces like dry scrubber and both have the benefit of not contaminating seawater because they do not discharge any pollutants into sea water (IQPC, n.d.)
On the other hand, an open wet scrubbing system does not require significant storage or expensive chemical powers, because of the sea water circulating system which continuously uses sea water and discharges it over board. Of course, there are criteria for discharging water but it may cause environmental problems.
Consequently, some ports in Europe and America do not allow the discharge of the water and there is a strong possibility that more ports will prohibit it in the near future. Therefore, in order to meet the requirement, a hybrid system was developed and is mostly chosen by ship owners these days. (IQPC, n.d.).
21
2.3 Conclusion
In this chapter, alternative fuels and systems to comply with regulations in the near future were examined. They can be divided into two categories, clean and
renewable energy and less pollution fuel.
Clean and renewable energy must be the ideal alternative. It will solve the
environmental problems caused by current fossil fuels and eliminate worries about its depletion. As matter of fact, some clean and renewable energy sources are highly developed and have high enough technologies to be used as auxiliary propulsive energy but none of the energy sources are feasible to be used as a main energy source in ships due to certain limitations and matter of cost.
22
III. FEASIBLE ALTERNATIVE METHODS
3.1 Low Sulphur Fuels
Among the three feasible alternative methods, using low Sulphur fuels is the simplest one because it requires only small modifications and/or additional installations, which are almost negligible compared to the other two options. However, the major concerns are the high OPEX during ship operation and the availability of the fuels to meet the rising demand.
As mentioned earlier, the price of MGO is normally about 30~40 percent more expensive than HFO (IFO180). In consideration of the fact that fuel cost accounts for 55~65 percent of the total operational cost of ships, it must be a very high cost through ships’ lifetimes. Therefore, it makes ship owners of new building ships consider other options. However, owners of existing ships with less than several years life remaining are, in general, expected to use low Sulphur fuel because less CAPEX and higher OPEX is preferred to high OPEX and lower CAPEX, and it may lead to high demand for low Sulphur fuels and high price of low Sulphur fuels.
23
building ships and comparatively young ships can affect the price of low Sulphur fuels, so it could make the price differential great (Ned Molloy, 2016).
The other concern is the availability of low Sulphur fuels. According to MARPOL, the effective date of 0.5% of global Sulphur regulation was postponed after reviewing the availability of the required fuels. Before the last MEPC meeting, a report prepared by CE Delft on behalf of IMO was submitted to IMO to decide on the effective date and IMO decided to make it effective after 1 January 2020, which had positive result. However, another study conducted by consultants Ensys and
Navigistics, who were not hired by IMO, released opposite results. It was submitted to IMO for consideration by the International Petroleum Industry Environmental Conservation Association (IPIECA) which is an oil and gas industry group and the Baltic and International Maritime Council (BIMCO) which is one of the largest ship owner’s association. Both reports have many assumptions but with differences such as the refining capacity of Sulphur plants and priority among assumptions (Ned Molloy, 2016).
Availability of compliant fuels may change the whole marine fuel related industry. For example, if there is higher demand than supply, some regions will lack fuels, depending on regional desulphurization capacity and it will lead to change of the flow of oil transportation which is needed to change the current arrangement like location of storages, import and export structure and direction of oil flow in pipes. Although the anticipation is so important that it could change whole industry, reports from experts, including the two abovementioned reports, made different predictions because each report has different assumptions with many variables. It is very difficult to anticipate them, so it is very difficult to say that which report is correct and only time will tell.
24
The other option is LSFO. It can be divided into two categories by manufacturing method. The first one is made by removing Sulphur contents in the refining process, adding a catalyst powder to the oil which can cause severe abrasion on the cylinder liner, piston ring and fuel valve nozzles. Therefore, a cleaning process, for instance using a centrifugal purifier, and filter at the inlet to the engine should be additionally installed. The second method reduces the Sulphur content by mixing with low Sulphur contained oil. It does not have side effects like abrasion and low viscosity, and does not require additional equipment. However, when the temperature is too low, the wax components could be solidified which can block the flow in the pipes, so it should be used cautiously (KR, 2017).
3.2 HFO with Emission Abatement System
Nowadays, the number of scrubber installations has increased based on SECA regions. According to Wartsila (2016), it has installed its scrubbers on 89 ships and the total capacity was 2566 MW, and ALPA LAVAL installed scrubbers on 47 ships (Alfa Laval, n.d.). Including operation experience of other manufacturers, it can be considered that operation tests on real ship models were conducted sufficiently and it seems that the results were acceptable to shipping companies.
Among 3 types of scrubbers, choosing open type scrubbers is a little risky except for ships having fixed calling ports allowing discharge of waste water, and the closed type enetails a much higher operation cost. Moreover, ports which prohibit
discharging circulated water into their seas are increasing in number, so only hybrid type scrubber will be reviewed in this chapter.
25
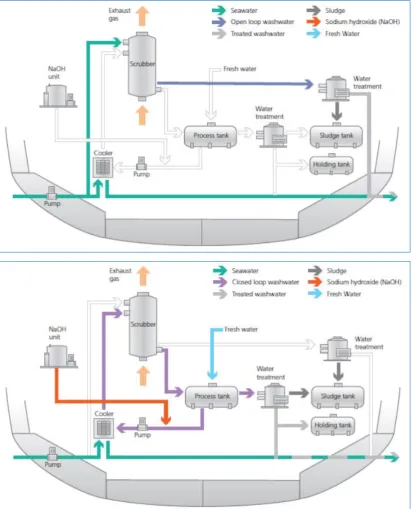
Figure 5 shows different work flows between open and closed modes in hybrid type scrubbers. In the open mode (up), a substantial amount of sea water is being
Figure 5 Hybrid Scrubber in Open Mode (up) and Closed Mode (down)
26
sucking by pumps and spraying in the Scrubbers to make a reaction with Sulphur in exhaust gas. The sea water containing Sulphur is discharged into the sea after certain treatment processes. In closed mode, sea water is still sucking but its amount is comparatively small because it is used only for heat exchange. Fresh water is kept circulating in the scrubber system with sodium hydroxide and heat occurring through the process is absorbed by sea water and the sea water is discharged into the sea. Due to the feature of each system, open scrubbers need additional power to circulate sea water and closed scrubbers need additional cost for sodium hydroxide (Lloyd Register, 2012)
There are small difference among manufactures, but the components are almost the same. The equipment is as follows;
Main scrubber unit, Water treatment, Cooler, NaOH tank, Process tank, Fresh water tank, sludge/holding tank, Pumps, Pipelines and control units.
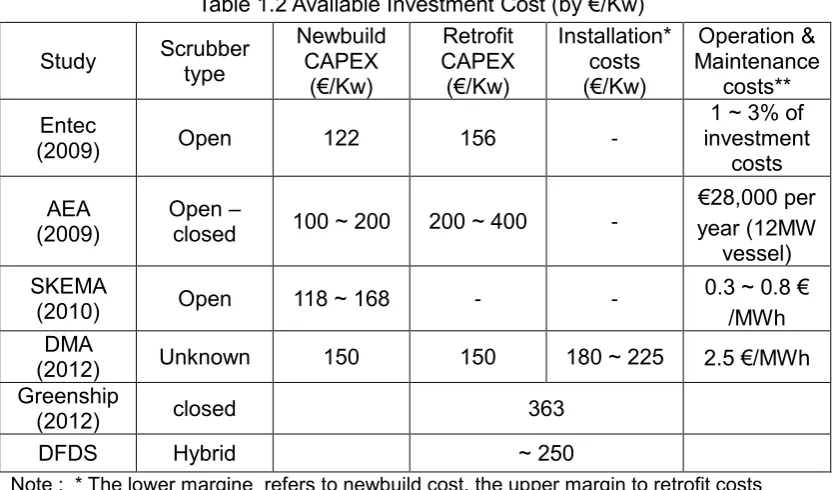
The cost of equipment and installation varies by manufacture, size of ships, type of ship and shipyard, so it is very difficult to summarize simply. For reference, real cases are shown in Tables 1.1 and 1.2.
Table 1.1 Available Investment Cost
Scrubber type Engine load CAPEX
Equipment installation
Open 11 MW 1.42 M€ 1.4 M€
Hybrid 30 MW 4 M$ 3 M$
Open/Closed/Hybrid 40 MW (Newbuild) 3/2.4/3.8 M€ (Retrofit) 3.5/3.4/4.3 M€
Open/Closed/Hybrid 20 MW (Newbuild) 2.1/1.9/2.6 M€ (Retrofit) 2.4/2.4/3.0 M€
Closed 10 MW 1.8 M$ 2 M$
Hybrid 10 MW 3.8 M$ 2 M$
Open 10 MW 3 M$ 1 M$
Source: Latun, K. (2015). SOx scrubbers; a profitable investment. Presentation during the 2015 GREEN4SEA Forum. Retrieved from http://www.green4sea.com/sox-scrubbers-a-profitable-investment/
27
Table 1.2 Available Investment Cost (by €/Kw)
Study Scrubber type
Newbuild CAPEX (€/Kw) Retrofit CAPEX (€/Kw) Installation* costs (€/Kw) Operation & Maintenance costs** Entec
(2009) Open 122 156 -
1 ~ 3% of investment
costs
AEA (2009)
Open –
closed 100 ~ 200 200 ~ 400 -
€28,000 per year (12MW
vessel) SKEMA
(2010) Open 118 ~ 168 - - 0.3 ~ 0.8 €/MWh DMA
(2012) Unknown 150 150 180 ~ 225 2.5 €/MWh
Greenship
(2012) closed 363
DFDS Hybrid ~ 250
Note : * The lower margine refers to newbuild cost, the upper margin to retrofit costs **The lower values represent large ships, the upper values represent small ships
This dissertation only considers new building ships, so problems caused by differences of required spaces for each system could be negligible.
3.3 LNG
LNG fueled ships except LNG carriers have been appearing since 2000 in Norway but the number is not high enough. According to DNVGL (Wold, 2016), 88 LNG fueled ships are in operation, 98 ships are on order, and 70 LNG-ready ships are in operation or on order. Although the number of LNG fueled ships is low, the reliability of related technology was proved by LNG carriers, so building LNG fueled ships is not new to shipyards.
The detailed system of LNG fueled ships can have differences but the key components are as follows (WPCI, 2016);
Bunkering station: the connection with the LNG bunkering facility
LNG vacuum-insulated pipe
28
LNG fuel tank
Process equipment: pressure build-up unit, evaporator and so on
LNG engine
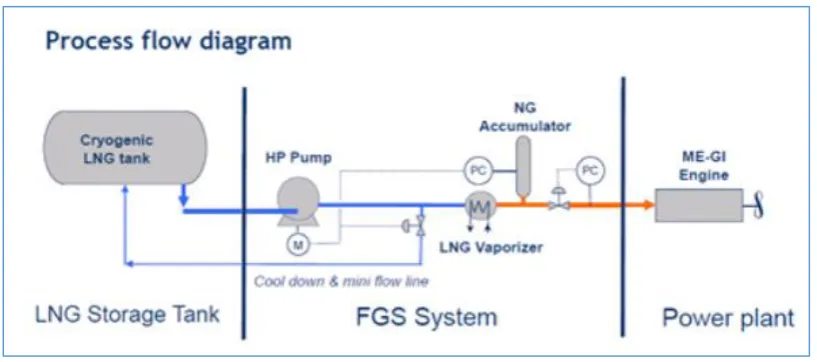
A process diagram of an LNG fueled ship, which can also, differ depending on other points, is illustrated in Figure 6.
When an LNG fueled ship is designed, two things should be decided first, type of LNG tank and type of engine because the FGS (Fuel Gas Supply) system and other ship’s arrangement have to be changed accordingly.
In accordance with the International Code for the Construction and Equipment of Ships Carrying Liquefied Gas in Bulk (IGC Code) and the International Code of Safety for Ships Using Gases or Other Low-Flashpoints Fuels (IGF Code),
‘Independent A,B and C tanks’ and ‘Membrane tank’ can be used as LNG Fuel tank. Among them, type C is mainly used, but the Membrane tank has been proposed and several contracts have been made up (WPCI, 2016). Type C tanks are simpler and easier to maintain than Membrane tanks, but its size is 2~4 times bigger than HFO
Figure 6 Process Diagram for LNG fueled system
Source: WPCI. (2016). World Ports Climate Initiative. Retrieved from
29
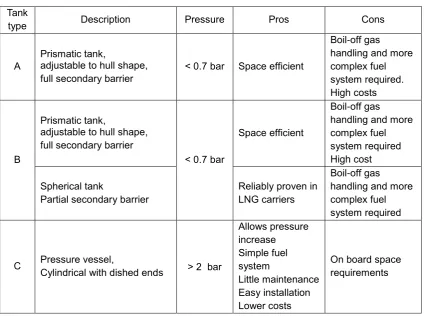
tanks in the same size of ship. It can be acceptable for a ship that has abundant free space, especially on deck, like tankers and bulk carriers, but for other ships, like container ships, it could be big problem. The pros and cons among type A,B and C tanks are listed in Table 2.
Table 2 Main characteristics of the different tank types
Tank
type Description Pressure Pros Cons
A
Prismatic tank,
adjustable to hull shape, full secondary barrier
< 0.7 bar Space efficient
Boil-off gas handling and more complex fuel system required. High costs
B
Prismatic tank,
adjustable to hull shape, full secondary barrier
< 0.7 bar
Space efficient
Boil-off gas handling and more complex fuel system required High cost
Spherical tank
Partial secondary barrier
Reliably proven in LNG carriers
Boil-off gas handling and more complex fuel system required
C Pressure vessel, Cylindrical with dished ends > 2 bar
Allows pressure increase Simple fuel system Little maintenance Easy installation Lower costs
On board space requirements
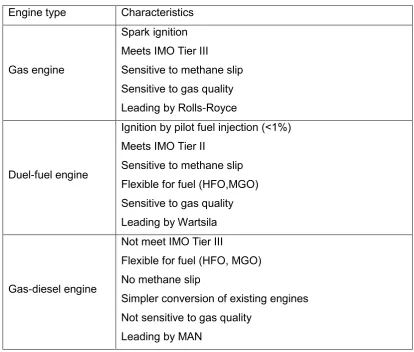
The other important factor is engine type. For the LNG carrier, a diverse propulsion system can be used such as steam turbine, gas turbine and Dual Fuel Diesel Electric system. However, for cargo ships normally ‘main engine(s) coupling with propeller shaft’ system is used and three (3) types of engines are available for LNG fuel, Gas engine, Dual-fuel engine and Gas-diesel engine, and those characteristics are shown in Table 3.
Source: WPCI. (2016). World Ports Climate Initiative. Retrieved from
30
Table 3 Main characteristics of different LNG fuel engine types
Engine type Characteristics
Gas engine
Spark ignition Meets IMO Tier III
Sensitive to methane slip Sensitive to gas quality Leading by Rolls-Royce
Duel-fuel engine
Ignition by pilot fuel injection (<1%) Meets IMO Tier II
Sensitive to methane slip Flexible for fuel (HFO,MGO) Sensitive to gas quality Leading by Wartsila
Gas-diesel engine
Not meet IMO Tier III
Flexible for fuel (HFO, MGO) No methane slip
Simpler conversion of existing engines Not sensitive to gas quality
Leading by MAN
The total number of LNG fueled cargo ships is very low and most LNG fueled ships on order books have not released their contracts, so it is difficult to know the CAPEX of LNG fueled cargo ships. In the market, the CAPEX for a LNG fueled ship will vary depending on the applied system, but the anticipation of 20 ~ 30% higher cost compared to a same sized conventional ship is dominant. (DNVGL, 2015; KRS, 2017). One of the latest contracts was made between Hyundai Samho Heavy Industries and a Russian shipping company, Sovcomflot. The contract was for 4 Aframax oil tankers and it became known that the total cost was 240 M$ and the estimated additional cost per ship compared to a conventional Aframax was 10 ~ 11 M$ (Chambers, 2017). In comparison with the price of a conventional Aframax (43 Source: WPCI. (2016). World Ports Climate Initiative. Retrieved from
31
M$ in March 2017 from Clarkson), the additional cost for an LNG fueled ship was 23.2 ~ 25.6 % higher.
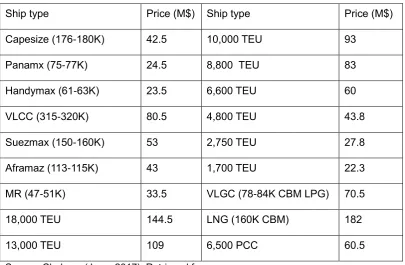
Current prices for conventional newbuilding ships are shown in Table 4. The ships are the main ships for new building currently..
Table 4 Price for Newbuilding Ships (June 2017)
Ship type Price (M$) Ship type Price (M$)
Capesize (176-180K) 42.5 10,000 TEU 93
Panamx (75-77K) 24.5 8,800 TEU 83
Handymax (61-63K) 23.5 6,600 TEU 60
VLCC (315-320K) 80.5 4,800 TEU 43.8
Suezmax (150-160K) 53 2,750 TEU 27.8
Aframaz (113-115K) 43 1,700 TEU 22.3
MR (47-51K) 33.5 VLGC (78-84K CBM LPG) 70.5
18,000 TEU 144.5 LNG (160K CBM) 182
13,000 TEU 109 6,500 PCC 60.5
Source: Clarkson (June, 2017). Retrieved from
https://sin.clarksons.net/MarketsAtAGlance#/Newbuilding
3.4 Conclusion
32
To summarize the above information, additional CAPEX for 3 feasible fuel systems are as shown in Table 5. Additional CAPEXs for LNG fueled systems are calculated as 25% of total price for conventional newbuilding ships and CAPEXs for Scrubber are assumed based on corrected data which are actual application prices.
Table 5 CAPEX for 3 fuel system (M$)
Ship type MGO Scrubber LNG Ship type MGO Scrubber LNG
Capesize 0 6.0 10.6 13,000 0 6.0 27.3
Panamx 0 4.0 6.1 10,000 0 6.0 23.3
Handymax 0 3.0 5.9 8,800 0 5.0 20.8
VLCC 0 7.0 20.1 6,600 0 4.0 15.0
Suezmax 0 6.0 13.3 4,800 0 4.0 11.0
Aframaz 0 5.0 10.8 2,750 0 3.0 7.0
MR 0 3.0 8.4 1,700 0 2.0 5.6
33
IV. OPERATIONAL EXPENDITURE
In order to estimate OPEX for ships using the three different options, it is necessary to have many assumptions because of surrounding uncertainty and unpredictability. For instance, the business related to LNG marine bunker is still at a very early stage, the number of LNG bunkering facilities in operation is insufficient and they are located in very specific areas. Additionally, the number of ships using LNG
bunkering stations is very low, so anticipation for the price of LNG as a marine fuel is very difficult.
Moreover, as mentioned earlier, the prices of LSFO, HFO and LNG are heavily dependent on the share of each option chosen by ship owners which is hardly predictable, so ship owners’ preferences can turn the whole market upside down. Even if all those uncertainties are solved, OPEX varies by ship’ size, type,
navigation area and many other factors. Consequently, it is impossible to get precise OPEX for all ships, and furthermore, it is not appropriate for this dissertation which has the purpose of comparing options by rough evaluation to consider all the factors for OPEX.
34
4.1 Location of LNG Bunkering Station and the Price
In November 2016, there were 57 LNG bunkering facilities in operation in the world excluding bunkering by trucks and LNG bunkering ships, another 36 projects building bunkering facilities had been decided and a further 35 projects were under discussion. Additionally, several LNG bunkering ships are on order book from Skangas, BominLinde and Klaipedos and TOTE/JAX LNG, and the world’s first LNG bunkering ship, M/T ENGIE ZEEBRUGGE, was delivered in early 2017 (Wold, 2016).
However, those bunkering facilities are mainly located in or near ECAs and those ships are mainly operated in or near ECAs as well. Figure 7 is not very accurate but it may be enough to represent the status of development by region.
Figure 7 is not perfectly correct. For instance, all the green colored ports are not in operation now, and some ports among the blue ports are already in operation, such
Figure 7 Global Infrastructure for LNG Bunkering
Source: SEA/LNG. (2017). Bunkering Infrastructure; More LNG Bunkering Facilities are
being built. Retrieved from
35
as the ports in Western Australia (Gas Energy Australia, 2017). But it is believed that most of the green and blue ports will be in operation before 2020, so it would be proper for shipping companies to consider their bunkering plans based on those ports. In addition, ports with LNG terminals should be also considered although they do not have plan so far because they can easily have bunkering facilities without huge expenditure and long period for the construction.
The price of LNG is different by region. In Far East Asia, the price is almost the same as in Korea and Japan, and a little different from that in China and Taiwan. However, the difference is very small excluding the cases when certain regions are affected by localized event. Figure 8 and 9 shows the flows of price by region.
As Figure 8 shows, the US shale boom made LNG prices decline after 2008 but the Fukushima accident, higher demand for cleaner energy and high oil price had brought it up until 2013 (Sund and Whitefield, 2014).
Figure 8 LNG Price by Region (~2013)
36
Figure 9 shows the trend lines of the estimated LNG landed price by region based on data from FERC. It does not show all the prices every month but it is
understandable that the price differential has been reduced and the price differential is proportional after January 2015. So, in this dissertation, fixed price differential by region will be applied to simplify the evaluation and the results based on the data in Figure 8 is shown as table 6.
Table 6 Average price of LNG and Index
Average Price since Jan. 2015 ($US/MMBtu) Index (US = 1)
US 2.944 1
Far East Asia 6.505 2.21
EU 5.706 1.94
India 6.435 2.19
Rio De Janeiro 6.454 2.19
0 5 10 15 20
Korea India Begium UK
Spain Lake Charles Cove Point Rio De Janeiro
Figure 9 LNG Estimated Landed Price by Region
37
The information for estimated landed LNG prices in other countries which produce LNG and are located near main routes of Korean ships such as the Mid-East, Malaysia, Brunei and Australia have not published in public and it is difficult to estimate. It could be done through import price to other countries like Korea and China, but they are whole sale contracts so it does not seem to be correct. However, the fact that LNG production cost in the USA is higher than in other countries and cost in the Mid-East is the lowest. Based on this fact, the estimated landed LNG prices will be assumed as shown in Table 7.
Table 7 Assumed landed LNG price
Mid-East Australia Malaysia Brunei
Price (US=1) 0.8 0.9 0.9 0.9
Estimating the future fuel prices including LNG, LSFO and HFO, as mentioned earlier, is almost impossible because too many aspects have to be considered and there is a high level of uncertainty and unpredictability. First of all, the price will heavily depend on which option among LNG, LSFO and HFO with emission abatement system is chosen by ship owners. The price of the more chosen option will increase and others will decrease. Additionally, it is very sensitive to global economic conditions.
Moreover, in perspective out of the shipping industry, the structure of energy consumption on land affects the prices. The demand for cleaner energy can boost consumption of LNG which may increase the price as happened in Japan after the Fukushima accident. In reverse, the demand may lead to breakthroughs in
renewable and clean energy like solar and wind energy. Consequently, all current fossil energy can be used less.
38
could be more unpredictable in the future due to more complicated circumstance. But it is believed that it will take time for the price of LNG as a marine fuel to be equalized by region through wholesales and until that moment the price differential will be maintained in higher than the current HFO differential.
Too many factors are involved in the price decision and it is scarcely predictable, so in this dissertation from +25 to -25 percentage variation on current price of each fuel, LNG, LSFO and HFO will be used to estimate the OPEXs.
4.2 Fuel Consumption
Based on the work done so far and current bunker prices by region, Table 8 was created and will be used to estimate the OPEX of using each fuel.
Table 8 Standard fuel price by region
Fuel East Asia (ⓐ) Australia (ⓑ) Mideast (ⓒ) USA Singapore (ⓕ) Europe (ⓖ) East (ⓓ) West (ⓔ)
MGO 500 500 550 490 450 440 430
HFO 335 400 330 350 310 330 310
LNG 6.50 2.65 2.35 2.94 2.94 2.65* 5.71
Unit: MGO/MDO=US$/ton, LNG=US$/mmbtu * Price in Malaysia
39
route in one round trip are made as shown in Table 9. For instance, in term of the Europe route, the distance from Korea to West Europe is 10,000 miles. LNG in Korea is used for Korea to Singapore (2500 miles); LNG in Singapore is used from Singapore to Yemen (3600 miles); LNG in Yemen is used from Yemen to West Europe (4400 miles); LNG in Europe is used from West Europe to Yemen; LNG in Yemen is used from Yemen to Singapore and, lastly, LNG in Singapore is used from Singapore to Korea. LNG fuel tanks for navigating the same distance as
conventional ships need to be 2~3 times largger, so the distance between bunkering ports is assumed to be shorter.
Table 9 Ratio of regional fuel by navigation routes
Route HFO MGO LNG
West USA 0.5ⓐ + 0.5ⓓ 0.5ⓐ + 0.5ⓓ 0.5ⓐ + 0.5ⓓ
East USA 0.25ⓐ + 0.5ⓓ + 0.25ⓔ
0.25ⓐ + 0.5ⓓ + 0.25ⓔ
0.25ⓐ + 0.5ⓓ + 0.25ⓔ
Australia 0.33ⓐ + 0.67ⓕ 0.33ⓐ + 0.67ⓕ 0.33ⓐ + 0.34ⓕ + 0.33ⓑ
Mid-East 0.2ⓐ + 0.5ⓕ + 0.3ⓒ
0.2ⓐ + 0.5ⓕ + 0.3ⓒ
0.2ⓐ + 0.5ⓕ + 0.3ⓒ
Europe 0.13ⓐ + 0.5ⓕ + 0.34ⓖ
0.13ⓐ + 0.5ⓕ + 0.34ⓖ
0.12ⓐ + 0.29ⓕ + 0.38ⓒ + 0.21ⓖ Southeast Asia * 0.5ⓐ + 0.5ⓕ 0.5ⓐ + 0.5ⓕ 0.5ⓐ + 0.5ⓕ
Southeast Asia ** ⓐ ⓐ ⓐ
* Routes using LNG in Malaysia, Brunei or Indonesia ** Routes not using LNG in Malaysia, Brunei or Indonesia
40
Table 10 Calorific value of each fuel
HFO MGO LNG
Calorific Value 41000 MJ/ton 45000 MJ/ton 1055.87 MJ/mmbtu Equivalence to
1 ton of HFO 1 ton 0.91 ton 38.83 mmbtu
Note: Modified the data from DNVGL. (n.d.) Future Fuels & Fuel converters; Marine Academy. Retrieved from https://www.ntnu.edu/documents/20587845/1266707380/01
Fuels.pdf/1073c862-2354-4ccf-9732-0906380f601e
Based on the information provided by NAPA Ltd. and obtained from NAPA Fleet Intelligence, actual fuel consumption (average) of different ship types and size in different routes could be achieved as shown in Table 11.1 ~ 3.
Table 11.1 Fuel Consumption of Bulk Carrier in Return
Ship Sizes Routes Navigation period (days)
Fuel Consumption (ton)
Capesize (176 ~ 180K)
USA (West) 108 3294.3
USA (East) 55 1642.1
Australia 28 929.4
Europe 99 2988.6
Mid-east 50 1467.8
South East Asia 22 603.2
Panamax (75 ~ 77K)
USA (West) 67 1345.3
USA (East) 29 637
Australia 27 430.8
Europe 88 1612.4
Mid-east 45 896.2
South East Asia 20 326.6
Handymax (61 ~ 63K)
USA (West) 64 1132.8
USA (East) 41 847
41
Europe 85 1306.7
Mid-east 39 663.8
South East Asia 18 186.7
Table 11.2 Fuel Consumption of Tanker in Return
Ship Sizes Routes Navigation period (days)
Fuel Consumption (ton)
VLCC (315 ~ 320K)
USA (West) 107 3874.3
USA (East) 57 1917.5
Australia 39 1097.2
Europe 90 4541.3
Mid-east 41 2266
South East Asia 16 819.2
Suezmax (150 ~ 160K)
USA (West) 106 2486.1
USA (East) 51 1253.7
Australia 28 801.7
Europe 90 3209.1
Mid-east 43 1358.9
South East Asia 16 518.3
Aframax (113 ~ 115K)
USA (West) 66 1595.2
USA (East) 41 1121.8
Australia 29 691.4
Europe 79 2598.7
Mid-east 40 1024.2
South East Asia 17 409.3
MR Tank (47 ~ 51K)
USA (West) 61 1164.8
USA (East) 35 1078.3
Australia 29 562.7
Europe 76 1914.7
Mid-east 42 711.8
42
Table 11.3 Fuel Consumption of Container ship
Ship Sizes Navigation period (days) Fuel Consumption (ton)
18,000 teu
(190,000 ton) 13 1,101.1
13,000 teu
(140,000 ton) 15 1,187.3
10,000 teu
(115,000 ton) 14 1,014.5
8,800 teu
(100,000 ton) 16 1,128.4
6,600 teu
(84,700 ton) 17 1,107.1
4,800 teu
(57,700 ton) 16 846.9
2,750 teu
(35,500 ton) 17 758.8
1,700 teu
(23,000 ton) 20 691.8
Fuel consumptions in red color are achieved through assumption and rough calculation based on actual fuel consumption of the ships having similar conditions because there are many routes for certain types and sizes of ships that are not profitable or lack proper cargo trade. Additionally, cases of container ships were calculated at an average of 15 days navigating because each ship has a different number of calling ports and the fuel consumption varies depending on the number of calling ports.
Moreover, navigation period and its fuel consumption can be different depending on which and how many ports were chosen for the calculation, but it can be
43
year and ships having a long period for one round trip will be reverse. Using the information in Table 11 with the assumption of a 10 months operation period per year, annual fuel consumptions were obtained as shown in Table 12.
Table 12 Annual fuel consumption
USA (West)
USA
(East) Australia Mideast EU
SE Asia
Bulk
Capsize 10,961 9,076 10,091 8,924 9,178 8,335
Panamax 6,104 6,678 4,851 6,054 5,570 4,964 Handy 5,381 6,280 3,636 5,174 4,673 3,153
Tanker
VLCC 11,007 10,227 8,553 16,802 15,340 15,565 Suezmax 7,130 7,473 8,704 9,607 10,839 9,848
Aframax 7,348 8,318 5,899 7,784 10,000 7,319
MR 5,805 9,366 5,899 5,152 7,659 4,961
Container
18,000 25,748
13,000 23,746
10,000 21,739
8,800 21,372
6,600 19,537
4,800 15,879
2,750 13,390
1,700 10,377
Unit: ton
4.3 Conclusion
44
Table 13.1 Total Cost for USA (West) Route
USA (West)
LNG Scrubber
MGO
Fuel Others CAPEX Fuel Others CAPEX
Bulk
Capsize 52.5 6.4 10.6 112.6 6.3 6.0 148.1
Panamax 29.2 3.7 6.1 62.7 4.2 4.0 82.5
Handy 25.8 3.5 5.9 55.3 3.2 3.0 72.7
Tanker
VLCC 52.7 12.1 20.1 113.1 7.4 7.0 148.7
Suezmax 34.2 8.0 13.3 73.3 6.3 6.0 96.4
Aframax 35.2 6.5 10.8 75.5 5.3 5.0 99.3
MR 27.8 5.0 8.4 59.6 3.2 3.0 78.4
Container
18,000 123.3 21.7 36.1