RAINFALL RUNOFF CALCULATOR WITH MATLAB
Yogesh N Saraf
1, Shruti N Pawar
2, Alok P Jadhav
3 1,2Civil Engineering Department, V.J.T.I., Mumbai (India)
3
Civil Engineering Department, D.Y. Patil College of Engg., Akurdi, Pune (India)
ABSTRACT
Rainfall-runoff analysis is very important and challenging area of research. The issue becomes more crucial and difficult as population grows in particular city. The semiarid area of western Maharashtra province is an important grain production base in India, in the area the nature characteristics is small quantity and concentrate distribution in rainfall, and agriculture development was restricted by drought and soil and water loss seriously. Surface runoff not only leads to rainfall use efficiency decrease, it is also the important factor which causes soil erosion. The objective of this paper is to review the different forecasting algorithm algorithms of rainfall- runoff modelling. This paper find out pros and cons of these algorithms and suggest framework of new algorithm for Rainfall-runoff modelling which gives better water consumption.
Keywords: ANN, MATLAB, Neural Networks, Rainfall Runoff Modelling, Water Harvesting,
Computation of Runoff.
I. INTRODUCTION
The rainfall-runoff relationship is one the most complex hydrological phenomenon due to the tremendous
spatial and temporal variability of watershed characteristics and rainfall patterns as well as a number of
variables involved in the physical processes. Also, this process is non-linear in nature and thus difficult to arrive
at explicit solutions. The runoff needs to be estimated for efficient utilization of water resources.
Hydrological Model is a simplified representation of natural system. We can say that “A model is a collection of
symbols, which represents the system in a concise form that works as a representation of natural system or some
aspect of it”. The rainfall-runoff calculator is one of the most frequently used events in hydrology. It determines
the runoff signal which leaves the watershed from the rainfall signal received by the basin. Numerous methods
have been developed by different researchers to simulate the rainfall-runoff process. Although a variety of
rainfall- runoff models are available, selection of a suitable rainfall-runoff model for a given watershed is
essential to ensure efficient planning and management of watersheds. In order to estimate runoff from rainfall
events, loss rate or infiltration parameters for the basin have to be calculated. The infiltration capacity of the
basin depends on the land use and soil property.
The rainfall-runoff plays a significant role in water resource management planning and hydraulic design.
Several attempts have been made to model the non-linearity of the rainfall–runoff process, arising from intrinsic
non-linearity of the rainfall–runoff process and from seasonality.
These rainfall-runoff models generally fall into these broad categories; namely, black box or system theoretical
models, conceptual models and physically-based models. Black box models normally contain no physically
Conceptual rainfall-runoff models usually incorporate interconnected physical elements with simplified forms,
and each element is used to represent a significant or dominant constituent hydrologic process of the rain-
fall-runoff transformation. A dimensional analysis technique has also been developed and used to obtain mean
annual flood estimation in several Indian catchments.
In recent year, applications of Artificial Neural Network (ANN) has become increasing popular in water
resources and have been used in various fields for the prediction and forecasting of complex nonlinear
processes, including the rainfall-runoff phenomenon. Many studies have demonstrated that the ANNs are
excellent tools to model the complex rainfall–runoff process and can perform better than the conventional
techniques. However, many a times, less attention is given to simplify the ANN structure.
1.1 Nature of the problem:
The runoff mainly occurs in the hilly regions. The soil type also affects the runoff i.e. if the soil is laterite, it
doesn‟t allow the water to percolate inside & allows to flow. So the rainwater is not absorbed or percolated
under the ground surface. As the rainwater is not stored, the runoff occurs in a large quantity & the ground water
table decreases. As the ground water table decreases, the people staying in such a region don‟t get water in the
period of March to half of the June is known as the Dry Season.
Hence, in order to avoid or prevent such effective runoff, it becomes necessary to calculate the estimated runoff
value first. In conventional methods it is tedious to perform peak runoff calculations. Therefore the thought
comes in mind to have an alternative method to calculate the runoff value in an easier way, which will perform
all calculations within a fraction of second.
1.2 Objectives:
i. To develop a rainfall-runoff calculator with MATLAB.
ii. To study MATLAB software and it‟s coding/programming.
iii. To study rainfall-runoff relationship in brief.
1.3 Present Study:
We are designing „Rainfall-runoff calculator with MATLAB‟ and its coding. We are studying software which is
much more useful for calculation of runoff values from the given data of rainfall. On the basis of the runoff
results, proposed remedies can be adopted to reduce the runoff in urban as well as in forest areas.
II. COMPUTATION OF RUNOFF
[1]As pointed out earlier, the entire rain water falling over the surface of the earth does not reach the surface
streams and river channels. A certain part of this water is lost to the atmosphere through evaporation or
transpiration, and certain part which infiltrates into the soil into the soil is lost to the ground water reservoir. The
remaining water, called the surface runoff, flows and joins the surface streams. However, the total flow or runoff
in a surface stream is the combination of surface runoff and the runoff derived from the underground water,
called base flow. This total flow in the stream called runoff or stream flow or discharge is very important, and
has to be evaluated, because it directly tells us the amount of water available in the surface source, and hence
1.1 Fundamental equation for Computation of Runoff (Volume or Depth on a Given Area):[2]
The process of runoff has already been discussed in a previous article. It was stated there: that the rain is, first
of all, intercepted as interception (P_i), then sorted in depressions as depression storage (P_i), and then used in
removing the soil-moisture deficiency. All this has to be accomplished before any stream flow or ground water
accretion can start. The amount of precipitation required to fulfil these needs generally termed as initial basin
recharge and may be denoted by L. It includes P_i, S_d and rain absorbed by the soil moisture deficiency,
which depends upon the prevailing soil moisture conditions at the time of rain, Initial basin recharge is,
therefore, the water withheld within the basin before the precipitation starts contributing to the steam flow or
the ground as ground water accretion the basin (L) us filled up, the water will infiltrate into the ground as
ground water accretion (G), and excess water will flow as direct runoff (Q).
The total precipitation (P) on a basin can, therefore, be easily represented by the equation
P = L + G + Q
Or Q = P – L – G
i.e. Runoff = Precipitation – Initial Basin recharge – Ground water accretion.
1.2 Methods Used for Computing Runoff:
a) Runoff Coefficient Method[2]:
Q = KP
Where, Q = Runoff
P = Precipitation
K =A constant having a value less than 1 or at most equal to 1. The value of K depends upon
the imperviousness of the drainage area. Its value increases with the increase in,
imperviousness of the catchment area, and may approach unity (1.0) as the area becomes
fully impervious.
b) Infiltration Curve (IC) Method[2]:
Fig no. 1: Infiltration Curve (Fig No. 7.85. IE & HS- Santosh K Garg) [2]
The infiltration capacity curve is a plot of the infiltration capacity against time, if the I.C. curve is superimposed
on the rainfall hyetograph, the resultant amount will represent nothing but the runoff, as show in figure.
The above method can be used very easily, if the rainfall rate never falls below the infiltration capacity rate. But
natural rains of varying intensities, sometimes below and sometimes above the prevailing infiltration capacity,
if a rain begins at low rates, and the rainfall during the first hour is two-third of the infiltration in one hour, the
capacity rate at the end of the hour will be taken as the capacity that would have prevailed at t=2/3 hr and not at
t =1 hr.
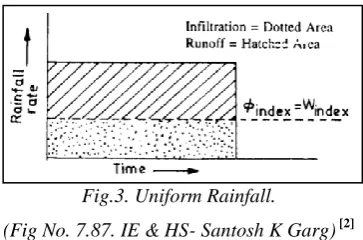
c) Using Infiltration Indices[2]:
and are the two indices which are commonly used.
Fig no 2: Infiltration Indices (Fig No. 7.86. IE & HS- Santosh K Garg) [2]
Where, F = Total infiltration including initial basin recharge, called potential infiltration.
P = Total precipitation.
Q = Total runoff.
= Duration of rainfall in hr.
It can be from this figure that Index would be equal to:
Whereas,
and will evidently be equal for a uniform rain of the type shown in Fig., but
they would not be equal for a non-uniform rain of the type shown in Fig.
Fig.3. Uniform Rainfall.
(Fig No. 7.87. IE & HS- Santosh K Garg) [2]
However, for rains which are reasonably uniform or for heavy rains, these indices are found to be nearly equal.
But in a usual case of moderate rain of non-uniformed intensity, the Index will be somewhat higher than
Windex. These indices will change with a change in interception, depression storage, and initial soil moisture.
merely measure of potential basin recharge, which is sometimes, called potential infiltration, and includes infiltration as well as initial basin recharge.
The runoff coefficient K can be determined, if the value of Windex is known, by using the equation,
d) Inglis Formula[2]:
This formula is generally used for southern parts of India, for estimating runoff. It is expressed as,
...For Hilly Catchments.
….…..For Plain Areas.
e) Khosla’s Formula[2]:
This general formula can be used for any catchment, and is applicable to both India and U.S.A., where the
rainfall is fairly uniformly distributed throughout the year, this formula is very useful, and states that,
………..When, > 4.5 deg. C.
Where, Q = yearly or monthly runoff in cm
P = yearly or monthly rainfall in cm
= mean yearly or monthly temperature in degree centigrade.
III. ANN MODELLING
This could be treated as the core of this research. Artificial neural network compiled with the hypothesis of
irrigation engineering using Matlab sums up the entire research. The modelling took place in following seven
steps:
3.1 Collection of Data:
The data collection for the purpose of estimating runoff happens outside the neural network toolbox manually.
The real time data was collected from MERI, Nashik. The data was sorted in two parts of each 30% and 70%
respectively. The 30% data was neatly left beside for future testing. And 70% data was used to train the ANN
Model. The data collected was actually the data of different rain gauge stations, few were recording type and
few were non-recording type. The data was purely the depth of rainfall occurred in the respective catchment
areas of Maharashtra State.
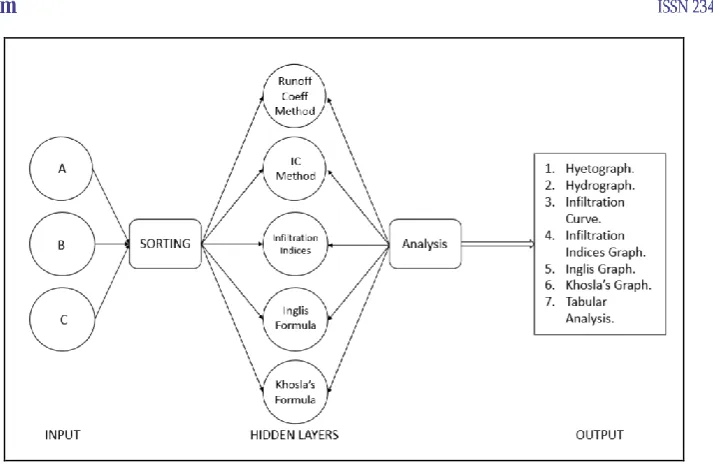
3.2 Create a Network:
Designing the architecture of any neural network is considered as the assessment point in order to evaluate the
scale of integration of the research application. The input consists of the rainfall in mm for each particular day
and place. The number of inputs are then sorted by their respective place (different formulae are used for
different site conditions viz. urban, hilly or forest areas. It is divided based on different ground infiltration
conditions). The hidden layer system consists of five different formulae and their computation. Furthermore, the
analysis tab is solely dedicated to the sorting and representation of data in graphical and tabular format. It is also
Fig no: 4: ANN Architecture (Source: Self)
3.3 Configure the Network[3]:
The configuration of inputs and ultimate outputs must be done in order to maintain accuracy of the analysis.
After a neural network has been created, it must be configured. The configuration step consists of examining
input and target data, setting the network's input and output sizes to match the data, and choosing settings for
processing inputs and outputs that will enable best network performance. The configuration step is normally
done automatically, when the training function is called. However, it can be done manually, by using the
configuration function. For example, to configure the network you created previously to approximate a sine
function, issue the following commands[4]:
p = -2:.1:2;
t = sin(pi*p/2);
net1 = configure(net,p,t);
3.4 Initializing the Weights and Balances:
This step consists of assigning the weights and balances in the five equations according to their importance and
adaption in India. In this project, Khosla‟s formula has given the highest weightage since it is cited as the most
reliable method of determining runoff in Indian terrain conditions. In this project, the weight of the each formula
does nothing but only set preference of begin and representing the analysis. Furthermore, the weighted average
has been computed in order to draw the hyetograph from the given rainfall and runoff values. The complexity
involves in taking the runoff values with their weighted averages whereas rainfall values are straight away taken
from input.
3.5 Training Network:
This step involves operating the MATLAB model with the 70% data as discussed in collection of data part. This develops and set neurons of artificial neural network in such a fashion that they behave exactly as the human
brain could have assessed the data. The main advantage of using ANN network is saving the time taken to
scrutinize the huge amount of data with more than three parameters at single source. This topic describes two
different styles of training. In incremental training the weights and biases of the network are updated each time
are presented. The batch training methods are generally more efficient in the MATLAB environment, and they
are emphasized in the Neural Network Toolbox software[5], but there some applications where incremental
training can be useful, so that paradigm is implemented as well.
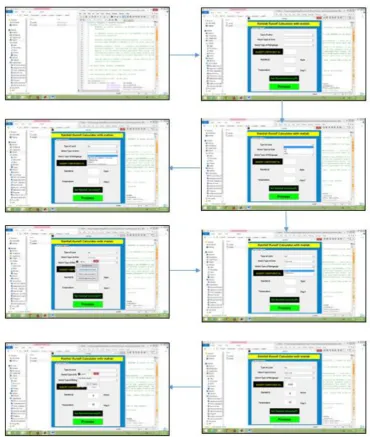
3.6 Validating Network:
This is the step where we test the remaining 30% real time data at once to judge the reliability of the project.
The data is brought in such a way that the ultimate output of the data was already known. Then this output is
cross checked with the MATLAB output. In this project, the network was validated by the experienced
professors in V.J.T.I. The model was unexceptionally useful in order to get the real time data analysis which is
further used to analyse the runoff occurring in particular area. The software model has been validated using the
graphs and tables in output as results. The screenshots below could help explain the working of actual software:
Input:
Output:
Fig no: 6: Output of MATLAB ProgramUsing Network:
The ready model is now open for all to use it over the real time or arbitrary data. The network is based on the
principles of neural computing. The results shown are purely analytical.
IV. REMEDIAL MEASURES:
Most of researchers often miss the crucial section of the research i.e. to suggest the parameters to overcome the
statement of problem discussed in the paper. It assures the full-fledged implementation of the research work.
Few remedial measure as collectively referred from internet and few references are divided according to land
type as follows:
a) Forest Areas[6]: Continuous Contour Trenches, Vegetative Contour and Graded Bunding, Bench Terracing,
Live Check Dams, Brush Wood Dams, Earthen Structure, Loose Boulder Structure, Gabion Structures.
b) Cultivated Areas[6]: Replace lawn areas with native plants, Add Organic Matter to your Soil, Create a
Rain-Garden, Reduce the slope of your yard, Install Berms and Vegetated Swales.
c) Urban Areas[7]: Bio-retention, Detention Pond, Grass Lined, Infiltration Trenches, Permeable Pavements,
Sand Filter.
d) Single Family Residence in Urban Areas[7]: Cisterns, Green Roofs, Rain Barrels, Rain Garden.
V. CONCLUSION
India has a very wide range of non-uniform rainfall. And to calculate runoff from these non-uniform values
calculate runoff within a flash of second and results will be more accurate as compared to other conventional
methods.
Thus, after knowing the actual runoff value, the question arises about remedial measures to control or simply
prevent runoff and let it being used for other psurposes. After studying books, nature of terrain and other
available resources we have chosen some effective remedial measures to control runoff which are given in the
chapter-Remedial Measures.
VI. ACKNOWLEDGEMENT
Working on the project “Rainfall-Runoff Calculator with Matlab” has been a grateful experience for us. This
acknowledgement is our sign of gratitude, we feel towards all the persons who guided and helped us to make
this project, a rich exposure, as without their guidance we should not have done so far. Our project
“Rainfall-Runoff Calculator with Matlab” is not just a mere project but the detailed study of the rainfall and the runoff
process. The project also includes a MATLAB based model for calculating runoff and remedial measures to
prevent runoff. In this project we have studied various journals, papers on rainfall-runoff modelling, MATLAB
which have done a great work in this field. This project has already given the remedial measures to minimise or
avoid the future runoff in any particular region. We, all would like to express our gratitude to Director O.G.
Kakde and Dr. Sumedh Mhaske, Associate Professor and Head, Civil and Environmental Engineering
Department, for giving an opportunity to develop our technical knowledge. We would like to thank Prof. A. P.
Gorkar for helping in understanding several concepts from this project, Prof. Smita Varade for giving direction
to achieving goal of the project at the initial stage. We would specially thank our project guide Prof. Jyoti Nimje
for timely completion of our project.
REFERENCES
[1] Santosh Kumar Garg, Water supply engineering (Khanna Publishers, 22nd Edition, 2013, New Delhi).
[2] Santosh Kumar Garg, Irrigation engineering and hydraulic structures (Khanna Publishers, 27th Edition,
2013, New Delhi).
[3] Manish Kumar Goyal, Chandra Shekhar Prasad Ojha, “Analysis of Mean Monthly Rainfall Runoff Data
of Indian Catchments Using Dimensionless Variables by Neural Network”, Journal of Environmental
Protection, April 2nd, 2010, vol. 1, 155-171.
[4] Dilip Kumar, Rajiv Kumar Bhattacharyya, “Distributed Rainfall Runoff Modelling”, International
Journal of Earth Sciences and Engineering ISSN 0974-5904, Volume 04, No 06 SPL, October 2011,
270-275.
[5] Sobri Harun (Ph.D.) & Nor Irwan Ahmat (M. Engg.), “Rainfall-Runoff Modelling Using Artificial
Neural Network”, Department of Hydraulics and Hydrologic Faculty of Civil Engineering, University
Technology, Malaysia, 81310 UTM Skudai, Johor, Malaysia.
[6] A. K. Dwivedi, “Domestic Rooftop Water Harvesting”, ARPN Journal of Engineering and Applied
SciencesVOL. 4, NO. 6, Aug 2009, Dhule, India.
[7] R. K. Sivanappan, “Rain Water Harvesting, Conservation and Management Strategies for Urban and
Rural Sectors”, National Seminar on Rainwater Harvesting and Water Management, 11-12 Nov. 2006,