University of Pennsylvania
ScholarlyCommons
Publicly Accessible Penn Dissertations
1-1-2012
Factors Governing the Performance and Stability of
Solid Oxide Fuel Cell Cathodes Prepared by
Infiltration
Rainer Küngas
University of Pennsylvania, [email protected]
Follow this and additional works at:http://repository.upenn.edu/edissertations
Part of theChemical Engineering Commons,Mechanics of Materials Commons, and theOil, Gas, and Energy Commons
Recommended Citation
Küngas, Rainer, "Factors Governing the Performance and Stability of Solid Oxide Fuel Cell Cathodes Prepared by Infiltration" (2012).
Factors Governing the Performance and Stability of Solid Oxide Fuel Cell
Cathodes Prepared by Infiltration
Abstract
Infiltration method, developed at the University of Pennsylvania, is a unique analytical platform for
investigating the effect of material properties and electrode microstructure on the performance of solid oxide fuel cell (SOFC) electrodes. During cell fabrication by infiltration, the ion-conducting electrolyte phase is sintered first, followed by the addition of the catalytically active perovskite phase into the pores of the electrolyte. The use of separate sintering steps for the electrolyte and the active phase gives one a high degree of control over the microstructure of both phases, unattainable with traditional fabrication methods. In this thesis, the infiltration approach has been used to conduct a systematic investigation into the factors that govern the performance and stability of solid oxide fuel cell cathodes. As a result, a number of microstructural and material properties, crucial for obtaining high electrode activity, were identified. In particular, the effect of varying the ionic conductivity of the porous electrolyte, the specific surface area of the perovskite as well as the specific surface area of the porous electrolyte, and the effect of solid-state reactions between the two phases were studied and were found to significantly affect performance. The experimental findings agreed well with the predictions of a mathematical model that was developed to describe the electrochemical
characteristics of SOFC composite cathodes.
Both theoretical and experimental evidence suggests the performance of SOFC cathodes prepared by infiltration is limited by slow oxygen adsorption on the perovskite surface. The chemical composition of the perovskite surface therefore plays an important role in determining the overall performance of the electrode. The last chapter of this thesis introduces a novel method that may allow one to characterize the active sites on the perovskite surface under SOFC cathode operating conditions (600-700°C, ambient air atmosphere, polarization), unattainable with traditional surface characterization techniques.
Degree Type Dissertation
Degree Name
Doctor of Philosophy (PhD)
Graduate Group
Chemical and Biomolecular Engineering
First Advisor Raymond J. Gorte
Second Advisor John M. Vohs
Keywords
Subject Categories
FACTORS GOVERNING THE PERFORMANCE AND STABILITY OF
SOLID OXIDE FUEL CELL CATHODES PREPARED BY INFILTRATION
Rainer Küngas
A DISSERTATION in
Chemical and Biomolecular Engineering
Presented to the Faculties of the University of Pennsylvania in Partial Fulfillment of the Requirements for the
Degree of Doctor of Philosophy 2012
Supervisor of Dissertation Co-Supervisor of Dissertation
___________________________ ____________________________ Raymond J. Gorte, Professor, CBE John M. Vohs, Professor,CBE
Graduate Group Chairperson
____________________________
Raymond J. Gorte, Professor, Chemical and Biomolecular Engineering Dissertation Committee
Acknowledgements
First, I would like to thank my advisor, prof. Ray Gorte, for his guidance throughout my studies. It is largely due to his teachings in the lab as well as in class that I learnt how to think like an engineer. I also wish to thank prof. John Vohs, my co-advisor, for helpful discussions and encouragement.
Life in graduate school would not have been the same without my colleagues and friends. I particularly wish to thank Lawrence for always being there for discussions, Kwadwo, for being my number one partner on the squash court, and Andrea, for introducing me the Philadelphia art scene. I am very grateful to Fred who taught me the techniques in the lab that I ended up using throughout my studies.
In addition, I wish to thank the Fulbright Science and Technology Award and the US Department of State for giving me the opportunity to spend time among some of the brightest brains on the planet.
ABSTRACT
FACTORS GOVERNING THE PERFORMANCE AND STABILITY OF SOLID OXIDE FUEL CELL CATHODES PREPARED BY INFILTRATION
Rainer Küngas
Raymond J. Gorte, John M. Vohs
electrolyte, and the effect of solid-state reactions between the two phases were studied and were found to significantly affect performance. The experimental findings agreed well with the predictions of a mathematical model that was developed to describe the electrochemical characteristics of SOFC composite cathodes.
Table of Contents
Chapter 1. Introduction 1
1.1 Motivation 1
1.2 Solid Oxide Fuel Cells 2
1.3 Traditional SOFC materials 5 1.3.1 Yttria-stabilized zirconia 5
1.3.2 Ni/YSZ 7
1.3.3 Sr-doped LaMnO3 7
1.3.4 Current collector materials 8
1.4 State-of-the-art 8
1.5 Perovskite cathode materials 11 1.6 The effect of microstructure 14 1.7. Surface exchange versus bulk diffusion limitation 18
1.8 References 26
Chapter 2. Effect of the Ionic Conductivity of the Electrolyte in Composite SOFC Cathodes
38
2.1 Introduction 38
2.2 Experimental 42
2.3 Results 44
2.4 Discussion 60
2.5 Conclusion 62
Chapter 3. Restructuring Porous YSZ by Treatment in Hydrofluoric Acid
for Use in SOFC Cathodes 70
3.1 Introduction 70
3.2 Experimental 73
3.3 Results and discussion 76
3.4 Conclusion 90
3.5 References 90
Chapter 4. Evidence of Surface Exchange Limitation in SOFC Cathodes Prepared by Infiltration
95
4.1 Introduction 95
4.2 Experimental 97
4.3 Results and discussion 98 4.3.1 Model calculations 98 4.3.2 Effect of perovskite microstructure 103 4.3.3 Effect of electrolyte microstructure 109 4.3.4 Effect of the ionic conductivity of the porous electrolyte 112
4.4 Conclusion 113
4.5 References 114
Chapter 5. Doped-Ceria Diffusion Barriers Prepared by Infiltration for Solid Oxide Fuel Cells
119
5.1 Introduction 119
5.2 Experimental 123
5.3 Results and discussion 124
5.5 References 139
Chapter 6. Atomic Layer Deposition to Investigate Surface Reactions in SOFC Cathodes Prepared by Infiltration
144
6.1 Introduction 144
6.2 Experimental 146
6.3 Results and discussion 149 6.3.1 Surface limitation in LSF-YSZ cathodes 149 6.3.2 Effect of sub-nanometer oxide coatings to electrode f
performance 156
6.4 Conclusion 160
6.5 References 162
List of Tables
Table 3.1 BET specific surface areas (m2/g) of the samples made using graphite as the pore former for the YSZ scaffold. 83
Table 4.1 Summary of the effect of calcination temperature on the BET surface area and electrochemical properties of LSF-YSZ symmetric
cells. 107
Table 4.2 Summary of the BET surface areas of porous electrolyte scaffolds, and ohmic and polarization resistances of corresponding LSF-YSZ symmetric cells tested in air at 973 K and treated at 1123 K or 1373
K. 111
Table 4.3 Summary of ionic conductivity of the electrolyte, ohmic and polarization resistance of LSF-stabilized zirconia symmetric cells tested in air at 973 K. 113
Table 5.1 BET surface areas of an empty YSZ scaffold and 20-wt% SDC in YSZ composite, shown as a function of SDC calcination
List of Figures
Figure 1.1 The operating principle of a solid oxide fuel cell 3
Figure 1.2 Schematic representations of a) an electrolyte-supported high-temperature SOFC (‘first-generation SOFC’), b) an anode-supported intermediate temperature SOFC (‘second-generation SOFC’). 6
Figure 1.3 The unit cell of a) undoped LaFeO3 with a perovskite structure, and
b) Sr-doped LaFeO3. 12
Figure 1.4 Cell fabrication by tape-casting and infiltration. 16
Figure 1.5 Effective oxygen exchange rate constant k at 700°C, p(O2) = 0.2 bar,
measured on thin film electrodes with different compositions, plotted as a function of the bulk oxygen vacancy concentration. 20
Figure 1.6 Atomic layer deposition: steps in the TMA/water process. 25
Figure 2.1 SEM images of porous stabilized zirconia scaffolds: (a) YSZ, (b)
ScSZ, and (c) YAZ. 45
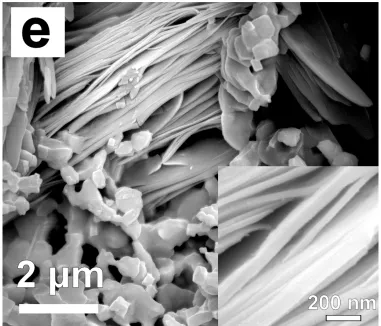
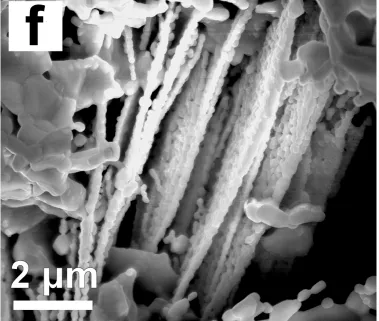
Figure 2.2 SEM images of porous 35-wt% LSF-SZ electrodes calcined to 1123 K: (a) LSF-ScSZ, (b) LSF-YSZ, and (c) LSF-YAZ; and 1373 K: (d) LSF-ScSZ, (e) LSF-YSZ, and (f) LSF-YAZ. 46
Figure 2.3 Polarization i-V curves for of LSF-SZ-LSCM,CeO2,Pd fuel cell
single cells with different electrolyte scaffolds after calcination to 1123 K, measured at 973 K. 49
Figure 2.4 Electrochemical impedance spectra of LSF-SZ-LSCM, CeO2, Pd
fuel cell single cells with different electrolyte scaffolds after calcination to 1123 K, measured at 973 K in ambient air and open
circuit conditions. 50
Figure 2.5 Comparison of experimental data, calculated from the high-frequency intercepts of fuel cell Cole-Cole plots, and literature values for the conductivity of the three electrolyte materials studied. 52
Figure 2.8 Log-log plot of the ionic conductivity of the electrolyte material vs the polarization resistance of the cathode symmetric cells calcined to either 1123 K (closed symbols) or 1373 K (open symbols) tested at
open circuit conditions at a) 873 K, b) 923 K, and c) 973 K. 57
Figure 3.1 SEM images of porous YSZ scaffolds: (a) A low magnification image of the graphite-prepared YSZ before HF treatment; (b) a high magnification image of the sample in a); (c) a high magnification image of the PMMA-prepared YSZ structure; (d) a low
magnification image of the graphite-prepared YSZ after HF
treatment; (e) a high magnification image of the sample in d); (f) an
image of the sample in e) after 4 h treatment at 1373 K. 77
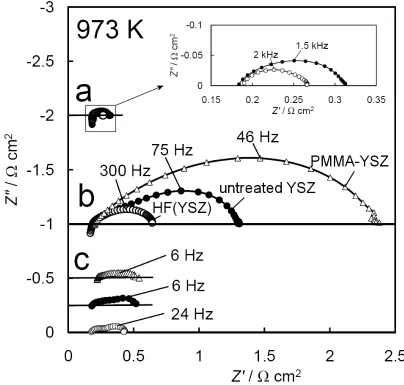
Figure 3.2 Electrochemical impedance spectra of LSF-YSZ symmetric cells at 973 K: a) At open circuit, after calcination of the composites to 1123 K; b) at open circuit, after calcination of the composites to 1373 K; c) at a current density of 400 mA/cm2, after calcination to 1373 K. 85
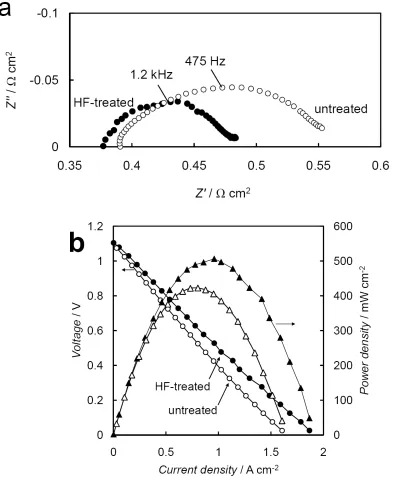
Figure 3.3 Electrochemical testing results of an SOFC single cell with an LSF-YSZ cathode and a 1-wt% Pd – 45-wt% CeO2 anode at 973 K in
humidified (3% H2O) H2. Electrochemical impedance spectra at
OCV conditions for HF-treated sample (filled symbols) and untreated sample (open symbols) are shown in (a) and corresponding
V-i and P-i curves are shown in (b). 88
Figure 3.4 A schematic illustrating the changes in microstructure of two different LSF-YSZ composites.
89
Figure 4.1 SEM images of an LSF-YSZ composite electrode (a,b) and the simplified microstructure considered in the model (c).
99
Figure 4.2 Magnified region from Fig. 4.1c: rate-limiting steps considered in the model and corresponding expressions for oxygen flux, JO2, and
current flux, iS”. 101
Figure 4.3 The microstructure of La0.8Sr0.2CoO3-YSZ composites as a function
of calcination temperature: a) SEM images and illustrating schematic drawings of the perovskite structure, b) the corresponding particle size distributions as determined by image analysis. 104
Figure 4.5 SEM micrographs of YSZ scaffolds prior to infiltration with LSF: (a) PMMA-YSZ, (b) YSZ, and (c) HF-treated
graphite-YSZ. 110
Figure 5.1 Schematic comparison of traditional (a) and proposed (b) approach to preparing SDC diffusion barrier layers. 122
Figure 5.2 The microstructure of a) the YSZ matrix and YSZ-SDC composites with 20-wt% SDC fired to b) 1373 K, and c) 1473 K. The result of an EDX scan along the path A-B is shown in d). 126
Figure 5.3 XRD patterns of the SDC/YSZ composite calcined to a) 973 K, b) 1373 K, c) 1473 K, d) 1523 K, and e) 1573 K: (◊) YSZ, (∆) SDC, (●) Ce2Zr3O10. 131
Figure 5.4 XRD patterns of blank YSZ (a), YSZ (b-e), and LSCo-SDC/YSZ (f) composites. Calcination temperatures: b) 973 K, c) 1123 K, d) 1273 K, e) and f) both 1373 K. (◊) YSZ, (∆) SDC, (o) LSCo, (♦) La2Zr2O7, (■) SrZrO3. 133
Figure 5.5 Electrochemical impedance results for LSCo-YSZ (filled symbols) and LSCo-SDC/YSZ (open symbols) symmetric cells at 973 K and ambient air conditions. The LSCo calcination temperature was 973 K for a) and b) and 1373 K for c) and d). 135
Figure 5.6 SEM images of an LSCo-SDC-YSZ electrode calcined to (a) 973 K, and (b) 1373 K. The composition of point marked with open circles in (a) were determined by EDX. 137
Figure 6.1 Scanning electron microscopy images of LSF-YSZ electrodes prepared by infiltration after calcination to (a) 1123 K and (b) 1373
K. 150
Figure 6.2 Nyquist plots of LSF-YSZ cathode symmetric cells measured at 973 K and open circuit conditions as a function of oxygen partial pressure: (a) LSF-YSZ calcined to 1123 K, (b) LSF-YSZ calcined to
1373 K. 151
Figure 6.3 Oxygen partial pressure dependence of processes in the impedance spectra of LSF-YSZ electrodes at 973 K: (•) total polarization resistance of a cell heated to 1123 K, (o) high-frequency (HF) polarization resistance of a cell heated to 1373 K, and (◊)
Figure 6.4 Nyquist plots of LSF-YSZ cathode symmetric cells measured at 973 K in 5% O2 in argon as a function of applied current density: (a)
LSF-YSZ calcined to 1123 K, (b) LSF-YSZ calcined to 1373 K.
155
Figure 6.5 Nyquist plots of four LSF-YSZ cathode symmetric cells calcined to 1123 K and measured at a) 873 K and b) 973 K before and after ALD treatment.
158
Figure 6.6 Nyquist plots of LSF-YSZ cathode symmetric cells calcined to 1123 K tested at 973 K before and after a 5-cycle Al2O3 ALD.
Performance is partly restored after the ALD layer disintegrates at
1073 K. 161
Chapter 1. Introduction
1.1 Motivation
In contrast to the tremendous pace of technological change in fields like computing, biotechnology and health care, the technology of power generation has remained largely unchanged over the last 50 years. Today, most of the electricity is still generated in large thermal power plants, where heat from the combustion of fuel is converted into mechanical energy, which is subsequently converted to electrical energy. In a typical power plant, almost ⅔ of the energy in the fuel remains unused and is lost as waste heat. Only an incremental 2% improvement in thermal power generation efficiency (from 32% to 34%) was achieved worldwide from 1990 to 2008 [1].
Rising environmental concerns have spurred the search and development of new, cleaner power generation technology. Fuel cells is one such technology. Unlike heat engines, fuel cells are able to convert chemical energy directly into electrical energy, and are therefore not constrained by the Carnot efficiency. As a result, fuel cells are generally significantly (10 to 20%) more efficient than combustion engines, even at very small system sizes.
with conventional systems. Due to low operating pressures, fuel cells deliver negligible NOx and SOx emissions. When hydrogen is used as fuel, power generation with zero
(local) emissions is possible.
1.2 Solid Oxide Fuel Cells
All fuel cells consist of at least three components: the anode, the cathode and the electrolyte. Electrochemically, the anode facilitates the oxidation of fuel, while the cathode catalyzes the reduction of an oxidizing species (typically oxygen in the form of air). Direct combustion of the fuel is prevented by separating the two electrodes by an electrolyte membrane that is impermeable to gases and electronic current, but allows for ionic transport from one electrode to the other (Fig. 1.1).
An SOFC is an all-solid-state energy conversion device that produces electricity by electrochemically combining fuel and oxidant gases across an ionically conducting ceramic membrane. An SOFC consists of two electrodes (the anode and the cathode) separated by a solid electrolyte (Fig. 1.1). Oxidant (air) is fed to the cathode where it is electrochemically reduced by electrons from the external circuit:
O2(g) + 4e⎯→ 2O2⎯. Equation 1.1
Fuel (H2, CO, CH4, etc.) is fed to the anode, where it undergoes an oxidation
reaction and releases electrons to the external circuit:
H2(g) + O2⎯→ H2O (g) + 2e⎯, Equation 1.2
CO(g) + O2⎯→ CO2 (g) + 2e⎯, Equation 1.3
or, in the case of hydrocarbon fuels,
When a constant flow of reactants is maintained to the electrodes, the SOFC generates direct electronic current from the anode to the cathode, which can be used to drive an external load. Multiple SOFC units can be connected in series in order to increase the voltage and power output of the system.
The key advantage of SOFCs over other types of fuel cells lies in their inherent fuel flexibility. In low-temperature fuel cells (PEMFC, AFC, PAFC), the fuel fed into the system is the source of the ionic charge carriers (either H+ or OH⎯). This and susceptibility to poisoning (CO and sulfur poisoning in PEMFCs and PAFCs, CO2
poisoning in AFCs) severely limits the number of fuels suitable for long-term operation. In all cases, the use of highly pure H2 is the preferred, although operation on methanol is
possible in some PEMFCs [3].
1.3 Traditional SOFC materials
The first generation of SOFCs operated at temperatures close to 1000°C [2,4,12,13]. Typically, these cells employed a fairly thick dense electrolyte, which acted as a mechanical support for the electrodes (Fig. 1.2a). Due to its chemical stability and relatively high oxygen ion conductivity, almost all of these devices employed yttria-stabilized zirconia (YSZ) as the electrolyte. A cermet of Ni and YSZ (in some early examples, metallic Pt) was used as the anode material, while a perovskite ceramic, Sr-doped LaMnO3 (LSM) was used almost exclusively as the cathode material [2,4,12-14].
1.3.1 Yttria-stabilized zirconia
Pure ZrO2 is an insulator with a dielectric constant of 25 [15]. Upon doping with
trivalent metal oxides (e.g. Y2O3), oxygen vacancies (one per every two Y3+ ions) are
formed in the ZrO2 lattice. At high temperatures, these vacancies become mobile and can
hop from one lattice site to the next, giving rise to oxygen ion conductivity in the material. At low doping levels (less than 8 mol% Y2O3 in ZrO2), the ionically conducting
cubic phase is not stable at SOFC operating temperatures. For example, for pure ZrO2,
cubic phase only exists above 2340°C [16]. Between 1170°C and 1700°C, ZrO2 exists in
Figure 1.2 Schematic representations of a) an electrolyte-supported high-temperature SOFC (‘first-generation SOFC’), b) an anode-supported intermediate temperature SOFC (‘second-generation SOFC’). LSM – Sr-doped LaMnO3, YSZ – yttria-stabilized zirconia, ScSZ – scandia-stabilized
zirconia, LSCF – Sr-doped LaCoyFe1-yO3.
At high doping levels (9 mol% Y2O3 or more), increased defect concentration
leads to electrostatic interactions between the vacancies and the dopants, resulting in a reduction in oxygen ion mobility [3,4]. A composition of 8 mol% Y2O3 in ZrO2,
sometimes abbreviated as 8YSZ, is therefore almost always used, because it offers both maximum ionic conductivity (0.01 S/cm at 1000°C [4]) as well as phase stability over the entire range of SOFC operating and manufacturing temperatures. However, it should be noted that the mechanical strength of YSZ decreases with increasing Y3+ doping, which is the reason why some SOFC manufacturers have chosen to base their cell design on partially stabilized YSZ instead [2,4]. Importantly, the electronic conductivity of YSZ is negligible: the electronic transference number (the probability that a charge carrier transported through the material is an electron, not an ion) has a value of 10-8 … 10-9
over a wide range of oxygen partial pressures [4,17].
YSZ
Ni-YSZ LSM
a
YSZ or ScSZ
Ni-YSZ LSCF-YSZ
1.3.2 Ni/YSZ
Metallic nickel is a good catalyst for methane steam reforming. It also serves as a good hydrogen oxidation catalyst and provides electronic pathways from the reaction zone to the external circuit. It has been established that the anode reaction occurs preferentially at the three-phase boundary (TPB) sites, where an electronic conductor (Ni), an oxygen-ion conductor (YSZ) and gaseous fuel are all present at the same time [2-4,18-21]. To maximize the number of TPB sites, the particle size of Ni in the electrode active layer should be as small as possible. Unfortunately, Ni nanoparticles undergo rapid coarsening at SOFC temperatures due to Ostwald ripening [22]. Ni/YSZ anodes are also very sensitive to impurities in the fuel (S, As, Sb, Cl, etc) [23-26] and degrade catastrophically when subject to oxidation / re-reduction (redox) cycles [27,28]. Ni nanoparticles are the catalyst of choice for carbon nanotube synthesis [29-31]. Unfortunately, this also means that SOFCs with Ni anodes must be operated at high steam to carbon ratios to avoid cell failure due to coking [32].
1.3.3 Sr-doped LaMnO3
Sr-doped LaMnO3 (La1-xSrxMnO3, LSM) has a perovskite structure (the structure
(4·10-8 S/cm at 800°C [34]), therefore composites with YSZ must be used to increase the number of TPBs and extend the electrode active region from the immediate vicinity of the cathode|electrolyte interface to the bulk of the electrode.
1.3.4 Current collector materials
The standard potential of the methane oxidation reaction is 1.04 V at 1000°C [35]. In order to achieve higher output voltage, several SOFC single cells (membrane-electrode assemblies) must be connected in series. The electrical connection between the anode and the cathode is made by using interconnects. The interconnect materials must be stable (and electronically conducting) at high temperatures in both oxidizing and in reducing environments (in the presence of steam). At 1000°C, only ceramic conductors, such as Ca- or Sr-doped LaCrO3, are able to maintain conductivity over the required p(O2) range [2-4]. However, LaCrO3-based materials are difficult to sinter to full density,
making the fabrication very expensive.
1.4 State-of-the-art
cheaper materials, such as various stainless steels, to be employed as interconnect materials. The issue of finding suitable sealing materials also becomes less severe as fewer restrictions are imposed on the thermal expansion match between different components of the cell [37].
At 1000°C, the ohmic resistance associated with a 100-μm 8YSZ electrolyte is approximately 0.1 Ω cm2 [4,38]. In order to achieve the same resistance at 700°C, the thickness of the electrolyte must be decreased to just 18 μm [38]. Such thin electrolyte layers do not possess enough mechanical strength to support the electrodes; therefore an electrode-supported (typically anode-supported) cell configuration (Fig. 1.2b) must be employed. Other, more conducting electrolytes, such as Sc2O3-stabilized ZrO2 (ScSZ)
and various doped CeO2 materials (e.g. Sm-doped CeO2, SDC) may be used instead of
YSZ to reduce ohmic losses [38-40].
Despite its several shortcomings, Ni is still the most commonly used active material for SOFC anodes. However, a number of conducting ceramic anode materials, such as La-doped SrTiO3 (LST) [41,42], Sr-doped LaCr0.5Mn0.5O3 (LSCM) [41,43-45],
Sr-doped rare-earth vanadates [46,47], and various tungsten bronzes [41,48] have been proposed as promising alternatives to Ni. Ceramic anodes are thermally more stable and exhibit potentially better tolerance towards sulfur and redox cycling. To the author’s knowledge, none of these materials are used in commercial SOFC systems today, but it is likely that this will change in the future.
contribution to the overall impedance becomes increasingly important [49]. In one example, reducing the operating temperature of an SOFC from 1000°C to 500°C increased the polarization resistance of an LSM-based cathode from <1 Ω cm2 to 2000 Ω
cm2 [14]. Cathodes with increased activity towards oxygen reduction reaction must therefore be developed. Activity can be tailored by 1) altering the physical properties of electrode materials (Chapter 1.5) or 2) by changing the microstructure of the electrodes (Chapter 1.6).
The aim of this thesis is to elucidate the relative importance of both various physical properties (ionic and electronic conductivity, perovskite surface composition, etc.) as well as microstructural properties (specific surface area, perovskite particle size) on the performance of composite cathodes for SOFCs operating between 600°C and 800°C. All experiments presented here have been performed on electrodes prepared by infiltration (see Chapter 1.6), a cell fabrication technique that allows for very precise control of the microstructure of each component in an electrode [49].
1.5 Perovskite cathode materials
Perovskite oxide materials with a general formula ABO3, containing La and Sr on
the A-site and transition metals on the B-site, are important materials for SOFC cathodes. Most SOFC cathodes are based on Sr-doped lanthanum manganites, cobaltites, or ferrites, i.e. materials like Sr-doped LaMnO3 (LSM), Sr-doped LaCoO3 (LSCo), Sr-doped
LaFeO3 (LSF), or Sr-doped LaCo1-yFeyO3 (LSCF)[49].
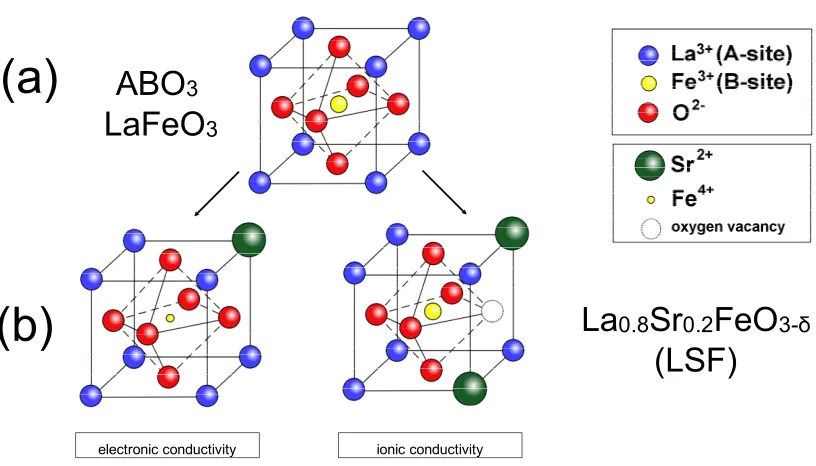
The example of Sr-doped LaFeO3 (La1-xSrxFeO3-δ, LSF) is used here to illustrate
the effect of A-site doping on the properties of LaFeO3 (Fig. 1.3). Stoichiometric LaFeO3
(Fig. 1.3a) is a relatively poor electronic conductor (0.4 S/cm at 700°C in air) with negligible ionic conductivity [50]. The oxygen atoms in the perovskite structure surround the B-site cation in the shape of an octahedron. Upon Sr-doping, some of the La3+ on the A-site of the LaFeO3 lattice is substituted with divalent Sr2+.
The defect equilibrium is established through two processes: 1) by the oxidation of Fe3+ on the B-site to Fe4+, 2) by the creation of oxygen vacancies, VO2-, one per every
two Sr2+ atoms (Fig. 1.3b). Note: only a simplified picture is given here, a more rigorous approach employing Kröger-Vink notations can be found in [51]. Combining the results of the two reactions above, the doping process can be summarized as:
, Equation 1.5
where x is the Sr-doping level and δ is the oxygen non-stoichiometry.
δ δ δ + − + + + + ⎯ ⎯→
⎯ 4 3
2 -x 3 2 x) -(1 2 x 3 x -1 SrO
3 La Sr Fe Fe O
Figure 1.3 The unit cell of a) undoped LaFeO3 with a perovskite structure, and b)
Sr-doped LaFeO3.
electronic conductivity ionic conductivity
ABO
3LaFeO
3La
0.8Sr
0.2FeO
3-δ(LSF)
(a)
The oxidation of Fe3+ to Fe4+ increases the electronic conductivity of the LSF through the creation of Fe3+-O-Fe4+ bridges [52], while the creation of oxygen vacancies in the lattice results in O2- ion conductivity. Just 1 mol% of Sr doping increases the electronic conductivity to 2 S/cm [50], while the electronic conductivity of 20 mol% Sr-substituted LaFeO3 (i.e. La0.8Sr0.2FeO3) is ~80 S/cm at 700°C in air [51]. Additionally,
La0.8Sr0.2FeO3 also possesses significant levels of ionic conductivity (~1.5 · 10-4 S/cm at
700°C in air) [53].
In contrast to LSM, LSF is therefore a mixed ionic and electronic conductor (MIEC). In cathodes based on MIECs, oxygen adsorption and reduction is no longer spatially confined to the immediate vicinity of the TPB sites, but extends into the perovskite bulk [3,49,54,55]. This results in a significant increase in the effective active surface area of the electrode. However, the ionic conductivity of MIECs is usually still much lower than that of YSZ (σi,YSZ = 1.8·10-2 S/cm at 700°C [38]). Therefore, using a
composite of an MIEC perovskite and YSZ (or another electrolyte material) can significantly improve the performance of SOFC cathodes compared to using the perovskite alone [56]. Electrodes based on MIEC-YSZ composites demonstrate excellent activity towards the oxygen reduction reaction even at temperatures 600…800°C (Fig. 1.2b). For example, the non-ohmic impedance associated with a La0.8Sr0.2CoO3
(LSCo)-YSZ composite electrode prepared by infiltration is about 30 mΩ cm2 at 700°C (see Chapter 5).
model assumes that the structure of an SOFC composite cathode can be approximated to an array of uniform YSZ fins, covered with a thin perovskite film (e.g. LSM, LSF, or LSCo). According to the model, 90% of the electrochemical activity in an LSF-YSZ composite electrode, operating at 700°C with a non-ohmic impedance of 0.3 Ω cm2, is confined to the first 7 μm of the electrode [57], while a typical electrode is about 50 μm in thickness. An LSCo-YSZ electrode operating at the same temperature has an active region thickness of about 70 μm. A more detailed description of the model will be given in Chapter 4.
1.6 The effect of microstructure
It is generally accepted that the performance of a fuel cell is determined to a high degree by the microstructure of the electrodes. For example, in a 1995 study, Østergård
et al. demonstrated that the non-ohmic impedance of pure LSM cathodes could be decreased from 19.8 Ω cm2 to 7.5 Ω cm2 (at 1000°C) as the coarse-grained LSM starting powder was changed for a more finely grained powder [56]. A further two- to three-fold decrease in impedance was observed when some YSZ powder was added to the LSM prior to cell fabrication, effectively increasing the number of TPB sites in the cathode [56].
sintering the YSZ particles in the electrode to the electrolyte) but low enough to avoid excessive coarsening of the perovskite and prevent solid-state reactions between the perovskite and the YSZ [49].
An alternative method of cell fabrication, called infiltration, has been developed at the University of Pennsylvania [7,33,40,47-49,58-62]. In this approach, slurries consisting of the YSZ powder, a polymeric binder, dispersant, plasticizers, and solvent are tape-cast (Fig. 1.4) to form the green YSZ dense film. When graphite or other carbonaceous pore formers are added to the slurry, green porous YSZ tapes can be cast [63]. The tapes are then laminated together and fired to 1500°C to form a porous-dense-porous YSZ structure. Electrode active materials can subsequently be added into the pores of the electrode by infiltrating the YSZ structure with nitrate solutions. For example, in order to infiltrate La0.8Sr0.2FeO3, a solution of La(NO3)3·6H2O, Sr(NO3)2,
and Fe(NO3)3·9H2O at a molar ratio of La : Sr : Fe = 0.8 : 0.2 : 1 should be used. Citric
acid or other chelating agents are normally also added to the solution in a 1:1 ratio to the metal cations in order to assist the formation of the perovskite phase at lower temperatures [64,65]. Upon heating to 700°C…850°C, the nitrates decompose to form the desired perovskite phase.
Figure 1.4 Cell fabrication by tape-casting and infiltration.
YSZ tape Carrier Film YSZ Slurry
Doctor Blade YSZ + Pore Formers
STEP 1 STEP 2
STEP 3 STEP 4 STEP 5
Lamination Sintering 1500°C precursorsInfiltrate Calcination
electrode are well established and delamination of electrodes is typically not a problem. The fact that the two sintering steps are separated in time allows for precise control of both the microstructure of the electrolyte scaffold and that of the active phase – a property of the infiltration method that will be used extensively throughout this thesis.
Secondly, because the conducting phase is added into an existing YSZ scaffold, the composites formed by infiltration are not random. One implication of this is that sufficient conductivity can be achieved using perovskite loadings below the normal percolation threshold of 30-vol% [49,58]. The non-random structure also causes the coefficient of thermal expansion (CTE) of the composite to be closer to that of YSZ scaffold than to the weighted average of the components [49,59].
Compared to the traditional approach, the electrode active materials do not normally have to be subjected to temperatures >850°C during electrode preparation by infiltration. At these relatively low temperatures, solid-state reactions between the YSZ and the perovskite are rarely an issue (an important exception here is the LSCo-YSZ system, which will be discussed in Chapter 5). This means that a large number of materials that were considered unsuitable for SOFC applications due to their reactivity with YSZ at temperatures employed in traditional SOFC manufacturing process, can be used as electrode materials when the infiltration approach is employed for cell fabrication [7-9,46-49,61,65].
if the electrodes are prepared by infiltration [33]. However, a tenfold increase in impedance was observed when the nanoparticulate LSM phase was heated to 1100°C [33]. The effect of the surface area of the porous electrolyte scaffold will be discussed in more detail in Chapter 3, while Chapter 4 will examine the effect of changing the surface area and particle size of the perovskite.
1.7. Surface exchange versus bulk diffusion limitation
Mixed ionic and electronic conducting perovskites (such as LSF, LSCo, LSCF) are commonly used SOFC cathode materials. The rate of oxygen transport in these materials is governed by the kinetics of oxygen exchange on the perovskite surface and by the kinetics of oxygen anion diffusion in the perovskite bulk [66-71]. In ion-conducting membrane systems, the relative importance of the two processes is determined by the thickness. For thick membranes, oxygen transport is dominated by diffusion, and the overall rate depends on the value of the diffusion coefficient, D
(cm2/s), of O2- ions in the perovskite. As the thickness of the membrane is decreased, transport rates become increasingly dependent on the rate of oxygen incorporation on the perovskite surface, a process which is characterized by the surface exchange coefficient,
k (cm/s) [66,67,69].
The critical thicknesses, Lc, defined as Lc = D/k, for perovskite materials that are
the perovskite phase is usually less than 1 μm [49,57,64], suggesting that oxygen transport in these systems should be limited by k (the surface), rather than D (the bulk).
It is perhaps not surprising then that a growing number of research groups have recently been converging on the idea that the kinetics of oxygen reduction on SOFC cathodes are limited by the availability of reaction sites on the perovskite surface. For example, Endo et al. showed that for dense La0.6Sr0.4CoO3 (LSCo) electrodes deposited
on Sm-doped ceria, electrochemical resistance exhibited no dependence on the thickness of the perovskite film, indicating surface limitation, while the impedance of dense La0.81Sr0.19MnO3 (LSM) electrodes was inversely proportional to film thickness,
indicating diffusion limitation [72]. A different approach was taken by Boukamp et al., who showed that the addition of a thin dense layer of La0.6Sr0.4Co0.2Fe0.8O3-δ (LSCF)
between the electrolyte and porous LSCF electrode can significantly improve
performance – a clear sign that diffusion through thin perovskite layers is facile under SOFC cathode operating conditions [73]. Adler found that the impedance response of low surface area LSCo electrodes on doped CeO2 substrate was semicircular and
followed the predictions of a model that assumed surface exchange limitation. High surface area LSCo electrodes were found to be co-limited by oxygen chemical exchange and transport [74].
Figure 1.5 Effective oxygen exchange rate constant k at 700°C, p(O2) = 0.2 bar,
measured on thin film electrodes with different compositions, plotted as a function of the bulk oxygen vacancy concentration. Data compiled from [75] Ba0.5Sr0.5FeO3-δ (BSF), SrCo0.8Fe0.2O3-δ (SCF), Ba0.5Sr0.5
-Co0.4Fe0.6O3-δ (BSCF5040), Ba0.25Sr0.75Co0.8Fe0.2O3-δ (BSCF2580),
Ba0.5Sr0.5Co0.8Fe0.2O3-δ (BSCF5080), [76] SrFeO3-δ (SF), [66]
(La0.6Sr0.4)0.99FeO3-δ (LSF), [77,78] La0.6Sr0.4Co0.8Fe0.2O3-δ (LSCF),
[78,79] La0.6Sr0.4CoO3-δ (LSCo).
In addition to the impedance spectroscopy studies above, a variety of other experimental techniques seem to point toward similar conclusions. In the electrical conductivity relaxation (ECR) method, the changes in the conductivity of the sample are measured as a function of time, in response to a step change in oxygen partial pressure [66,80-82]. Using this method, Mosleh et al. recently proposed that the vacancies are the active sites of adsorption of molecular oxygen in Sr-doped LaFeO3 thin films and that
Interesting work using oxygen isotope exchange from the groups of Wachsman and Bouwmeester also suggests oxygen exchange is rate-limiting [67,83,84]. In one example, the atmosphere surrounding an LSCFsample was switched from 16O2 to 18O2
[83]. A lag in the production of the scrambled product, 16O18O, assumed to occur only on the sample surface, was observed, demonstrating that the labeled oxygen does not displace the original surface species right away, but must gradually accumulate, consistent with a hypothesis of slow surface exchange and fast diffusion [83].
Secondary Ion Mass Spectrometry (SIMS) is another well-established experimental technique for studying oxygen surface exchange [70,71,85-87]. The values of k* and D* obtained from a SIMS experiment describe the rate of isotope exchange and diffusion in the sample, and are not equivalent to the values of k and D from ECR and isotope exchange experiments. Using the data obtained by SIMS, Kilner et al. drew attention to the remarkable correlation k* ~ (D*)0.5 over a wide range of perovskite structures, and hypothesized that both parameters intrinsically depend on the vacancy concentration in the perovskite [71]. In fact, using SIMS, Yasuda et al. obtained a result very similar to that in Figure 1.5 for Ca-doped LaCrO3-δ [87].
-cathodes infiltrated with Sr-, Ca-, or Ba-doped LaFeO3 exhibited very similar impedance
responses irrespective of the fact that the ionic conductivity of these materials differs by a factor of 60 [88]. In good agreement with the hypothesis of surface area limitation, the electrode performance has been found to be a strong function of the microstructure of the perovskite phase [33,53,59-62,88,89].
In case the surface reaction is rate-limiting, increasing the surface area of the electrode (e.g. by infiltration of nanoparticles) should result in enhanced performance. In Ref. 89, Bidrawn et al. added different species, such as YSZ, Pd, Sm-doped CeO2, CaO,
or K2O into either LSF-YSZ or LSM-YSZ composite electrodes prepared by infiltration.
Little or no change in electrode performance was observed when the additional species were infiltrated to electrodes that already had a relatively high surface area (1.8 m2/g). In contrast, significant reduction in impedance values was observed when the same species were infiltrated into low-surface area (0.3 m2/g) electrodes, regardless of the chemical nature of the dopant [89]. Intuitively, the effect of CaO on the catalytic, electronic, or ionic-conduction properties of the electrode should be minimal, while K2O should have
an outright negative effect. Surprisingly, both species were found to improve performance instead, suggesting that the lack of (purely geometric) surface area may be the rate-limiting factor for oxygen reduction [89].
A recently developed model of SOFC cathode performance, in which the O2
adsorption rate was treated as proportional to the surface flux of O2 from the kinetic
hypothesis of surface area limitation [57]. The model was able to achieve a good match with experimental impedances using a reasonable value of the sticking coefficient onto the vacancy sites of 10-3 at 700°C. When diffusion-limitation was used as the rate-limiting step in the model, only very poor agreement with experimental results could be obtained [57].
Another implication of surface exchange limitation is that the chemical composition of the perovskite surface is likely to play an important role in determining the overall performance of the fuel cell. From a practical point of view, identifying the chemical nature and concentration of catalytically active sites on perovskite surfaces thus becomes highly important. Probing perovskite surfaces under operating conditions with surface-sensitive techniques (e.g. XPS) is very difficult due to the high temperatures and oxygen partial pressures involved.
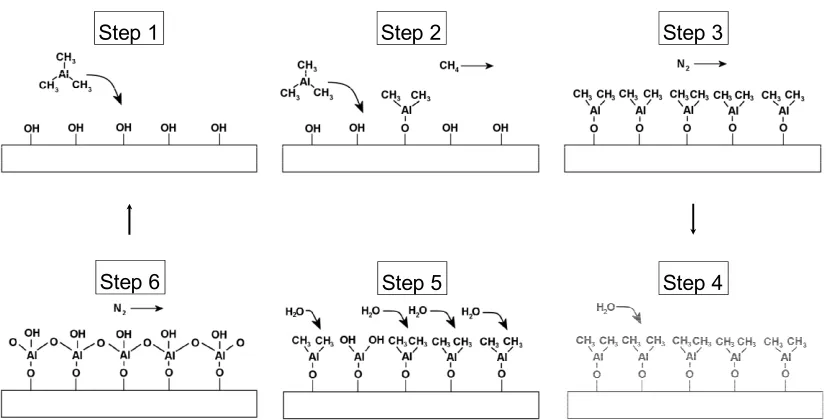
thickness of the deposited layers, even when deposition is carried out in a porous medium [93].
Al2O3 deposition with trimethyl-aluminum (TMA) and water is probably the
Figure 1.6 Atomic layer deposition: steps in the TMA/water process.
Step 1 Step 2 Step 3
Step 4 Step 5
References
1. Energy Efficiency: A Recipe for Success, World Energy Council Report, London, 2010.
2. S. Singhal and K. Kendall (Eds.), High temperature solid oxide fuel cells: fundamentals, design and applications, Elsevier, Oxford, 2003.
3. R. O’Hayre, S.-W. Cha, W. Collela, and F. B. Prinz, Fuel Cell Fundamentals, 2nd Ed., Wiley, Hoboken, 2009.
4. N. G. Minh and T. Takahashi (Eds.), Science and technology of ceramic fuel cells, Elsevier, Amsterdam, 1995.
5. R. Bove and P. Lunghi, Electric power generation from landfill gas using traditional and innovative technologies, Energy Conv. Manag., 47, 1391 (2006).
6. J. Pusz, R. Bove, and N. M. Sammes, Landfill gas energy recovery based on micro-tubular solid oxide fuel cells, Proceedings of the Ninth Symposium on Solid Oxide Fuel Cells (SOFC-IX), Quebec City, Canada, p. 277 (2005).
7. S. Park, J. M. Vohs, and R. J. Gorte, Direct oxidation of hydrocarbons in a solid-oxide fuel cell, Nature, 404, 265 (2000).
8. H. Kim, S. Park, J. M. Vohs, and R. J. Gorte, Direct oxidation of liquid fuels in a solid oxide fuel cell, J. Electrochem. Soc., 148(7), A693 (2001).
9. S. McIntosh and R. J. Gorte, Direct hydrocarbon solid oxide fuel cells, Chem. Rev.,
10. A. Jayakumar, R. Küngas, S. Roy, A. Javadekar, D. J. Buttrey, J. M. Vohs, and R. J. Gorte, A direct carbon fuel cell with a molten antimony anode, Energy Environ. Sci.,
4, 4133 (2011).
11. H. Abernathy, R. Gemmen, K. Gerdes, M. Koslowske, and T. Tao, Basic properties of a liquid tin anode solid oxide fuel cell, J. Power Sources, 196 4564 (2011). 12. N. G. Minh, Ceramic fuel cells, J. Am. Ceram. Soc., 76[3], 563 (1993).
13. M. J. Jørgensen, S. Primdahl, C. Bagger, and M. Mogensen, Effect of sintering temperature on microstructure and performance of LSM–YSZ composite cathodes,
Solid State Ionics, 139, 1 (2001).
14. A. J. Jacobsen, Materials for solid oxide fuel cells, Chem. Mater., 22, 660, (2010). 15. J. Robertson, High dielectric constant gate oxides for metal oxide Si transistors, Rep.
Prog. Phys., 69, 327 (2006).
16. H. G. Scott, Phase relationships in the zirconia-yttria system, J. Mater. Sci., 10, 1527 (1975).
17. A. V. Virkar, Mechanism of oxygen electrode delamination in solid oxide electrolyzer cells, Int. J. Hydrogen Energy, 35, 9527 (2010).
18. B. de Boer, M. Gonzalez, and H. J. M Bouwmeester, and H. Verweij, The effect of the presence of fine YSZ particles on the performance of porous nickel electrodes,
Solid State Ionics, 127[3-4], 269 (2000).
20. M. Mogensen, K. V. Jensen, M. J. Jørgensen, and S. Primdahl, Progress in understanding SOFC electrodes, Solid State Ionics, 150[1-2], 123 (2002).
21. D. Kanno, N. Shikazono, N. Takagi, K. Matsuzaki, and N. Kasagi, Evaluation of SOFC anode polarization simulation using three-dimensional microstructures reconstructed by FIB tomography, Electrochim. Acta, 56, 4015 (2011).
22. T. Klemensø, K.Thydén, M. Chen, and H.-J. Wang, Stability of Ni-yttria stabilized zirconia anodes based on Ni-impregnation, J. Electrochem. Soc., 152,A2186 (2005). 23. O. A. Marina, L. R. Pederson, C. A. Coyle, E. C. Thomsen, P. Nachimuthu, and D. J. Edwards, Electrochemical, structural and surface characterization of nickel/zirconia solid oxide fuel cell anodes in coal gas containing antimony, J. Power Sources, 196, 4911 (2011).
24. O. A. Marina, C. A. Coyle, E. C. Thomsen, D. J. Edwards, C. W. Coffey, and L. R. Pederson, Degradation mechanism of SOFC anodes in coal gas containing phosphorus, Solid State Ionics, 181, 401 (2010).
25. G. Nurk, P. Holtappels, R. Figi, J. Wochele, M. Wellinger, A. Braun, and T. Graule, A versatile salt evaporation reactor system for SOFC operando studies on anode contamination and degradation with impedance spectroscopy, J. Power Sources,
196[6], 3134 (2011).
27. M. Pihlatie, A. Kaiser, P. H. Larsen, and M. Mogensen, Dimensional Behavior of Ni–YSZ Composites during Redox Cycling,J. Electrochem. Soc., 156, B322 (2009). 28. T. Klemensø, C. Chung, P. H. Larsen, and M. Mogensen, The mechanism behind
redox instability of anodes in high-temperature SOFCs, J. Electrochem. Soc., 152, A2186 (2005).
29. M. L. Toebes, J. H. Bitter, A. J. van Dillen, and K. P. de Jong, Impact of the structure and reactivity of nickel particles on the catalytic growth of carbon nanofibers, Catal. Today, 76, 33 (2002).
30. S. Helveg, C. López-Cartes, J. Sehested, P. L. Hansen, B. S. Clausen, J. R. Rostrup-Nielsen, F. Abild-Pedersen, and J. K. Nørskov, Atomic-scale imaging of carbon nanofibre growth, Nature, 427, 426 (2004).
31. B. O. Boskovic, V. Stolojan, R. U.A. Khan, S. Haq, and S. R. P. Silva, Large-area synthesis of carbon nanofibres at room temperature, Nature Mat., 1, 165 (2002). 32. J.-H. Koh, B.-S. Kang, H. C. Lim, and Y.-S. Yoo, Thermodynamic analysis of
carbon deposition and electrochemical oxidation of methane for SOFC anodes,
Electrochem. Solid State Lett., 4[2], A12 (2001).
33. Y. Huang, J. M. Vohs, and R. J. Gorte, Characterization of LSM-YSZ Composites Prepared by Impregnation Methods, J. Electrochem. Soc., 152[7] A1347 (2005). 34. Y. Ji, J. A. Kilner, and M. F. Carolan, Electrical properties and oxygen diffusion in
yttria-stabilised zirconia (YSZ)–La0.8Sr0.2MnO3±δ (LSM) composites, Solid State
35. H. Y. Afeefy, J. F. Liebman, and S. E. Stein, Neutral Thermochemical Data in NIST Chemistry WebBook, Eds. P.J. Linstrom and W.G. Mallard, http://webbook.nist.gov, (retrieved March 4, 2012).
36. V. A. C. Haanappel, N. Jordan, A. Mai, J. Mertens, J. M. Serra, F. Tietz, S. Uhlenbruck, I. C. Vinke, M. J. Smith, L. G. J. de Haart, Advances in research, development, and testing of single cells at Forschungzentrum Jülich, J. Fuel Cell Sci. Tech., 6, 021302 (2009).
37. Q. Zhu, L. Peng, and T. Zhang in Fuel cell electronics packaging, K. Kuang, K. Easler (Eds.), Springer, New York, p33 (2007).
38. V. V. Kharton, F. M. B. Marques, and A. Atkinson, Transport properties of solid oxide electrolyte ceramics: a brief review, Solid State Ionics, 174, 135 (2004).
39. B. C. H. Steele, Appraisal of Ce1−yGdyO2−y/2 electrolytes for IT-SOFC operation at
500°C, Solid State Ionics, 129, 95 (2000).
40. R. Küngas, J. M. Vohs, and R. J. Gorte, Effect of ionic conductivity of the electrolyte in composite SOFC cathodes, J. Electrochem. Soc, 158[6], B743 (2011). 41. P. I. Cowin, C. T. G. Petit, R. Lan, J. T. S. Irvine, and S. Tao, Recent progress in the
development of anode materials for solid oxide fuel cells, Advanced Energy Mater.,
1, 314 (2011).
42. S. Lee, G. Kim, J. M. Vohs, and R. J. Gorte, SOFC anodes based on infiltration of La0.3Sr0.7TiO3, J. Electrochem. Soc., 155[11], B1179 (2008).
43. S. Tao and J. T. S. Irvine, A redox-stable efficient anode for solid oxide fuel cells,
44. G. Kim, G. Corre, J. T. S. Irvine, J. M. Vohs, and R. J. Gorte, Engineering composite oxide SOFC anodes for efficient oxidation of methane, Electrochem. Solid-State Lett., 11[2], B16 (2008).
45. G. Kim, S. Lee, J. Y. Shin, G. Corre, J. T. S. Irvine, J. M. Vohs, and R. J. Gorte, Investigation of the structural and catalytic requirements for high-performance SOFC anodes formed by infiltration of LSCM, Electrochem. Solid-State Lett., 12[3], B48 (2009).
46. J.-S. Park, I. D. Hasson, M. D. Gross, C. Chen, J. M. Vohs, and R. J. Gorte, A high-performance solid oxide fuel cell anode based on lanthanum strontium vanadate, J. Power Sources, 196, 7488 (2011).
47. L. Adijanto, V. B. Padmanabhan, K. Holmes, R. J. Gorte, and J. M. Vohs, Physical and electrochemical properties of alkaline earth doped, rare earth vanadates, J. Solid State Chem., in press, doi:10.1016/j.jssc.2012.01.065.
48. L. Adijanto, R. Küngas, J. Park, J. M. Vohs, and R. J. Gorte, SOFC anodes based on infiltration of tungsten bronzes, Int. J. Hydrogen Energy, 36, 15722, (2011).
49. J. M. Vohs and R. J. Gorte, High-performance SOFC cathodes prepared by infiltration, Adv. Mat., 21[9], 943 (2009).
50. I. Wærnhus, T. Grande, and K. Wiik, Electronic properties of polycrystalline LaFeO3. Part II: Defect modelling including Schottky defects, Solid State Ionics,
51. M. Søgaard, P. V. Hendriksen, and M. Mogensen, Oxygen nonstoichiometry and transport properties of strontium substituted lanthanum ferrite, J. Solid State Chem.,
180, 1489 (2007).
52. T. Montini, M. Bevilacqua, E. Fonda, M. F. Casula, S. Lee, C. Tavagnacco, R. J. Gorte, and P. Fornasiero, Relationship between electrical behavior and structural characteristics in Sr-doped LaNi0.6Fe0.4O3−δmixed oxides, Chem. Mater., 21, 1768
(2009).
53. Y. Ren, R. Küngas, R. J. Gorte, and C. Deng, The effect of A-site cation (Ln = La, Pr, Sm) on the crystal structure, conductivity and oxygen reduction properties of Sr-doped ferrite perovskites, Solid State Ionics, 212, 47 (2012).
54. C. W. Tanner, K.-Z. Fung, and A. V. Virkar, The effect of porous composite electrode structure on solid oxide fuel cell performance: Part I - theoretical analysis,
J. Electrochem. Soc., 144, 21 (1997).
55. S. B. Adler, Factors governing oxygen reduction in solid oxide fuel cell cathodes,
Chem. Rev., 104, 4791 (2004).
56. M. J. L. Østergård, C. Clausen, C. Bagger and M. Mogensen, Manganite-zirconia composite cathode for SOFC: influence of structure and composition, Electrochim. Acta, 40[12], 1971 (1995).
58. H. He, Y. Huang, J. Regal, M. Boaro, J. M. Vohs, and R. J. Gorte, Low-temperature fabrication of oxide composites for solid-oxide fuel cells, J. Am. Ceram. Soc., 87[3], 331 (2004).
59. Y. Huang, J. M. Vohs, and R. J. Gorte, Fabrication of Sr-doped LaFeO3 YSZ
composite cathodes, J. Electrochem. Soc., 151[4], A646 (2004).
60. Y. Huang, J. M. Vohs, and R. J. Gorte, SOFC cathodes prepared by infiltration with various LSM precursors, Electrochem. Solid-State Lett., 9[5], A237 (2006).
61. Y. Huang, K. Ahn, J. M. Vohs, and R. J. Gorte, Characterization of Sr-doped LaCoO3-YSZ composites prepared by impregnation methods, J. Electrochem. Soc.,
151[10], A1592 (2004).
62. W. Wang, M. D. Gross, J. M. Vohs, and R. J. Gorte, The stability of LSF-YSZ electrodes prepared by infiltration, J. Electrochem. Soc., 154[5], B439 (2007).
63. R. E. Mistler and E. R. Twiname, Tape casting: theory and practice, pp. 298. The American Ceramic Society: Westerville, OH, (2000).
64. R. Küngas, J.-S. Kim, J. M. Vohs, and R. J. Gorte, Restructuring porous YSZ by treatment in hydrofluoric acid for use in SOFC cathodes, J. Am. Ceram. Soc, 94[7], 2220 (2011).
66. M. Mosleh, M. Søgaard, and P. V. Hendriksen, Kinetics and mechanisms of oxygen surface exchange on La0.6Sr0.4FeO3-δ thin films, J. Electrochem. Soc., 156[4], B441
(2009).
67. E. N. Armstrong, K. L. Duncan, D. J. Oh, J. F. Weaver, and E. D. Wachsman, Determination of surface exchange coefficients of LSM, LSCF, YSZ, GDC constituent materials in composite SOFC cathodes, J. Electrochem. Soc., 158[5], B492 (2011).
68. W. Sitte, E. Bucher, and W. Preis, Nonstoichiometry and transport properties of strontium-substituted lanthanum cobaltites, Solid State Ionics, 154-155, 517 (2002). 69. H. J. M. Bouwmeester, H. Kruidhof, and A. J. Burggraaf, Importance of the surface
exchange kinetics as rate limiting step in oxygen permeation through mixed-conducting oxides, Solid State Ionics, 72, 185 (1994).
70. A. V. Berenov A. Atkinson, J. A. Kilner, E. Bucher, and W. Sitte, Oxygen tracer diffusion and surface exchange kinetics in La0.6Sr0.4CoO3-δ, Solid State Ionics, 181,
819 (2010).
71. J. A. Kilner, R. A. De Souza, and I. C. Fullarton, Surface exchange of oxygen in mixed conducting perovskite oxides, Solid State Ionics, 86-88, 703 (1996).
72. A. Endo, H. Fukunaga, C. Wen, and K. Yamada, Cathodic reaction mechanism of dense La0.6Sr0.4CoO3 and La0.81Sr0.09MnO3 electrodes for solid oxide fuel cells, Solid State Ionics, 135, 353 (2000).
74. S. B. Adler, Mechanism and kinetics of oxygen reduction on porous La1−xSrxCoO3−δ
electrodes, Solid State Ionics, 111, 125 (1998).
75. L. Wang, R. Merkle, and J. Maier, Surface kinetics and mechanism of oxygen incorporation into Ba1-xSrxCoyFe1-yO3-δ SOFC microelectrodes, J. Electrochem. Soc.,
157, B1802 (2010).
76. J. Mizusaki, M. Okayasu, S. Yamauchi, and K. Fueki, Nonstoichiometry and phase relationship of the SrFeO2.5-SrFeO3 system at high temperature, J. Solid State Chem.,
99, 166 (1992).
77. F. S. Baumann, J. Fleig, H.-U. Habermeier, and J. Maier, Impedance spectroscopic study on well-defined (La,Sr)(Co,Fe)O3−δ model electrodes, Solid State Ionics, 177,
1071 (2006).
78. S. Hashimoto, Y. Fukuda, M. Kuhn, K.Sato, K. Yashiro, and J. Mizusaki, Oxygen nonstoichiometry and thermo-chemical stability of La0.6Sr0.4Co1-yFeyO3-δ (y=0.2, 0.4,
0.6, 0.8), Solid State Ionics, 181, 1713 (2010).
79. M. Søgaard, P. V. Hendriksen, M. Mogensen, F. W. Poulsen, and E. Skou, Oxygen nonstoichiometry and transport properties of strontium substituted lanthanum cobaltite, Solid State Ionics, 177, 3285 (2006).
80. I. Yasuda and M. Hishinuma, Electrical conductivity and chemical diffusion coefficient of Sr-doped lanthanum chromites, Solid State Ionics, 80, 141 (1995). 81. R. Ganeshananthan and A. V. Virkar, Measurement of surface exchange coefficient
82. R. A. Cox-Galhotra and S. McIntosh, Unreliability of simultaneously determining
kchem and Dchem via conductivity relaxation for surface-modified
La0.6Sr0.4Co0.2Fe0.8O3-δ, Solid State Ionics, 181, 1429 (2010).
83. C. C. Kan, H. H. Kan, F. M. Van Assche IV, E. N. Armstrong, and E. D. Wachsman, Investigating oxygen surface exchange kinetics of La0.8Sr0.2MnO3-δ and
La0.6Sr0.4Co0.2Fe0.8O3-δ using an isotopic tracer, J. Electrochem. Soc., 155[10], B985
(2008).
84. H. J. M. Bouwmeester, C. Song, J. Zhu, J. Yi, M. van Sint Annaland, and B. A. Boukamp, A novel pulse isotopic exchange technique for rapid determination of the oxygen surface exchange rate of oxide ion conductors, Phys. Chem. Chem. Phys., 11, 9640 (2009).
85. E. J. Opila, H. L. Tuller, B. J. Wuensch, and J. Maier, Oxygen tracer diffusion in La2-xSrxCuO4-y single crystals, J. Am. Ceram. Soc., 76[9], 2363 (1993).
86. J. A. Kilner, S. J. Skinner, H. H. Bronnersma, The isotope exchange depth profiling (IEDP) technique using SIMS and LEIS, J. Solid State Electrochem., 15[5], 861 (2011).
87. I. Yasuda and T. Hikita, Precise Determination of the chemical diffusion coefficient of calcium-doped lanthanum chromites by means of electrical conductivity relaxation J. Electrochem. Soc., 141, 1268 (1994).
88. F. Bidrawn, S. Lee, J. M. Vohs, and R. J. Gorte, The effect of Ca, Sr, and Ba doping on the ionic conductivity and cathode performance of LaFeO3, J. Electrochem. Soc.,
89. F. Bidrawn, G. Kim, N. Aramrueang, J. M. Vohs, and R. J. Gorte, Dopants to enhance SOFC cathodes based on Sr-doped LaFeO3 and LaMnO3, J. Power Sources,
195[3], 720 (2010).
90. R. A. Wind and S. M. George, Quartz crystal microbalance studies of Al2O3 atomic
layer deposition using trimethylaluminum and water at 125 °C, J. Phys. Chem. A,
114, 1281 (2010).
91. T. Suntola, Atomic layer epitaxy, Thin Solid Films, 216, 84 (1992).
92. M. Cassir, A. Ringuedé, and L. Niinistö, Input of atomic layer deposition for solid oxide fuel cell applications, J. Mater. Chem., 20, 8987 (2010).
Chapter 2. Effect of the Ionic Conductivity of the Electrolyte in
Composite SOFC Cathodes
*Summary
Solid oxide fuel cell (SOFC) cathodes were prepared by infiltration of 35-wt% La0.8Sr0.2FeO3 (LSF) into porous scaffolds of three, zirconia-based electrolytes in order
to determine the effect of the ionic conductivity of the electrolyte material on cathode impedances. The electrolyte scaffolds were 10 mol.% Sc2O3-stabilized zirconia (ScSZ),
8 mol.% Y2O3-stabilized zirconia (YSZ), and 3 mol.% Y2O3, 20 mol.% Al2O3-codoped
zirconia (YAZ), prepared by tape casting with graphite pore formers. Each electrolyte scaffold was 65% porous, with identical pore structures as determined by scanning electron microscopy (SEM). Both symmetric cells and fuel cells were prepared and tested between 873 and 1073 K, using LSF composites that had been calcined to 1123 or 1373 K. Literature values for the electrolyte conductivities were confirmed using the ohmic losses from the impedance spectra. The electrode impedances decreased with increasing electrolyte conductivity, with the dependence being between to the power of 0.5 and 1.0, depending on the operating temperature and LSF calcination temperature.
2.1 Introduction
The performance of solid oxide fuel cells (SOFCs) is often limited by the slow kinetics of the oxygen reduction reaction at the cathode. An ideal SOFC cathode material
would have excellent catalytic activity, together with high electronic conductivity (to provide electrons for the oxygen reduction reaction) and ionic conductivity (to transport the oxygen ions from the cathode into the electrolyte) [1-3]. The material most commonly used in SOFC cathodes is LSM (La1-xSrxMnO3), which satisfies the
conditions of catalytic activity and electronic conductivity, but has a very low ionic conductivity (σi,LSM = 4·10-8 S/cm at 1073 K [4]). When pure LSM is used as the cathode,
its low ionic conductivity results in the active zone of the cathode being limited to the three-phase boundary (TPB) line in the immediate vicinity of the electrolyte. In order to extend the reaction zone further into the cathode bulk, LSM is usually mixed with a good ionic conductor, most commonly the electrolyte material (e.g. YSZ, yttria-stabilized zirconia) to form a composite [3,5-12]. Such composites combine the best of the properties of both components, resulting in a material that simultaneously meets all the requirements for SOFC cathodes. In addition to providing more TPB sites, the use of composites is also advantageous for mechanical stability, since it alleviates the problem of thermal expansion coefficient mismatch between the electrolyte and electronic conductor [13-15].
Alternative perovskites with mixed ionic and electronic conductivity (MIEC), such as LSF (La1-xSrxFeO3) or LSCF (La1-xSrxCo1-yFeyO3) have also been proposed as
cathode materials for SOFCs, especially for operation at lower temperatures, 873 to 1073 K [16-25]. The ionic conductivity of LSF is significantly higher than that of LSM (σi,LSF
MIECs is still much lower than that of the YSZ (σi,YSZ = 1.8·10-2 S/cm at 973 K [28]).
Therefore, using a composite of an MIEC perovskite and YSZ can significantly improve the performance of SOFC cathodes compared to using the perovskite alone.
The motivation of the present study was to better understand the effect of the ionic conductivity of the electrolyte in composite cathodes. Although numerous studies, both experimental and theoretical, suggest that the ionic conductivity of the electrolyte within composite SOFC electrodes can be very important for electrode performance, we are unaware of any systematic investigations on this topic. For example, while it has been demonstrated that the substitution of YSZ in Ni-YSZ anodes with doped ceria results in performance enhancement [29-32], it remains uncertain whether this is due to the higher ionic conductivity of ceria or due to the fact that ceria possesses significant catalytic activity for the electrode reaction. That catalytic activity may be responsible is suggested from the results of Sumi, et al. who compared the performance of Ni-YSZ and Ni-ScSZ (scandia-doped zirconia) anodes [33]. While the ionic conductivity of ScSZ is significantly higher than that of YSZ, the authors found negligible differences in performance for Ni-YSZ and Ni-ScSZ electrodes, with YSZ-based cells even outperforming the ScSZ-cells under some conditions [33].
The situation is similarly uncertain for SOFC composite cathodes. Perry Murray and Barnett observed significantly lower polarization resistances for composites of LSM with Gd-doped ceria compared to that of LSM-YSZ [34] and Yamahara et al. reported improved performance of LSM-SYSZ (SYSZ = (Sc2O3)0.1(Y2O3)0.01(ZrO2)0.89) electrodes
Wang et al. reported that the polarization resistance of LSM-ScCeSZ (scandia-ceria stabilized zirconia) composite cathodes decreased with ceria content, in the direction opposite to increasing ionic conductivity [35]. Finally, modeling studies by Tanner et al. [3], and Bidrawn et al. [36] suggest that the polarization resistance of composite electrodes should have an inverse square-root dependence on the ionic conductivity of the electrolyte, provided all other parameters are held constant.
Unfortunately, it is very difficult to ensure that only one parameter is varied at a time when traditional cell preparation techniques are used. For example, it is often necessary to change the preparation conditions, such as the sintering temperature, when using different electrolytes, so that the microstructure of the electrode could change with the electrolyte conductivity. This is the case with doped ceria electrolytes, for which the sintering temperatures are typically higher than corresponding temperatures for stabilized zirconia electrolytes. Indeed, Yamahara et al. recently expressed doubts whether the high ionic conductivities of the electrolyte materials used in composite electrodes are the dominant factor responsible for the comparative enhancements seen in cathode activity [11]. As pointed out earlier for SOFC anodes, enhanced performance with cathode composites prepared from doped ceria may be due to enhanced catalytic activity [37-40].
and no solid-state reactions between the two phases of the composite. Furthermore, by using tape casting with the same pore formers, the structure of the electrolyte scaffold can be prepared identical for different electrolytes. In order to vary other materials properties of the electrolyte phase (e.g. surface energy, reducibility, chemical stability, activity as catalyst, etc.) as little as possible, we chose to compare three zirconia-based materials with very different ionic conductivies: 8 mol.% Y2O3-stabilized zirconia (YSZ),
10 mol.% Sc2O3-stabilized zirconia (ScSZ), and 3 mol.% Y2O3-20 mol.% Al2O3-doped
zirconia (YAZ) [43]. We will demonstrate that the ionic conductivity of the electrolyte phase is very important in determining the cathode performance.
2.2 Experimental
The green tapes were cut into the desired size and laminated into a porous-dense-porous YSZ trilayer structure. These structures were then fired to 1773 K for YSZ and ScSZ, and to 1823 K for YAZ for 4 h. For each of the trilayer structures, the porous layers were 50 μm in thickness and 65% porous, while the thicknesses of the dense layers were 100 μm for YSZ and ScSZ and 115 μm for YAZ. The diameter of the dense electrolytes was 1 cm, while the porous layers on opposite sides of the electrolyte were 0.67 cm in diameter.
All of the electrodes in the tested cells were produced by infiltration using aqueous nitrate solutions. For LSZ–YSZ, LSF–ScSZ, and LSF–YAZ symmetric cells, both of the porous scaffolds were infiltrated with an aqueous solution consisting of La(NO3)3 · 6 H2O (Alfa Aesar, 99.9%), Sr(NO3)2 (Alfa Aesar, 99%), and Fe(NO3)3 · 6
H2O (Fisher Scientific 98.4%) at a molar ratio of La : Sr : Fe = 0.8 : 0.2 : 1. Citric acid,
in a 1 : 1 ratio with the metal cations, was used as a complexing agent to form the perovskite at lower temperatures. Each infiltration step was followed by heat treatment in air at 723 K. Multiple infiltration steps were needed to reach the final loading of 35 wt % (~20 vol%). In order to form the desired perovskite structure, the cells were heated in air to either 1123 K or 1373 K for 4 hours prior to applying Ag paste (SPI Supplies) for current collection.
To produce the fuel cells, the anode side was first infiltrated with a solution of La(NO3)3 · 6 H2O, Sr(NO3)2, Cr(NO3)3 · 9 H2O (Acros Organics, 99%), Mn(NO3)2 · 6
was achieved, the composite was fired to 1473 K for 4 hours, followed by the infiltration of the LSF cathode. Finally, 5 wt% of CeO2 (added as Ce(NO3)3, Alfa Aesar, 99.5%) and
0.5 wt% Pd (tetraamminepalladium(II) nitrate solution, Alfa Aesar, 99.9%) were added to the anode by infiltration for enhanced catalytic activity, followed by heat treatment at 723 K and the application of Ag current collector paste.
The fuel cells were attached to an alumina tube using a ceramic adhesive (Aremco, Ceramabond 552) so that the fuel (97% H2-3% H2O) could be introduced to
the anode. Electrochemical impedance spectra were recorded using a Gamry Instruments potentiostat in the frequency range of 0.1 Hz to 100 kHz. All symmetric cell impedances in this paper have been divided by two to account for there being two identical electrodes.
2.3 Results
the LSF particles are no longer easily distinguishable from the electrolyte scaffold, appearing to form a dense film of LSF over the scaffolds. Qualitatively, there were no significant differences in the nature of the LSF particles in the three electrolyte scaffolds and the interactions between LSF and the three electrolyte materials were very similar.
Figure 2.3 shows i-V polarization curves measured at 973 K for fuel cells made from each of the electrolytes, operating on 97% H2-3% H2O at the anode and air at the
cathode. The LSF composites in each of the cells had been calcined to 1123 K. The open circuit voltage (OCV) was above 1.05 V in each case, close to the Nernst Potential. However, the effect of electrolyte on the maximum power densities in these three cells is large, the YAZ cell exhibiting a maximum power density of 90 mW/cm2, the YSZ cell 280 mW/cm2, and the ScSZ cell 790 mW/cm2. The i-V curves were also reasonably linear, implying that the impedance of cells was nearly independent of the applied load, so that impedance spectra measured at open circuit should provide a good measure of electrode performance. Based on the average slopes of i-V curves, the values of overall cell resistances were 0.36 Ω cm2, 1.1 Ω cm2, and 3.1 Ω cm2 for cells based on ScSZ, YSZ, and YAZ, respectively.
The corresponding open-circuit impedance spectra for the three cells shown in Figure 2.4, allow separation of the electrode and electrolyte losses. Based on the impe-dance spectra, the total cell resistances, determined from the zero-frequency intercept with the real axis in the spectra of Figure 2.4, were 0.28 Ω cm2 for the ScSZ cell, 0.84 Ω
cm2 for the YSZ cell, and 3.12 Ω cm2 for the YAZ cell, in reasonable agreement with the