Plasma Leptin in Infants: Relations to Birth Weight and Weight Loss
Giovanna Marchini, MD, PhD; Gabriel Fried, MD, PhD; Eva O¨ stlund, MD; and Lars Hagena¨s, MD, PhD
ABSTRACT. Background. The hormone leptin, pro-duced in the adipose tissue, is involved in the regulation of body weight. The release of the hormone is increased in obese adults and decreased after fasting in human adults. This study investigated whether the plasma lep-tin level was related to the infant’s birth weight and whether the level was reduced in connection with the physiological weight loss during the neonatal period.
Methods. We measured the plasma leptin level in cord blood from infants who were large for gestational age (LGA) (n515), small for gestational age (SGA) (n5 16), and appropriate for gestational age (AGA) (n538). AGA infants (n5120), who were exclusively breastfed, were also studied during their first 4 postnatal days in a cross-sectional method. One blood sample was collected before breastfeeding from each infant. Plasma leptin con-centrations were determined by radioimmunoassay.
Results. The median (range) concentration of leptin from cord blood was increased in LGA infants and de-creased in SGA infants compared with the level in AGA infants. There was a positive correlation between the log of the plasma leptin level in cord blood and both the infant’s birth weight (r50.76; n569) and the body mass index (r 5 0.63; n5 69). The normal 3% to 6% weight reduction that occurs during the first 4 postnatal days was associated with a 26% decrease in the plasma leptin level in healthy breastfed infants.
Conclusions. The plasma leptin level is highly corre-lated to the size of adipose tissue mass and decreases in connection with the initial physiological weight loss in newborn infants. These data provide evidence that leptin is highly related to the nutritional status already during the fetal and neonatal periods.Pediatrics 1998;101:429 – 432;newborn infant, leptin, birth weight, weight loss.
ABBREVIATIONS. LGA, large for gestational age; SGA, small for gestational age; AGA, appropriate for gestational age; SD, stan-dard deviation; BMI, body mass index; NPY, neuropeptide Y.
L
eptin, the protein product of the obgene pro-duced in the adipose tissue, is involved in the body nutritional homeostasis through the con-trol of appetite and energy expenditure.1,2 Circulat-ing leptin concentrations are increased in obese chil-dren3and adults4,5 compared with those that are of normal weight. Furthermore, the expression of theobgene is subject to nutritional regulation being
mark-edly reduced after fasting both in humans4 and rats.6,7
This study was undertaken to investigate if leptin might be a regulator of nutritional state during fetal and neonatal life. Therefore, we examined whether leptin could be detected in plasma at concentrations that correlated with birth weight and whether plasma leptin concentrations were reduced in con-nection with the physiological weight loss in healthy, exclusively breastfed, newborn infants.
PATIENTS AND METHODS
The study was approved by the Local Ethics Committee of the Karolinska Hospital and the parents gave their informed consent. Seven groups of infants were studied, all delivered at term (ges-tational time,$37 weeks). Group 1 included infants that were large for gestational age (LGA) (n515); 12 of 15 were normal pregnancies and 3 of 15 had maternal type I diabetes. Group 2 included infants that were small for gestational age (SGA) (n5 16); 13 of 16 were normal pregnancies, beside the intrauterine growth retardation, 3 of 16 also had mild preeclampsia. Infants in Group 1 and Group 2 were delivered either with normal delivery or cesarean section. Group 3 included infants with birth weights appropriate for gestational age (AGA) (n538); these were all born after normal pregnancy and delivery. Birth weight was assessed on a digital scale and then evaluated according to Marsa´l et al.8
Neonates were classified as SGA or LGA if birth weight was below or greater than 2 standard deviations (SD) of mean gestational age-related intrauterine weight. Mean body mass index (BMI), defined as the weight in kilograms divided by the square of the length in meters, was calculated. See Table 1 for anthropometric and clinical data. Blood samples for the leptin determination were collected at delivery by double clamping the umbilical cord at the placental end and the infant end within 5 seconds after birth. In Group 3 one blood sample was also collected from the mothers (n517) within 10 minutes of delivery by puncture of an antecu-bital vein.
To investigate the effect of weight loss on the leptin level, we also studied AGA infants (n5120) during the first 4 postnatal days using a cross-sectional method; the cord level from AGA infants of Group 3 constituted the start measurement. These in-fants were all delivered after normal pregnancy and delivery and all had an uneventful neonatal period; they were exclusively breastfed on demand. As part of the study design, the mothers weighed their infants on a digital scale each morning. A blood sample for the leptin determination was randomly collected at a postnatal age of 1664 hours (mean6SD) (n 530; Group 4); when the infant was 1 day old (24#hours,48) (n530; Group 5); when the infants were 2 days old (48#hours,72) (n530; Group 6); and when the infants were 3 days old (72#hours,96) (n530; Group 7). There was no systematic difference between the age groups as to maternal age, parity, infant’s birth weight, or sex (for details, see Tables 1 and 2). Blood samples were always collected before a feeding, between 8amand 2pmwhen the infant woke up spontaneously and displayed hunger signals. Hunger signals were defined as the presence of spontaneous rooting and/ sucking movements and increased gross motor activity of the limbs eventually followed by crying. The interval from the previ-ous feeding was recorded. Each infant contributed one blood sample collected from a vein on the back of the hand or from an antecubital vein with an open needle technique. Blood samples were collected in ice-chilled plastic tubes containing 10 IU heparin From the Department of Woman and Child Health, Karolinska Institute,
Karolinska Hospital, Stockholm, Sweden.
Received for publication Mar 11, 1997; accepted Sep 2, 1997.
Reprint requests to (G.M.) Department of Women and Child Health, Karo-linska Hospital, 171 76 Stockholm, Sweden.
(Kabi AB, Stockholm, Sweden) and 500 IU aprotinin (Bayer AB, Stockholm, Sweden)/mL blood. Plasma was obtained by centrif-ugation at 4°C for 10 minutes and was then frozen at270°C until the time of assay. Leptin concentrations were determined in plasma by a commercially available kit (Linco Research IMC, St Charles, MO). The limit of detection was 0.5mg/L, the intraassay standard coefficient of variation was 3.9%, and the interassay coefficient of variation was 4.7% at the leptin concentration of 10.460.5mg/L.
Statistics
Clinical and anthropometric data of the study populations are given as mean 6SD. Because the plasma leptin concentrations followed a non-Gaussian distribution, these data are given as median (range) and we used the Mann-WhitneyUtest to evaluate possible differences in the plasma leptin concentrations from cord blood between LGA, SGA, and AGA infants. Multiple regression analysis was performed to evaluate the relation of the plasma leptin concentration to birth weight and BMI; leptin was plotted on a log scale, as the levels were not normally distributed. We used the Kruscal-Wallis rank test, followed by the Mann-Whitney
Utest to evaluate possible differences in leptin concentrations in relation to postnatal age in AGA infants. Differences between maternal and umbilical cord levels in AGA infants were assessed by the Wilcoxon rank sum test.
RESULTS
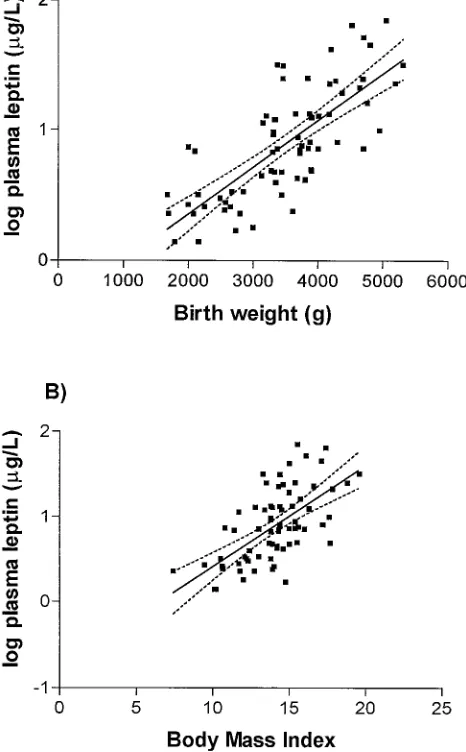
The median (range) plasma leptin concentration in cord blood from LGA infants was 24.1 (10.0 –71.0) mg/L as compared with 7.3 (1.8 –32.1)mg/L in AGA infants (P, .001). The median leptin concentration in SGA infants was 2.6 (1.4 –7.4) mg/L, which was significantly lower (P , .001) compared with the level in AGA infants. There was a positive correla-tion between the log of the plasma leptin concentra-tion in cord blood and both the infant’s birth weight (r50.76, n569,P,.001) and the BMI (r50.63, n5 69,P, .001) (see Fig 1). No significant relationship was found between gender and leptin cord level in LGA (P..06), SGA (P..1), or AGA infants (P..4). The median leptin concentration in cord blood from AGA infants was significantly lower (P ,.01) than corresponding maternal levels in venous blood 20.0 (3.6 –29.0)mg/L. There was no significant differ-ence in the leptin concentration between arterial [5.2 (3.2–14.2) mg/L; n5 8] and venous cord blood [5.3 (2.6 –17.5)mg/L; n5 8].
AGA infants lost 3% to 6% of their birth weight
during the first 4 days after birth (Table 3). The infant’s leptin concentration fell significantly at 166 4 hours (mean6SD) after birth compared with the level in umbilical cord blood (P , .001) and re-mained constantly low for the following 3 days (for details, see Table 3). Leptin levels were not signifi-cantly (P..1) related to the duration of the interval between two subsequent feedings or to the degree of weight reduction during the 4 postnatal days (data not shown).
There was a negative correlation between the lep-tin concentration and postnatal age during the first day of life (r50.38,P,.05, n530), but not at any other postnatal age.
DISCUSSION
We found that LGA infants had higher and SGA infants had lower leptin concentrations than AGA infants. The leptin concentration was highly corre-lated to both birth weight and BMI. Furthermore, we also found that the physiological neonatal weight loss was associated to a reduction of the plasma leptin level.
The leptin level in cord blood from AGA infants was comparable to that previously described in cord blood9,10 and to that found in both normal weight children3 and adults.5 The infants had, however, lower levels than their corresponding mothers; this is probably attributable to the pregnant woman’s ac-quisition of adipose tissue. Furthermore, the cord level does not seem to be influenced by the birth process because we found no significant difference in leptin levels from cord blood between normal vagi-nal delivery and elective cesarean section (for details, see Fig 2).
LGA infants had threefold more plasma leptin than AGA infants; the level was comparable to that described in obese children (mean age, 11 years)3and adults.5SGA infants had only one-half as high hor-mone levels as AGA infants, presumably reflecting the reduced body fat content of these infants. Leptin is produced in the adipocytes and the leptin level is regulated by direct changes in the expression of the
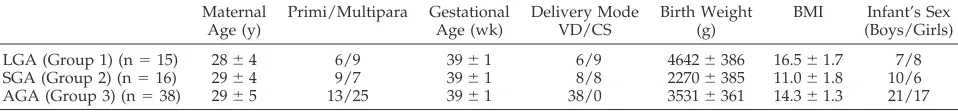
TABLE 1. Antropometric and Clinical Data of the Study Populations* Maternal Age (y) Primi/Multipara Gestational Age (wk) Delivery Mode VD/CS Birth Weight (g)
BMI Infant’s Sex (Boys/Girls)
LGA (Group 1) (n515) 2864 6/9 3961 6/9 46426386 16.561.7 7/8
SGA (Group 2) (n516) 2964 9/7 3961 8/8 22706385 11.061.8 10/6
AGA (Group 3) (n538) 2965 13/25 3961 38/0 35316361 14.361.3 21/17
Abbreviations: VD, vaginal delivery; CS, cesarean section.
* Values are mean6SD. The number of infants are given within parentheses.
TABLE 2. Anthropometric and Clinical Data on the Study Populations* Infant’s Age (d) Maternal Age
(y)
Primi/Multipara Gestational Age (wk)
Birth Weight (g)
Infant’s Sex (Boys/Girls)
Group 3 Umbilical cord (n538) 2965 13/25 3961 35006371 21/17
Group 4 1664 hours (n530) 3164 11/19 3961 35116370 12/18
Group 5 1 (n530) 2964 14/16 4061 35836304 15/15
Group 6 2 (n530) 3166 12/18 4061 37616338 13/17
Group 7 3 (n530) 3065 11/19 4061 36596400 18/12
* Values are mean6SD. The number of infants are given within parentheses.
obgene in both humans4,5and rodents.6The hormone level is highly correlated to both BMI and percentage body fat in humans.5
We also found that the reduction of 3% to 6% of body weight that occurred during the first 4 postna-tal days was associated with a reduction of 26% in plasma leptin in healthy breastfed infants. The new-born infant is subjected to a transitory period of
reduced nutritional intake during the first few days after birth because lactation is not fully established so early after delivery. As a consequence of this, the infant exhibits a physiological reduction of body weight which, in average, is 5% to 6% of birth weight.11 Fasting is associated with a decrease in both the leptin level as well as the obgene expres-sion4in humans and rodents.6One important site of action for leptin seems to be the ventromedial hypo-thalamic arcuate nucleus where it may interact with appetite-regulating systems, because the hormone decreases biosynthesis and secretion of neuropeptide Y (NPY), which is a potent stimulator of appetite.12 After only 4% of weight loss, there is a 43% reduction of arcuate NPY mRNA in mice, indicating a clear effect of leptin in reducing NPY gene expression.13 The reduced intake of nutrients and fluid experi-enced by the infant during the first days after birth may constitute a signal to reduce leptin production so that appetite would not be inhibited; in fact, the behavior of the infants in this study, characterized by the presence of spontaneous hunger signals could have been affected by the reduced leptin expression. This signal may, at least in part, be working through a lowered insulin tone. Another physiological stim-ulus besides fasting that has been shown to affect the leptin level is cold exposure, which causes a decrease in both the leptin level14 and ob gene expression in rats.15 The reduction of the infant’s body tempera-ture, as a consequence of the extrauterine adapta-tion,16could therefore also contribute to a the initial decrease in leptin secretion. Fasting and cold expo-sure are also accompanied by increased lipolysis and elevated levels of free fatty acids. Free fatty acids cause a concentration-dependent inhibition of leptin mRNA levels in cultured mouse adipocytes.17 The immediate neonatal metabolic adaptation character-ized by a rapid onset of lipolysis with high levels of free fatty acid11 could be an adjunctive factor sup-pressing the leptin level. Because the hypothalamus integrates metabolic control, thermal homeostasis, and modulating feeding behavior through an
exten-Fig 1. The relation between the log of the plasma leptin concen-tration and A) birth weight (r50.76;P,.001) and B) BMI (r5
0.63;P,.001) in 38 AGA infants, 15 LGA infants, and 16 SGA infants.
Fig 2. Plasma leptin concentrations from cord blood after normal vaginal delivery (n517) and after elective cesarean section (n5 17). All infants were delivered at term and their birth weight was appropriate for gestational age. Median and individual values are given. There was no significant difference in the leptin level be-tween the two groups (P..1, Mann-WhitneyUtest).
TABLE 3. Plasma Leptin Concentrations and Weight Loss in Healthy Newborn Infants (n5158) During Their First Four Days of Life*
Infant’s Age (d) (n) Leptin
(mg/L) Weight Loss(% of Birth Weight)
Umbilical cord (Group 3) (38) 7.3 (1.8–32.1)
1664 h (Group 4) (30) 1.9 (0.7–6.6) 3.2 (0.4–5.7) 1 (Group 5) (30) 1.8 (1.1–3.5) 6.0 (2.1–8.2) 2 (Group 6) (30) 2.0 (1.1–3.1) 6.4 (0.1–12.6) 3 (Group 7) (30) 1.9 (1.3–5.0) 5.7 (0.3–15.7)
sive neuronal network,18obgene expression is prob-ably affected by various physiological stimuli.
CONCLUSIONS
In summary, plasma leptin levels are increased in LGA infants and decreased in SGA infants. The level is directly proportional to adipose tissue mass. Fur-thermore, the normal neonatal weight loss is associ-ated with an acute decrease in the leptin level, prob-ably as a result of the extrauterine adaptation. Taken together, these findings indicate that leptin may par-ticipate in the regulation of nutritional homeostasis already present during fetal and neonatal life.
ACKNOWLEDGMENTS
This work was supported by grants from the foundations: Mjo¨lkdroppen, Svenska La¨karsa¨llskapet, Sa¨llskapet Barnavård, KI-fonder, MFR 14X-57164.
REFERENCES
1. Zhang Y, Proenca R, Maffei M, Barone M, Leopold L, Friedman JM. Positional cloning of the mouse obese gene and its human homologue. Nature. 1994;372:425– 432
2. Halaas JL, Gajiwala KS, Maffei M, et al. Weight-reducing effects of the plasma protein encoded by the obese gene.Science. 1995;269:543–546 3. Hassink SG, Sheslow DV, de Lancey E, Opentanova I, Considine RV,
Caro JF. Serum leptin in children with obesity: relationship to gender and development.Pediatrics. 1996;98:201–203
4. Maffei M, Halaas J, Ravussin E, et al. Leptin levels in human and rodent: measurement of plasma leptin and obRNA in obese and weight-reduced subjects.Nature. 1995;1:1155–1161
5. Considine RV, Sinha MK, Heiman ML, et al. Serum immunoreactive-leptin concentrations in normal-weight and obese humans. N Engl
J Med.1996;334:292–295
6. Fredrich RC, Lo¨llman B, Hamann A, et al. Expression ofobmRNA and its encoded protein in rodents.J Clin Invest.1995;96:1658 –1663 7. Trayhurn P, Thomas MEA, Duncan JS, Rayer DV. Effects of fasting and
refeeding onobgene expression in white adipose tissue of lean and obese (ob/ob) mice.FEBS Lett.1995;368:488 – 490
8. Marsa´l K, Persson P-H, Larsen T, Lilja H, Selbing A, Sultan B. Intra-uterine growth curves based on ultrasonically estimated foetal weights. Acta Paediatr.1996;85:843– 848
9. Schubring C, Kiess W, Englaro P, Rascher W, Blum W. Leptin concen-trations in amniotic fluid, venous and arterial cord blood and maternal serum: high leptin level in the fetus and inverse correlation with pla-cental weight.Eur J Pediatr. 1996;155:830 – 834
10. Sivan E, Lin WM, Homko CJ, Reece EA, Boden G. Leptin is present in human cord blood.Diabetes. 1997;46:917–919
11. Marchini G, Persson B, Uvna¨s-Moberg K. Plasma gastrin and soma-tostatin levels in infants during the first four postnatal days. J Dev Physiol. 1990;14:157–162
12. Stephens TW, Basinski M, Bristow PK, et al. The role of neuropeptide Y in the antiobesity action of theobesegene product.Nature. 1995;377: 530 –532
13. Schwartz MW, Baskin DG, Bukowski TR, et al. Specificity of leptin actin on elevated blood glucose levels and hypothalamic neuropeptide Y gene expression inob/obmice.Diabetes.1996;45:531–535
14. Hardie LJ, Rayner DV, Holmes S, Trayhurn P. Circulating leptin levels are modulated by fasting, cold exposure and insulin administration in lean but not Zucker(fa/fa)rats as measured by ELISA.Biochem Biophys Res Commun. 1996;223:660 – 665
15. Trayhurn P, Duncan JS, Rayner DV. Acute cold-induced suppression of obgene expression in white adipose tissue of mice: mediation by the sympathetic system.Biochem J. 1995;311:729 –733
16. Marchini G, Persson B, Marcus C. Influence of body temperature on thyrotropic hormone release and lipolysis in the newborn infant.Acta Paediatr. 1995;84:1284 –1288
17. Rentsch J, Chiesi M. Regulation ofobgene mRNA levels in cultured adipocytes.FEBS Lett. 1996;379:55–59
18. Reichlin S. Neuroendocrinology.N Engl J Med. 1963;269:1182–1303
DOI: 10.1542/peds.101.3.429
1998;101;429
Pediatrics
Giovanna Marchini, Gabriel Fried, Eva Östlund and Lars Hagenäs
Plasma Leptin in Infants: Relations to Birth Weight and Weight Loss
Services
Updated Information &
http://pediatrics.aappublications.org/content/101/3/429
including high resolution figures, can be found at:
References
http://pediatrics.aappublications.org/content/101/3/429#BIBL
This article cites 18 articles, 5 of which you can access for free at:
Subspecialty Collections
sub
http://www.aappublications.org/cgi/collection/fetus:newborn_infant_
Fetus/Newborn Infant
http://www.aappublications.org/cgi/collection/endocrinology_sub
Endocrinology
following collection(s):
This article, along with others on similar topics, appears in the
Permissions & Licensing
http://www.aappublications.org/site/misc/Permissions.xhtml
in its entirety can be found online at:
Information about reproducing this article in parts (figures, tables) or
Reprints
http://www.aappublications.org/site/misc/reprints.xhtml
DOI: 10.1542/peds.101.3.429
1998;101;429
Pediatrics
Giovanna Marchini, Gabriel Fried, Eva Östlund and Lars Hagenäs
Plasma Leptin in Infants: Relations to Birth Weight and Weight Loss
http://pediatrics.aappublications.org/content/101/3/429
located on the World Wide Web at:
The online version of this article, along with updated information and services, is
by the American Academy of Pediatrics. All rights reserved. Print ISSN: 1073-0397.
the American Academy of Pediatrics, 345 Park Avenue, Itasca, Illinois, 60143. Copyright © 1998 has been published continuously since 1948. Pediatrics is owned, published, and trademarked by Pediatrics is the official journal of the American Academy of Pediatrics. A monthly publication, it
at Viet Nam:AAP Sponsored on August 30, 2020
www.aappublications.org/news