The Effects Of The Distribution
Of Agricultural Direct Payments
José Luis Alfaro-Navarro, Ph.D., University of Castilla-La Mancha, Spain José Mondéjar-Jiménez, Ph.D., University of Castilla-La Mancha, Spain Manuel Vargas-Vargas, Ph.D., University of Castilla-La Mancha, Spain
Juan Carlos Gázquez-Abad, Ph.D., University of Almería, Spain José Felipe Jiménez- Guerrero, Ph.D., University of Almería, Spain
ABSTRACT
The Common Agricultural Policy (the CAP) is the most important common policy of the European Union, for which reason it traditionally monopolizes a large part of the European Union budget. Without doubt, the aids that farms receive from this policy are the pillar on which it sustains the battered agricultural sectors. Among CAP aid, direct payments are particularly important, in 2008 accounting for about 37% of the total EU budget.
The main objective of this paper is to analyse the effects that the distribution of the CAP direct payments have on the agrarian economy. Specifically, we have analysed the equality level in distribution of CAP direct aid in the countries of the European Union using a concentration index. In this way, we have examined the fairness of distribution of CAP direct aid in the agricultural sector.
Keywords: Common Agricultural Policy, Concentration Index, Distribution
1. INTRODUCTION
he Common Agricultural Policy (CAP) is the European Union's most important common policy, which is why it traditionally takes up a large part of the European Union budget. It is clear that European Union funds through CAP aid have been one of the basic pillars in guaranteeing sustainability and survival of the countryside (Alfranca, 2006).
Inequality in the distribution of aid or, more generally, the contribution of the CAP to the distribution of income, have been considered by the European Commission (1991 and 2002) after successive reforms of the CAP. Unfair aid distribution and its lack of transparency (Montero et al., 2009) have generated public controversy. However, there have been few empirical studies which have characterized and quantified the effects of the agricultural aid programmes on the distribution of agricultural income, although they have all been carried out from the point of view of concentration analysis using the Gini coefficient. These studies can be divided into two large groups. The first group examines the effect CAP aid has had on various aspects of agriculture, especially the distribution of income (Keeney, 2000; Frawley and Keeney, 2000; Rocchi et al., 2005; Allanson, 2006, 2007 and 2008; Allanson and Rocchi, 2008), while the second group includes studies of the distribution of aid in different geographical areas. This study falls within the second type of study, analysing the distribution of CAP aid in the different countries of the European Union (EU).
To this end, Schmid et al. (2006) analysed the distribution of direct CAP payments in the different countries of the EU-15. The results showed the existence of significant differences in the distribution of aid among the different countries with the existence of a bias towards the receipt of large amounts of aid by large landowners in some member state. In Sinabell et al. (2008 and 2009) the study was broadened to include data for 2000 and 2006, but with very similar conclusions. Comparison of the 14 members of the European Union in 2000 and 2006 showed
The concentration of aid has been a thorny subject for EU members, because most have progressive tax systems aimed at greater distribution of wealth, so any increase in the concentration of income is subject to examination by the EU's active policies. It must be stressed that, although the image of farmers in Europe is not generally good, because of the high prices of farm produce, the prices actually received by farmers (farm gate prices) have barely risen, in many cases it being intermediaries who are speculating with staple foods (Alfaro et al., 2011).
So this study tries to analyse the level of concentration existing in agricultural sector aid in EU countries in the period 2002-2008, using the Gini concentration index (Gini, 1912; 1921), studying variations in the aid received and its development.
2. METHODS
In examining farm income distributions, many studies have used the Gini coefficient. As already pointed out, this coefficient is widely followed in the economic literature investigating distributional issues. In the field of agricultural economics, it has been used to study the distribution of subsidies, income, wealth, operated land or land ownership across farms. In this paper we have use this index to analyse the distribution of the total direct aids in15 countries of the European Union. We have considered only 15 countries because in this form we can have more information about the distribution of direct aid in order to make comparison in the evolution of this distribution.
2.1 Distribution of the aid directs in the EU15
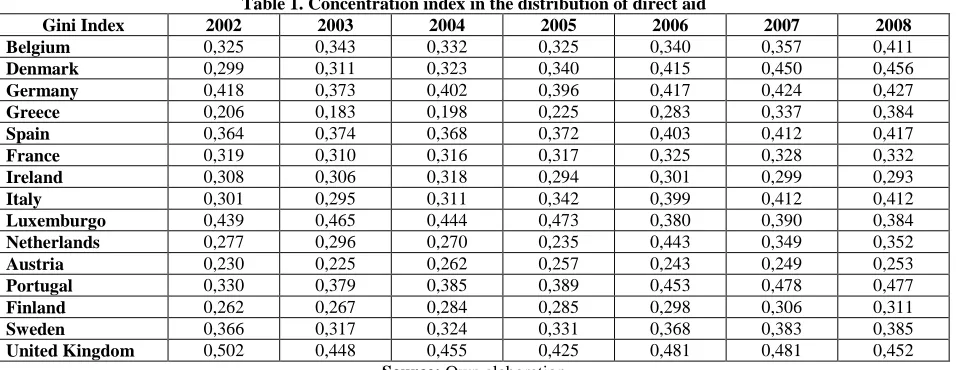
The Europe Commission receives from the Member States, on an annual basis, data on the payments made to the beneficiaries of the European Agricultural Guarantee Fund (EAGF). Using this information we analyse the distribution of the all direct payments in the 15 members of the European Union. Thus, the table 1 show the concentration index for these countries.
Table 1. Concentration index in the distribution of direct aid
Gini Index 2002 2003 2004 2005 2006 2007 2008
Belgium 0,325 0,343 0,332 0,325 0,340 0,357 0,411
Denmark 0,299 0,311 0,323 0,340 0,415 0,450 0,456
Germany 0,418 0,373 0,402 0,396 0,417 0,424 0,427
Greece 0,206 0,183 0,198 0,225 0,283 0,337 0,384
Spain 0,364 0,374 0,368 0,372 0,403 0,412 0,417
France 0,319 0,310 0,316 0,317 0,325 0,328 0,332
Ireland 0,308 0,306 0,318 0,294 0,301 0,299 0,293
Italy 0,301 0,295 0,311 0,342 0,399 0,412 0,412
Luxemburgo 0,439 0,465 0,444 0,473 0,380 0,390 0,384
Netherlands 0,277 0,296 0,270 0,235 0,443 0,349 0,352
Austria 0,230 0,225 0,262 0,257 0,243 0,249 0,253
Portugal 0,330 0,379 0,385 0,389 0,453 0,478 0,477
Finland 0,262 0,267 0,284 0,285 0,298 0,306 0,311
Sweden 0,366 0,317 0,324 0,331 0,368 0,383 0,385
United Kingdom 0,502 0,448 0,455 0,425 0,481 0,481 0,452
Source: Own elaboration
The country with the fairest distribution of aid in 2008 was Austria, with a concentration index of 0.253. This is not a new situation, as Austria has been in the top positions in terms of fairness of distribution of aid since 2002. In contrast, the greatest concentration of distribution is seen in Portugal, with a concentration index of 0.477 in 2008. It is notable that seven of the fifteen countries studied have a concentration index greater than 0.4, which shows the existence of a certain degree of concentration in distribution of aid. These results clearly show that in 2008 there were still many countries in which a few people received large amounts of aid.
2.2 An analyses of the evolution in the CAP distribution
For more thorough analysis, we used the Lorenz curve (Lorenz, 1905) on the countries where the greatest increase or regression in concentration levels occurred, these being Denmark, Greece, Portugal, Italy, Spain, the Netherlands, Belgium, Luxembourg and the United Kingdom.
Figures 1 to 3: Lorenz curve by country 2002 and 2008
Source: Own elaboration
Figures 1 to 3 represent the countries where the greatest increase in CAP aid concentration occurred in the period 2002 to 2008. It can be observed on the graph how the area below the bisecting line of the angle increases, leading to greater levels of concentration. These figures are especially relevant in Greece, which had the lowest concentration level in the EU-15 at the start of the period (2002), but ended 2008 exceeding six countries in concentration levels. Another notable case is Portugal, with the greatest rate of concentration of agricultural aid in the EU-15 in 2008, displacing from this position the United Kingdom, which had the highest concentration level in the period 2002-2007.
Figures 4 to 6: Lorenz curve by country 2002 and 2008
Source: Own elaboration
Italy, Spain and Holland (Figures 4 to 6) show increases in concentration, but less important than the foregoing. It is significant that the three countries have a large agricultural sector, which suggests that in spite of the sector's low profitability; numerous farms remain and are disappearing more slowly than in other countries.
0 20 40 60 80 100
0 20 40 60 80 100
DENMARK 0 20 40 60 80 100
0 20 40 60 80 100
GREECE 0 20 40 60 80 100
0 20 40 60 80 100
PORTUGAL 0 20 40 60 80 100
0 20 40 60 80 100
ITALY 0 20 40 60 80 100
0 20 40 60 80 100
SPAIN 0 20 40 60 80 100
0 20 40 60 80 100
Figures 7 to 9: Lorenz curve by country 2002 and 2008
Source: Own elaboration
There is a third group of countries made up of Belgium (which, although its concentration level has not decreased, has an agricultural sector of less importance in the overall economy of the country), Luxembourg and the United Kingdom, which have reduced their concentration levels. It is noteworthy that in a context of stable, continuous increase, certain countries have reduced their concentration levels (in addition to those mentioned, the interannual rates of other countries such as Germany or France have barely increased). This fact shows how countries which have been receiving this kind of aid for a longer time are now tending to redistribute their aid, also because of the deterioration of other production sectors with consequent partial reorientation towards agriculture.
3. CONCLUSIONS
The concentration of agricultural aid is linked to two primordial factors, land ownership and the legislation regulating aid collection. Assuming that the first of these factors is determined beforehand, we can only establish different scenarios of future policies conditioning concentration levels. So the new community legislation on single payment conditions concentration levels, because the existing grants (mostly uncoupled) do not allow sector regeneration.
The loss of importance of the agricultural sector in the EU countries in general, where the economy has been tertiarized, together with entry barriers for young farmers who do not own land and lack incentives to rent, condition and encourage increases in concentration: there are increasingly fewer active receivers of aid and new additions to the sector are not encouraged. It should be remembered that this is a sector with high levels of specialization and which is increasingly less labour-intensive, because of the huge increase in mechanization of the sector.
The results of our concentration analyses reveal the sector's concentration increases (except for two countries). For this reason, the present aid system and its implications for rural areas need to be rethought. In view of these results and bearing in mind the continuous budget cuts of the Common Agricultural Policy, it is increasingly difficult for it to meet one of the primordial objectives of that policy, “to maintain the rural population”: farmers cannot maintain their subsistence incomes and so have to abandon the countryside in search of other job opportunities.
The constantly worsening image of farmers held by the citizens of the European Union conditions the overall budgets. This deterioration has been made more acute by external problems: speculation with raw materials, competition from other countries and, finally, high prices of products at their destination (which can be 10 times the source price), practices blamed almost totally on the farmers of the EU members, who are not responsible for them.
There is no doubt that the main budget policy of the European Union should take all these factors into account on its new temporal horizon. For this reason, it should take into account one of the sector's main indicators, the levels of aid concentration in recent years.
0 20 40 60 80 100
0 20 40 60 80 100
BELGIUM
0 20 40 60 80 100
0 20 40 60 80 100
LUXEMBOURG
0 20 40 60 80 100
0 20 40 60 80 100
AUTHOR INFORMATION
José-Luis Alfaro-Navarro,PhD in Economics and Degree in Business Administration by University of Castilla-La Mancha. Assistant Professor at Statistics Department. Faculty of Economics and Business Administration of Albacete. University of Castilla-La Mancha (Spain). E-mail: [email protected].
Research Interest: statistical quality control, regional analysis and agrarian prices.
José Mondéjar-Jiménez,European PhD in Economics and Degree in Business Administration by University of Castilla-La Mancha. Associate Professor in Statistics at Statistics Department. Faculty of Social Sciences of Cuenca. University of Castilla-La Mancha (Spain). E-mail: [email protected].
Research Interest: Regional analysis, educational, tourism and environment.
Manuel Vargas-Vargas,PhD in Economics by University of Castilla-La Mancha and Degree in Mathematics by University of Granada. Associate Professor in Statistics at Statistics Department. Faculty of Economics and Business Administration of Albacete, University of Castilla-La Mancha (Spain).E-mail: [email protected].
Research Interest: State-space models, educational, tourism and environment.
Juan Carlos Gázquez-Abad,PhD in Economics and Degree in Business Administration by University of Almería. Associate Professor in Marketing at Business Department. Faculty of Economics and Business Administration, University of Almería. E-mail: [email protected]
Research interests: Retailing, sales promotions, consumer behaviour and agricultural marketing.
José Felipe Jiménez-Guerrero,PhD in Economics by University of Almería. Professor in Marketing at Business Department. Faculty of Economics and Business Administration, University of Almería. E-mail: [email protected]
Research interests: Consumer behaviour, agricultural marketing and tourism.
REFERENCES
1. Alfaro, J. L., Andrés, M. E., Mondéjar, J. and Mondéjar, J. A. (2011): “Evolución de los márgenes comerciales usando indicadores sintéticos: una aplicación en el sector agroalimentario español (2005-2009)”. Agroalimentaria, 16(32), pp. 47-56.
2. Alfranca, O. (2006): “La PAC y las Políticas Agrarias”. Clm.economía, 9, pp. 155-188.
3. Allanson, P. (2006): “The redistributive effects of agricultural policy on Scottish farm incomes”. Journal of Agricultural Economics, 57, pp. 117–128.
4. Allanson, P. (2007): “Classical horizontal inequities in the provision of agricultural income support”.
Review of Agricultural Economics, 29, pp. 656-671.
5. Allanson, P. (2008). “On the characterisation and measurement of the redistributive effect of agricultural policy”. Journal of Agricultural Economics, 59, pp. 169–187.
6. Allanson, P. and Rocchi, B. (2008): “A comparative analysis of the redistributive effects of agricultural policy in Tuscany and Scotland”. Review of Agricultural and Environmental Studies, 86, pp. 35–56. 7. European Commission (1991): The Development and Future of the CAP (Brussels: Reflections Paper of
the Commission, COM(91) 100 final, 1991).
8. European Commission (2000): Agenda 2000: For a Stronger and Wider Europe. Supplement to the Bulletin of the European Union 5/97, COM(97) 2000 (Luxembourg: Office for Official Publications of the
European Communities, 1997).
10. Frawley, J. P., Keeney, M. (2000): “The Impact of Direct Payments on Farm Income Distribution”. Project Report (Project No. 4656), Dublin.
11. Gini, C. (1912): “Variabilità e mutabilità”. Studi Economico-Giuridici dell’Università di Cagliari, 3, pp. 1-158.
12. Gini, C. (1921): “Measurement of Inequality of Incomes”. The Economic Journal, 31 (121), pp. 124-126 13. Keeney, M. (2000): “The distributional impact of direct payments on Irish farm incomes”. Journal of
Agricultural Economics, 51, pp. 252–265.
14. Lorenz, M. O. (1905): “Methods of Measuring the Concentration of Wealth”. Publications of the American Statistical Association, 9 (70), pp. 209-219
15. Montero, J. M., Alfaro, J. L., Mondéjar, J. and Meseguer, M. L. (2009). “Transparencia: una condición necesaria para el estudio de la concentración en el reparto de las ayudas de la PAC”. Clm.economía, 13, pp. 9–51.
16. Rocchi B., Romano D. and Stefani G. (2005): “Distributive impacts of alternative agricultural policies: A SAM based analysis for Italy”. Cahiers d’économie et sociologie rurales, 77, pp.86-112.
17. Schmid, E., Sinabell, F., Hofreither, M. f. (2006): “Direct Payments of the CAP – Distribution Across Farm Holdings in the EU and Effects on Farm Household Incomes in Austria”. Working Paper, DP-19-2006. Wien, Austria: Boku.
18. Sinabell, F., E. Schmid and Hofreither, M. F. (2008): “Exploring the Distribution of Direct Payments of the Common Agricultural Policy”. WIFO Working Papers, 330/2008, Austrian, Institute of Economic
Research, Vienna.