University of Pennsylvania
ScholarlyCommons
Publicly Accessible Penn Dissertations
2016
Endpoints In Intensive Care Unit Based
Randomized Clinical Trials
Michael Oscar Harhay
University of Pennsylvania, michael.harhay@gmail.com
Follow this and additional works at:
https://repository.upenn.edu/edissertations
Part of the
Epidemiology Commons
This paper is posted at ScholarlyCommons.https://repository.upenn.edu/edissertations/2326
For more information, please contactrepository@pobox.upenn.edu.
Recommended Citation
Harhay, Michael Oscar, "Endpoints In Intensive Care Unit Based Randomized Clinical Trials" (2016).Publicly Accessible Penn Dissertations. 2326.
Endpoints In Intensive Care Unit Based Randomized Clinical Trials
Abstract
With few exceptions, intensive care unit (ICU)-based randomized clinical trials (RCTs) have failed to demonstrate hypothesized treatment effects. Undoubtedly, some of these failures are attributable to
interventions that truly do not provide hoped-for benefits. However, this dissertation pursues the thesis that many null findings represent “false negatives” that are due not to ineffective therapies but to flawed study designs or analytic approaches. We examine the design and statistical methods traditionally employed in ICU-based RCTs, and their potential impacts on the efficient measurement and interpretation of treatment effects. Paper one presents a systematic review of 146 contemporary ICU-based RCTs in which we find that most trials were underpowered to detect small but potentially important mortality differences between treatment arms. We also find that the majority of RCTs (73%) specified primary outcomes other than mortality, that trials employing nonmortal primary outcomes more frequently identified significant treatment effects, and that both mortal and nonmortal endpoints were heterogeneously defined, measured and analyzed across RCTs. Thus, papers two and three focus on nonmortal endpoints, using ICU length of stay (LOS) as a case study to evaluate how best to measure and analyze duration-based nonmortal endpoints. In paper two, we conduct a statistical simulation study, demonstrating that nonmortal endpoints are interlinked with and confounded by mortality, and that the manner in which investigators choose to account for deaths in LOS analyses may influence their conclusions. In paper three, we examine another potential source of error in LOS analyses, namely the measurement error attributable to the additional ICU time that patients commonly accrue after they are clinically ready for ICU discharge. Using simulated data informed by our own ICU-based RCT, we demonstrate that this “immutable time” (which cannot plausibly be altered by the interventions under study) combines with clinically necessary ICU time to produce overall LOS distributions that may either mask true treatment effects or suggest false treatment effects. Our work provides evidence of the potential benefits and pitfalls when employing nonmortal outcomes in ICU-based RCTs, and also identifies a clear need for standardized methods for defining and analyzing such outcomes.
Degree Type
Dissertation
Degree Name
Doctor of Philosophy (PhD)
Graduate Group
Epidemiology & Biostatistics
First Advisor
Scott D. Halpern
Keywords
epidemiology
Subject Categories
Epidemiology | Medicine and Health Sciences
ENDPOINTS IN INTENSIVE CARE UNIT BASED RANDOMIZED CLINICAL TRIALS
Michael Oscar Harhay
A DISSERTATION
in
Epidemiology and Biostatistics
Presented to the Faculties of the University of Pennsylvania
in
Partial Fulfillment of the Requirements for the
Degree of Doctor of Philosophy
2016
Supervisor of Dissertation
________________________
Scott D. Halpern, MD, PhD
Associate Professor of Medicine, Epidemiology, and Medical Ethics and Health Policy
Graduate Group Chairperson
________________________
Nandita Mitra, PhD, Professor of Biostatistics
Dissertation Committee
Jason D. Christie, MD, MSCE, Robert M. Kotloff/Nancy Blumenthal Professor for Advanced Lung Disease, Professor of Medicine and Epidemiology
David J. Margolis, MD, PhD, Professor of Dermatology and Epidemiology
Sarah J. Ratcliffe, PhD, Professor of Biostatistics
ii
To Meera, Kiran and Nilan.
And to my father who always made education a priority,
even telling me to just find a master’s degree and enroll.
iii
ACKNOWLEDGMENT
I feel immensely grateful for having had the luxury of completing my PhD while my wife, Meera, and I built our family and home. Our relationship has followed the PhD curriculum. I met her while I was interviewing for programs, we had our wedding a month before my qualification exams, and our two children were both born a month prior to my thesis proposal and the first submission of this thesis. While hugs from my little girl can make any simulation study joyful, spending this time with Meera has reminded me each day how fortunate I am. I am indebted to many for the series of opportunities and events that supported and led to the completion of this work in this setting with my family. There are a few particular individuals that I’d like to thank here who were uniquely helpful when my plans weren’t clear and my skills were much more limited.
Larry Hass, Jeremy Teissére, and Jeffrey Rudski allowed me to tinker and craft my undergraduate education at Muhlenberg, which I believe ultimately led me to Penn. In my early weeks as a graduate student, Arthur Caplan was uniquely generous to me, providing
recommendations and opportunities that have put me on the path to completing this degree. And good fortune certainly played a role when I knocked on Darren Taichman’s office door in 2005. He gave me my first job, supported me through two master degrees, and remains a close friend. I can never say thank you enough to Arthur and Darren for helping me establish myself at Penn.
Darren and Arthur were mentors to Scott Halpern, who at that time was a pulmonary fellow. During a lunch in 2007, Scott patiently listened to my grand plans (that have since changed several times over) and offered his name and mentorship to help me reach these aims. Though his career has blossomed, he has enthusiastically continued in this capacity ever since, most recently serving as my PhD mentor. If I am ever viewed as a quality scientist, it is to Scott and the research setting he created for me that I must attribute my success.
I am grateful to Scott for many other reasons, more than I can enumerate here, but at the top of the list is the introduction to Sarah Ratcliffe. Razor sharp, boundlessly patient and always available, Sarah worked weekly (and often daily) with me to find new ways to answer the hard questions Scott laid out before me to solve. The consummate mentor, she taught me statistical theory on her notepad, while also helping me choose among index funds for my family. Working with her has been one of the greatest joys of my PhD.
Many other individuals have been generous teachers to me. Dylan Small mentored me through my MS in statistics as well as serving on my dissertation committee. His contributions to my work are widespread, and I hope we continue to work together for many years. Jason Christie and David Margolis, despite their many professional responsibilities and roles, have remained approachable scholars who kindly agreed to be members of my dissertation committee. Their ideas, input, and experience have always elevated my work and I am grateful to them for their time and insight. Many years ago in Geneva I met and worked with Piero Olliaro. While our research and locations have diverged, his influence over my career and life goals is omnipresent.
I also want to thank Daniel Polsky and Andrew Epstein for the opportunity to learn econometrics as an analyst on their projects from 2011-2012. They put up with me when I didn’t know much, and in doing so, that period in my academic life was intellectually transformative. Though I have often tried to thank them, it is hard to let them know how much they provided me.
Finally, I have had the fortune of sharing my experiences of doctoral studies (generally over beer) with Justin Brown, Henry Bergquist, Sean McElligott, and Kevin Haynes. To these individuals and the many other fantastic colleagues that I have met and worked with along the way, thank you.
Research reported in this dissertation was supported by the National Heart, Lung, and Blood Institute (F31-HL127947) and the National Cancer Institute (R01-CA159932 awarded to Scott Halpern) of the National Institutes of Health (NIH). I am enormously grateful for having had the good fortune of continuous funding support during the past 4.5 years from the NIH.
Nonetheless, I must inform readers that the content of this work is solely my responsibility and does not necessarily represent the official views of the NIH.
iv ABSTRACT
ENDPOINTS IN INTENSIVE CARE UNIT BASED RANDOMIZED CLINICAL TRIALS
Michael Oscar Harhay
Scott David Halpern
With few exceptions, intensive care unit (ICU)-based randomized clinical trials (RCTs) have failed to demonstrate hypothesized treatment effects. Undoubtedly, some of these failures are
attributable to interventions that truly do not provide hoped-for benefits. However, this dissertation pursues the thesis that many null findings represent “false negatives” that are due not to
ineffective therapies but to flawed study designs or analytic approaches. We examine the design and statistical methods traditionally employed in ICU-based RCTs, and their potential impacts on the efficient measurement and interpretation of treatment effects. Paper one presents a
v
TABLE OF CONTENTS
ACKNOWLEDGMENT ... iii
ABSTRACT ... iv
LIST OF TABLES... vi
LIST OF ILLUSTRATIONS ... vii
CHAPTER 1. INTRODUCTION ... 1
The growing burden and cost of critical illness ... 1
Randomization inference ... 2
Experimental evidence for treating critical illness ... 4
Dissertation aims ... 6
CHAPTER 2. OUTCOMES AND STATISTICAL POWER IN ADULT CRITICAL CARE RANDOMIZED TRIALS ... 9
Introduction ... 10
Methods ... 11
Results ... 17
Discussion ... 25
CHAPTER 3. NONMORTAL TRIAL ENDPOINTS: EMPIRICAL FRAMEWORK FOR A CASE STUDY OF INTENSIVE CARE UNIT LENGTH OF STAY ... 31
Rationale for examining nonmortal endpoints ... 31
Intensive care unit length of stay ... 31
Designing a simulation study of intensive care unit length of stay ... 32
CHAPTER 4. HETEROGENEITY IN THE DEFINITION AND ANALYSIS OF INTENSIVE CARE UNIT LENGTH OF STAY IN CRITICAL CARE TRIALS ... 35
Introduction ... 36
Methods ... 36
Results ... 39
Discussion ... 45
CHAPTER 5. MEASUREMENT ERROR IN INTENSIVE CARE UNIT LENGTH OF STAY ESTIMATES DUE TO PATIENT FLOW ... 51
Introduction ... 52
Methods ... 53
Results ... 59
Discussion ... 73
CHAPTER 6. CONCLUSIONS ... 77
Concluding remarks ... 79
vi
LIST OF TABLES
Table 1.1. Hypotheses to explain low efficacy in critical care randomized clinical trials ... 8
Table 2.1. Eligible journals and published critical care randomized clinical trials abstracted ... 11
Table 2.2. A priori selected outcomes ... 12
Table 2.3. Characteristics of adult randomized clinical trials in critical care ... 19
Table 2.4. Power and sample size characteristics of randomized clinical trials in critical care ... 21
Table 2.5. Selected recommendations for critical care trial design ... 30
Table 4.1. Leading approaches used to account for mortality in the analysis of length of stay ... 41
Table 4.2. Recommendations for reporting and analyzing nonmortal endpoints in critical care trials ... 50
vii
LIST OF ILLUSTRATIONS
Figure 2.1. Analytic sample of published randomized clinical trials of critical care interventions .. 18
Figure 2.2. Adjusted associations of selected RCT characteristics with positive primary outcomes ... 20
Figure 2.3. Expected versus actual treatment effect on mortality in 34 superiority trials where the primary outcome was mortality ... 22
Figure 2.4. Expected versus actual treatment effect in 47 superiority trials with a binary non-mortal primary outcome ... 23
Figure 2.5. Expected and observed rate of mortality in control arms in RCTs that tested the effect of an intervention on mortality... 24
Figure 2.6. Simulation results of superiority trials where the primary outcome was mortality assuming 80% power to find a treatment-associated mortality reduction of 3 to 15% ... 24
Figure 4.1. Variation in the reported definition of intensive care unit length of stay ... 40
Figure 4.2. Percent of simulations exhibiting interpretive errors (primary setting, short LOS, treatment effect of 2.5%) ... 43
Figure 4.3. Percent of simulations exhibiting interpretive errors (primary setting, long LOS, treatment effect of 2.5%) ... 43
Figure 4.4. Percent of simulations exhibiting interpretive errors (sensitivity analysis, control group mortality of 10%, uniform treatment effect of 2.5%) ... 44
Figure 4.5. Percent of simulations exhibiting interpretive errors (sensitivity analysis, control group mortality of 30%, uniform treatment effect of 5%) ... 44
Figure 4.6. Percent of simulations exhibiting interpretive errors (sensitivity analysis, control group mortality of 30%, heterogeneous treatment effect of 5%) ... 45
Figure 5.1. Decomposition of length of stay in an intensive care unit ... 52
Figure 5.2. Sample immutable time distributions used for the simulation study ... 57
Figure 5.3. ICU length of stay ending at time of bed request and actual discharge among patients discharged in the SUNSET RCT ... 60
Figure 5.4. Weekly variation of immutable time in the Medical Intensive Care Unit of the Hospital of the University of Pennsylvania, 2010-2012 ... 61
Figure 5.5. Variation of immutable time by month of the year in the Medical Intensive Care Unit of the Hospital of the University of Pennsylvania, 2010-2012 ... 62
Figure 5.6. Cumulative radar frequency graph of the time of day that a request for discharge was submitted and occurred (24-hour day) ... 63
Figure 5.7. Simulation results with no LOS reduction ... 65
viii
Figure 5.9. Simulation results with 10% baseline mortality, 1 day LOS reduction at the median .. 68
Figure 5.10. Simulation results with 20% baseline mortality, 0.5 day LOS reduction at the median ... 69
Figure 5.11. Simulation results with 20% baseline mortality, 1 day LOS reduction at the median 70
Figure 5.12. Simulation results with 40% baseline mortality, 0.5 day LOS reduction at the median ... 71
1
CHAPTER 1. INTRODUCTION
The growing burden and cost of critical illness
The demand for critical care, both in the United States (US) and worldwide, is outpacing
the discovery of interventions that can substantively improve outcomes in intensive care unit
(ICU) settings. In the US, one third of hospitalizations among patients older than 65 includes an
ICU stay (Milbrandt et al., 2008) and 20% of the US population dies in an ICU (Angus et al.,
2004). The global demand for and provision of critical care will likely grow in future years, both
because of aging populations where ICUs are prevalent as well as the expansion of critical care
in lower-income settings (Cook & Rocker, 2014; Fleischmann et al., 2016; Murthy et al., 2015).
The processes that lead to critical illness are diverse, which presents a challenge for
researchers seeking to study and compare interventions in homogeneous ICU patient
populations. Two paradigmatic examples of critical illness commonly encountered in ICU settings
are sepsis/septic shock (Singer et al., 2016) and the acute respiratory distress syndrome (ARDS)
(Force et al., 2012), both of which can result from acute or chronic illness and may present in a
variety of patient types (e.g., various ages, comorbid conditions). ICUs also provide life-saving
care for patients who are critically ill after surgery or trauma, as well as for a heterogeneous mix
of patients with other pathologies (e.g., cardiovascular disease, cancer).
Despite the diversity inherent in critical care settings, one unifying theme of critical illness
is its high cost, both in financial and human terms. In the US, 1% of the gross domestic product is
spent on the provision of critical care, exceeding $80 billion per year, and representing
approximately 3% of all health care spending (N. A. Halpern et al., 2016; N. A. Halpern &
Pastores, 2010). In addition to the financial burden, survivors of critical illness are often left with
physical, cognitive and psychosocial deficits that impede long-term quality-of-life (QOL) (Adhikari
2
& Hall, 2014; Mikkelsen et al., 2012; Spragg et al., 2010). There is also a growing awareness of
the downstream impact of critical illness on patients’ caregivers, family members, and friends,
who are called upon to cope with the loss of their loved ones after witnessing their suffering, or to
provide daily care to survivors who require prolonged periods of time to regain their
independence (Azoulay et al., 2005; Cameron et al., 2016; C. E. Cox et al., 2009). For instance,
roughly one third of decision-makers for critically ill patients develop post-traumatic stress
disorder or complicated grief that lasts months to years (Azoulay et al., 2005; Wendler & Rid,
2011). Finally, there is the lasting impact on the critical care workforce (i.e., physicians and
nurses) who must face death frequently and often report on the futility of the care they deliver,
resulting in high rates of burnout (S. D. Halpern, 2011b; Hamric & Blackhall, 2007; Meltzer &
Huckabay, 2004; Piers et al., 2011).
Given the burden and costs of critical illness, innovations that improve outcomes among
the critically ill have the potential to make vast impacts. Indeed, there is an impetus to advance all
aspects of critical care, from the delivery of cost-effective care to the improvement of
patient-centered outcomes including quality-of-life. However, studies investigating promising therapies
and clinical interventions in ICU settings have met with limited success, a topic that will be further
illustrated in the second chapter of this dissertation.
Randomization inference
Randomized clinical trials (RCTs) are considered the “gold standard” for producing the
experimental evidence required to assess the efficacy and safety of interventions. The pursuit of
an RCT-generated evidence base pervades all medical disciplines, and more recently has
extended into the social sciences. This is because randomization, or randomly allocating patients
to a study arm, probabilistically balances study arms on all pretreatment or baseline factors
3
when conducting hypothesis tests that compare study arms on post-randomization outcomes. As
a result, random assignment of an intervention supports an estimate of the treatment effect that is
independent of the error term. The result is an unbiased estimate of the impact of an intervention.
The attractions and benefits of an RCT over observational data to assess a hypothesis
have been written about widely and presented in various frameworks over the past several
decades. The counterfactual framework is useful for describing why RCTs are so highly valued in
developing theories of causal inference between exposures and outcomes (Hernán & Robins,
2016; Morgan & Winship, 2015). Specifically, let A denote an exposure to an intervention in the
ICU (A=1 indicates exposure to an intervention and A=0 indicates no exposure to an
intervention). Then, for a binary outcome Y (e.g., death at day 30), we say that the intervention
(A) has a causal effect on Y if Probability(Pr)[Ya=1=1] ≠ Pr[Ya=0=1] and the intervention has no
causal effect on Y (the null hypothesis) if Pr[Ya=1=1] = Pr[Ya=0=1]. Indistinguishable notation would
be applied to any ICU outcome of interest regardless of if it was a continuous (e.g., length of stay
[LOS]), time-to-event (e.g., time-to-resolution of delirium) or count (e.g., days of infection per
1,000 patient days) distribution.
In observational research, there is a concern about known and unknown (or observed
and unobserved) confounders. The theory behind randomization is that if it is executed correctly,
the concern about confounding at baseline is removed. Without randomization prior to exposure,
there is no guarantee that A, representing the intervention, is uncorrelated with the error term, ε
(i.e., A may be endogenous). The result of endogenous correlation is a potentially biased, or
incorrect estimate of the impact of an intervention.
In contrast, the randomized experiment is built upon the concept of exchangeability,
which by design is not susceptible to endogeneity. As a result, execution of an RCT is the closest
a scientist can get to producing an unbiased causal effect estimate. Specifically, the risk of an
event at baseline under the potential treatment value a among the treated is equal to the risk
4
differently, the conditional risk of an outcome is equal in all subsets defined by treatment status in
the population. Therefore, the baseline risk is equal to the marginal risk under treatment value a
in the whole population. In ideal settings the process of randomization or random allocation
should result in counterfactual data that is missing completely at random (MCAR) for each
subject, such that causal effects can be estimated statistically without bias.
In practice, various logistical, patient and post-randomization factors can erode the
assurance of unbiased effect estimates. Indeed, the focus of Chapters 4 and 5 of this dissertation
are on post-randomization factors that can bias randomization inference. Specifically, in Chapter
4 we assess the impact of informative censoring from mortality, and in Chapter 5 we assess
measurement error resulting from within-hospital patient flow and how these post-randomization
processes can bias treatment effect estimates and interpretation.
Experimental evidence for treating critical illness
Efforts at improving critical care outcomes have resulted in a long history of ICU-based
RCTs that have been unable to demonstrate statistically significant improvements in patient
outcomes through new interventions, protocols, therapies and staffing models in the ICU
(Aberegg et al., 2010; Angus et al., 2010; Annane, 2009; Ospina-Tascon et al., 2008). Exceptions
include studies that have shown the benefits of low (rather than high) tidal volumes for patients
receiving mechanical ventilation (ARDSnet Investigators, 2000), of restrictive (rather than
aggressive) blood transfusion practices (Hebert et al., 1999; Villanueva et al., 2013), and of light
sedation that is frequently interrupted (rather than heavy sedation without protocol-driven
interruptions) to maintain comfort among ventilated patients (Girard et al., 2008; Kress et al.,
2000). Unfortunately, the vast majority of critical care RCTs have not demonstrated interventions
that decreased mortality (Aberegg et al., 2010; Landoni et al., 2015; Ospina-Tascon et al., 2008).
5
found an overall success rate of 48.8% (of 221 RCTs) (Latronico et al., 2013). However, in two
reviews of RCTs where mortality was the primary endpoint, success rates were only 14% (10 of
72 RCTs published before August 2006) (Ospina-Tascon et al., 2008) and 18% (7 of 38 RCTs
published from 1999-2009 in 5 major medical journals) (Aberegg et al., 2010), respectively. Given
that these studies all focused on published RCTs, the true rate of positive RCTs is potentially
lower as negative studies, especially industry-sponsored trials, may be less likely to be submitted
for publication or ultimately be accepted for publication. The low rate of successful ICU-based
RCTs has not gone unnoticed; there are some thought leaders who have been so disappointed
by these trends that they have suggested entirely abandoning the concept of RCTs in the ICU
(Dreyfuss, 2004; J.-L. Vincent, 2010). However, it is unclear whether the majority of ICU-based
RCTs were negative because of a true lack of treatment effect or because of the design elements
of the RCTs in which they were tested (J. L. Vincent, 2009). This is especially relevant in studies
of nonmortal clinical endpoints (e.g., LOS in the ICU), where the statistical handling of dropout
(censoring) from death could impact the interpretation of results. Therefore, this dissertation
seeks to expand the empirical solutions available to researchers to help in distinguishing negative
versus misinterpreted trials. To do so, we build on a small and limited empirical foundation.
While there is a range of proposed explanations (see conceptual framework in Table 1.1)
for the low success rates of ICU-based RCTs, empirical research has focused almost exclusively
on explanations related to statistical power in mortality studies. Specifically, researchers have
identified a practice termed delta inflation, wherein unrealistically large predicted treatment effects
are used to estimate a trial’s needed sample size (Aberegg et al., 2010; Latronico et al., 2013).
Conversely, detection of smaller (but possibly more realistic) mortality differences between study
arms requires larger study samples. As a result, studies that are powered based on delta inflation
may be perceived as inconclusive or negative because potentially clinically relevant treatment
effects are not statistically significant. The empirical assessment of delta inflation bias has been
restricted to RCTs of mortality. It is unclear if this practice occurs with other nonmortal primary
6
detect a treatment-associated decline in mortality. It is also unclear if misspecification of other
elements of the power calculation, such as the event rate in the control arm of the study, leads to
underestimated necessary sample sizes. These specific questions are examined in Chapter 2.
This thesis also pursues a specific focus on nonmortal outcomes which are largely
under-scrutinized but increasingly advocated trial endpoints by investigators and trial consortiums
(Mebazaa et al., 2016; Opal et al., 2014; Spragg et al., 2010; Young et al., 2012). Principal to this
endeavor is the identification and subsequent standardization of core outcomes that will be
measured and analyzed identically across future trials to promote less biased comparisons
between different trials and promote harmonized data assemblage in meta-analyses (Blackwood
et al., 2014; Blackwood et al., 2015). This area of research activity is very nascent in critical care,
but has seen much activity in other disciplines through the COMET (Core Outcome Measures in
Effectiveness Trials) Initiative which focuses on the development and application of a
standardized set of outcomes (Prinsen et al., 2014; Williamson & Clarke, 2012). Among the
several goals of this work, the research herein seeks to enhance research in critical care by
considering standardized analytic methods to improve the detection of clinically relevant
treatment effects and facilitate comparisons across ICU populations worldwide.
Dissertation aims
As reviewed above, RCTs among critically ill patients commonly fail to detect their
hypothesized treatment effects, but it is unknown whether these trials have correctly identified the
lack of treatment effect (i.e., true negative) or have committed a type-II error (i.e., false negative)
due to methodologic flaws. Therefore, this dissertation seeks to evaluate the hypotheses outlined
in Table 1.1. The overall objective is twofold: (1) to provide and advance knowledge that will
improve current approaches to designing RCTs in critical care and (2) advance novel
7
RCTs. These two goals are collectively accomplished through a series of three thematically linked
analyses that elucidate some of the potential mechanisms underlying the ongoing challenges that
past trials have encountered in identifying treatment effects.
First, in Chapter 2, we conduct the largest-ever study of the outcomes, design, and
analysis of ICU-based RCTs published in 16 leading journals from 2007-2013. In Chapter 3, we
present the empirical framework for Chapters 4 and 5, which is based on the finding that the
majority of RCTs studies in Chapter 2 were designed to assess a nonmortal primary endpoint.
Therefore, Chapters 4 and 5 focus on issues salient to RCTs with nonmortal endpoints, and use
ICU LOS as a case study. Indeed, LOS is the most frequently used nonmortal outcome across all
published trials (Chapter 2), and both a patient-centered and critical operational outcome. It is
also representative of a broader class of endpoints assessing “durations,” such as the duration of
organ dysfunction, delirium, or ventilation. Accordingly, LOS is an illustrative endpoint to appraise
the empirical and conceptual issues related to the definition, measurement and statistical
comparisons of nonmortal measures between study arms.
First, in Chapter 4, a detailed examination of the epidemiological and statistical issues of
measuring and analyzing ICU LOS in the presence of informative censoring due to mortality is
undertaken. Then, in Chapter 5 we identify and evaluate the importance of a new form of
measurement error termed ‘immutable time bias.’ This bias is defined as immutable because the
extra time contributed to the total LOS could not be altered by the intervention, but rather is driven
by system issues including floor bed availability, capacity strain, or administrative delays. With a
simulation study informed by both the Study to Understand Nighttime Staffing Effectiveness in a
Tertiary Care ICU (SUNSET-ICU) RCT, performed at our institution, and the few other RCTs we
identified that reported the “ready-to-discharge time” over “actual discharge time,” we assess the
identification of treatment effects in LOS under different hypothetical scenarios. We summarize
the results of these three empirical investigations and their relevance for future ICU-based RCTs
8
Table 1.1. Hypotheses to explain low efficacy in critical care randomized clinical trials
Domain
Dissertation chapter assessing an element of this
hypothesis
Hypothesis
Intervention 2 The proposed interventions are not truly effective interventions.
Logistical 2,5
RCTs are sufficiently powered but patient attrition leads to appreciable post-randomization losses so that the intention-to-treat analyses are highly conservative or biased.
Study
population 2,4,5
Treatment-effect heterogeneity may lead to a diluted effect estimate because while interventions work for certain patients, others are too sick and/or have too many competing risks for death for singular
interventions to be of benefit.
Power 2,4,5
RCTs may suffer design issues, such as insufficient power to detect relatively small but important effects in appropriate outcomes (i.e., excessive Type II error rates).
Outcome 2,4,5
Outcome measures are inappropriate, that is, the intervention does not impact the outcome that is measured or the selected outcome is not the ideal way of measuring an effect.
Analysis 2,4,5
9
CHAPTER 2. OUTCOMES AND STATISTICAL POWER IN ADULT CRITICAL CARE
RANDOMIZED TRIALS
This chapter has been published in the American Journal of Respiratory and Critical Care
Medicine, official journal of the American Thoracic Society, and is reprinted here with permission
of the American Thoracic Society. Copyright © 2014 American Thoracic Society. The citation for
this publication is:
10
Introduction
In this chapter we examine the design, analysis and outcomes used in published
ICU-based RCTs. As noted in the introduction, the primary motivation for this analysis is that most
published RCTs of critical care interventions that aim to reduce mortality have produced negative
results (Aberegg et al., 2010; Angus et al., 2010; Annane, 2009; Ospina-Tascon et al., 2008), and
even these reports may be overly optimistic because negative trials are less likely to be published
and identified. While several RCTs have revolutionized critical care practice (ARDSnet
Investigators, 2000; Girard et al., 2008; Guerin et al., 2013), the results of critical care trials on the
whole have been so disappointing that some leaders in the field have suggested a renewed focus
on non-experimental study designs (Dreyfuss, 2004; J.-L. Vincent, 2010).
However, truly negative trials are valuable because they prevent the use of interventions
that are either costly but non-beneficial or even harmful (e.g., intensive insulin therapy (Van den
Berghe et al., 2006) and hydroxyethyl starch (Myburgh et al., 2012; Perner et al., 2012)). Further,
there are many reasons why trials may not demonstrate a treatment effect, including ineffective
interventions, difficulty recruiting adequate sample sizes, post-randomization patient attrition,
heterogeneous patient populations or treatment-effect heterogeneity, use of inappropriate
outcomes, unreasonable assumptions (e.g, predicted effect sizes) used in power calculations
and/or smaller than appreciated attributable morbidity and mortality fractions (Aberegg et al.,
2010; Angus et al., 2010; Annane, 2009; Marini, 2006; McAuley et al., 2010; Ospina-Tascon et
al., 2008; Reade & Angus, 2009; Rubenfeld & Abraham, 2008; van Meurs et al., 2008).
Understanding an evidence base requires the ability to distinguish among these reasons so as to
differentiate trials that are truly negative from those that may be falsely negative.
As a first step in enhancing understanding of clinical trials in adult critical care, we
created a contemporary database of the design, analysis, and reporting of ICU-based RCTs.
Herein, we describe the development of this database, the characteristics of RCTs published in
11
using selected quality metrics, and the extents to which several issues germane to statistical
power may contribute to trials’ outcomes.
Methods
A group of physicians, epidemiologists and statisticians, guided by the 2007 CONSORT
(Hopewell et al., 2008) (Consolidated Standards of Reporting Trials) statement, Jadad scale
(Jadad et al., 1996; Juni et al., 2001), and prior work and commentaries on the topic (Aberegg et
al., 2010; Angus et al., 2010; Annane, 2009; Chiche & Angus, 2008; Marini, 2006; McAuley et al.,
2010; Ospina-Tascon et al., 2008; Reade & Angus, 2009; Rubenfeld & Abraham, 2008; van
Meurs et al., 2008; J.-L. Vincent, 2010) identified RCT elements to be abstracted. We began our
search for published RCTs in January 2007, as this approximated the end of prior review periods
(Aberegg et al., 2010; Ospina-Tascon et al., 2008) through May 2013. We examined only RCTs
of diagnostic, therapeutic, or process and systems interventions among adult patients conducted
in an ICU published in 16 prominent general or critical care journals (Table 2.1).
Table 2.1. Eligible journals and published critical care randomized clinical trials abstracted
Peer-reviewed journal Number of RCTs
Critical Care Medicine 44
Intensive Care Medicine 20
JAMA 17
New England Journal of Medicine 17
American Journal of Respiratory and Critical Care
Medicine
14
The Lancet 10
Chest 7
Anesthesia and Analgesia 4
Anesthesiology 2
Annals of Internal Medicine 2
Archives of (now JAMA-) Internal Medicine 2
British Journal of Anesthesia 2
Canadian Medical Association Journal 2
British Medical Journal 1
Journal of Critical Care 1
12
The MeSH terms “Intensive Care Unit”, “Critical Care”, “Critically Ill”, “Intensive Care”,
“ICU”, “Randomized clinical trial”, and “Randomized controlled trial” were combined with the
unique search names for the targeted journals. Search filters were used to limit our search to
studies of adults that were published in the English language. The search results were screened
for duplicates using RefWorks (ProQuest; Ann Arbor, MI) to create a single list of unique articles
for eligibility screening.
For an RCT to be considered eligible it had to: (i) be published in one of the sixteen
pre-specified journals no earlier than 2007, (ii) take place in one or more ICUs (i.e. not in an
emergency department, post-anesthesia recovery unit, or elsewhere), (iii) include adult patients,
and (iv) specify a primary clinical outcome (Table 2.2).
Table 2.2. A priori selected outcomes
1. ICU mortality
2. In-hospital mortality
3. 28-day mortality
4. 29-180 day mortality
5. 181+ day mortality
6. ICU readmission
7. Hospital discharge disposition
8. Costs/ Charges
9. ICU length of stay
10. Hospital length of stay
11. Ventilator-free days
12. Duration of mechanical ventilation
13. Organ failure-free days
14. Patient, family, physician, nurse, or other provider satisfaction
15. Complications/ adverse outcomes
16. Healthcare associated infections
17. Quality of life
18. Survival
19. Incidence of acute organ failure
20. Delirium
13
We excluded intermediate and physiologic outcomes because our goal was to identify
trials testing interventions that were sufficiently mature as to be applied clinically as opposed to
those that were primarily hypothesis generating. Physiological and psychological test scores were
not considered to be clinical outcomes and hence were not abstracted. Intermediate and
physiologic outcomes were excluded because our goal was to identify trials testing interventions
that were sufficiently mature as to be applied clinically as opposed to those that were primarily
hypothesis generating.
Data abstraction
Using the Research Electronic Data Capture (REDCap) platform hosted at the University
of Pennsylvania (Harris et al., 2009), two investigators independently abstracted the primary and
secondary outcomes, as reported by the authors in each trial, and the result (positive or negative)
for each RCT. We relied on the data as reported by the original authors in their publication for
each study during abstraction. Three investigators (RB, AG, SG) served as primary data
abstractors, with two of them initially screening each article identified by the electronic search for
initial eligibility. To validate this screening process and as an internal quality measure, four other
investigators (MOH, JW, EC, and SDH) screened four of the sixteen selected journals over the
full duration of the inclusion period (n=951 journal issues). This screening identified 24 RCTs, of
which 18 were eligible per inclusion criteria. The 3 primary data abstractors achieved perfect
agreement, identifying all 24 of these RCTs and correctly excluding the 6 ineligible trials.
A superiority study was considered positive if the p-value for the analysis of the primary
outcome was less than 0.05, or the adjusted significance level after interim analyses, based on
the reporting in each RCT. An equivalence or non-inferiority study was considered positive if the
difference between study arms fell between the pre-determined margins (confidence intervals)
and met the equivalence or non-inferiority hypothesis at the p-value declared by the study’s
authors. When a study had more than two arms, outcomes were recorded from the control arm
14
study funding, type of intervention tested, target patient population, enrollment and retention, and
statistical power.
To assess statistical power, we abstracted three specific methodological elements: (1)
discussion of the power calculation used for the trial, (2) rationales for the parameters used in the
sample size or power estimation, and (3) participant accrual. Discussion of the power calculation
was defined as reporting the inputs used to calculate power or sample size, such as the baseline
(control group) event rate and the expected treatment effect size for binary endpoints. The
rationales for sample size or power estimation inputs could include prior research results, pilot
studies, or other objective data. Participant accrual was tracked by assessing CONSORT
diagrams, when available, indicating the number of patients screened, randomized and ultimately
analyzed (Hopewell et al., 2008).
The data abstractors achieved greater than 90% agreement for individual data elements,
including primary and secondary outcomes, funding, target sample size, and reason(s) for study
exclusion. The first author adjudicated the discrepancies that arose. STATA 13 (StataCorp,
College Station, Texas) was used for database management and analysis.
Analyses to assess statistical power
For each RCT with a binary outcome, we abstracted the predicted and observed risk
difference on the absolute scale. We used the absolute, rather than relative, risk difference
because absolute differences are used to determine the clinical significance of effects (Sackett et
al., 1997). For example, to calculate the number needed to treat, the absolute risk reduction is
required. For negative trials, we evaluated whether (non-significant) reductions in the primary
outcome of 3% or greater were identified. Our choice of a 3% cutoff is somewhat arbitrary, but
was chosen a priori based on the view that any treatment-associated absolute effect of this size
would clearly be important to patients, and that effects less than 3%, albeit potentially important,
15
to trials that reported power calculations, so as to enable uniform determinations of whether or
not these RCTs were powered to document these effect sizes as significant.
We also explored the related phenomenon of “delta inflation bias” (Aberegg et al., 2010;
Latronico et al., 2013), whereby unrealistically large treatment effects are predicted in power
calculations, resulting in target sample sizes that may fail to detect clinically important differences.
To estimate the necessary sample size for a trial there are two essential components, the rate of
the outcome in the control arm and the expected difference, termed the minimally clinically
important difference (MCID). The MCID is also known as the predicted treatment effect, effect
size or delta ( ). The MCID characterizes the smallest change in the primary outcome that is felt
to be meaningful to both the clinician and patient. The MCID is the most variable and important
component of sample size calculations, even when the outcome upon which the trial is powered
is the same across studies. To properly design a RCT that can adequately answer the primary
study question, it is necessary to establish the magnitude of the difference in the primary end
point that will signify a clinically relevant treatment effect. Detection of a smaller difference
between study groups requires larger sample sizes. Detection of a larger difference between
study groups requires smaller sample sizes. This mathematical tension is the speculated
motivation for researchers to select a larger threshold that consequently decreases the sample
size requirements. This is delta inflation (Aberegg et al., 2010). The corollary of this practice is the
increased likelihood of type II error (not detecting a true effect).
To understand how delta inflation works we can see below that if we seek to determine
the targeted sample size (n) using significance level 𝛼, (typically 0.05) and want to have power
1 − 𝛽(typically 0.80) when we an assumed value for 𝑃1 (baseline mortality) & unknown value for
(mortality in the treated arm), a speculated mortality decline must be presumed. This decline
creates that delta, that is, ∆ = 𝑃1− 𝑃2. These components permit the calculation of a targeted
sample size based on that delta using the following equation that can be calculated in most
D
2
16
statistical packages: If a researcher knows that a
certain sample size range will be available the delta can be manipulated to attain an acceptable
power (e.g, 0.80). This can be seen in an alternative configuration of the above equation that can
be used to solve for a certain power. For instance, if we must use specific sample sizes & ,
the assumed values for 𝑃1 & 𝑃2, and hence ∆ = 𝑃1− 𝑃2 , can be changed and then the power we
achieve is given by: where
.
Using the actual enrolled sample sizes in the control and treatment arms, and the
observed baseline mortality rate, we calculated the power of each study to observe a clinically
significant, treatment-associated mortality reductionfrom of 3% to 15%. The number of trials with
80% power was tallied for each treatment-associated mortality reductionof 3% to 15%. We then
re-did each calculation using the predicted baseline mortality from the published RCT.
Comparison of power obtained using the observed and predicted rates therefore highlights how
often mis-predictions of baseline event rates influence power. Similar analyses were undertaken
using all RCTs with binary nonmortal primary outcomes.
Statistical analyses
We conducted unadjusted comparisons of proportions using x2 tests to examine the
differences in proportions of successful trials across trial characteristics. We used multivariable
regression to identify study-level characteristics associated with a trial’s being positive. For this
purpose, given limited degrees of freedom, we limited our assessments to the following trial
characteristics: (1) mortal vs. nonmortal primary outcome, (2) funding source (3) single vs. 2-10
centers vs. > 10 centers and (4) type of intervention. Odds ratios (ORs) from a logistic regression n1=
pq 1+1
k
æ è ç öø÷z
1-a2+ p1q1+ p2q2
k z1-b é ë ê ê ù û ú ú 2 D2 1
n
n
217
and prevalence rate ratios (PRR) from a Poisson regression with a robust variance estimator are
presented since the ORs will overestimate relative risks with event (positive trial) rates >10%
(Deddens & Petersen, 2008).
Results
Our search identified 376 potential studies published between January 2007 and May
2013 (Figure 2.1). Of these, 146 met the pre-specified inclusion criteria. The most commonly
tested types of interventions were protocols (49%) and drug therapies (40%) (Table 2.3). Most
trials (92%) compared two intervention arms (max=5). Overall, 54 (37%) were positive, that is,
these RCTs demonstrated a significant difference between study groups in the primary outcome
as hypothesized (Table 2.3). In addition to the 21(14%) RCTs stopped early for safety or futility
an additional 4 RCTs (3%) revealed statistically significant findings of inferiority (i.e.,
effects contrary to the primary hypothesis).
The most common primary outcomes were measures of mortality over a specified time
period (27%), followed by outcomes related to healthcare associated infections (23%), ventilation
(21%) (e.g., time to extubation, ventilator-free days or required mechanical ventilation), and
quality (10%) (e.g., complications or adverse events). The incidence of positive trials varied
depending on the primary outcome. The success rates for trials using these four
above-mentioned outcomes were 10%, 58%, 43% and 50%, respectively. Two of the four positive
mortality trials were only significant after pre-specified adjustment (Jansen et al., 2010; Papazian
et al., 2010); thus, only 5% of these trials showed statistically significant differences in crude
mortality rates. Twenty-four of the 40 trials where mortality was the primary outcome studied 28-
or 30-day mortality. Five additional RCTs included a mortality endpoint as part of a composite
primary outcome with nonmortal measures and one RCT was powered on mortality despite being
18
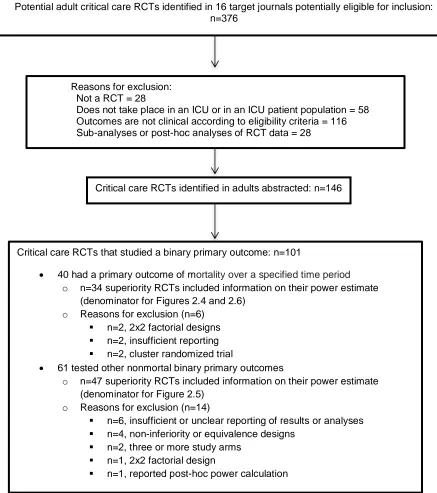
Figure 2.1. Analytic sample of published randomized clinical trials of critical care interventions
Potential adult critical care RCTs identified in 16 target journals potentially eligible for inclusion: n=376
Critical care RCTs identified in adults abstracted: n=146
Critical care RCTs that studied a binary primary outcome: n=101
40 had a primary outcome of mortality over a specified time period
o n=34 superiority RCTs included information on their power estimate (denominator for Figures 2.4 and 2.6)
o Reasons for exclusion (n=6)
n=2, 2x2 factorial designs
n=2, insufficient reporting
n=2, cluster randomized trial
61 tested other nonmortal binary primary outcomes
o n=47 superiority RCTs included information on their power estimate (denominator for Figure 2.5)
o Reasons for exclusion (n=14)
n=6, insufficient or unclear reporting of results or analyses
n=4, non-inferiority or equivalence designs
n=2, three or more study arms
n=1, 2x2 factorial design
n=1, reported post-hoc power calculation Reasons for exclusion:
Not a RCT = 28
19
Table 2.3. Characteristics of adult randomized clinical trials in critical care
Characteristic N (%) N (%) with a positive
primary outcome
Total 146 (100%) 54 (37%)
Funding
No industry 80 (55%) 26 (33%)
Some industry 42 (29%) 13 (31%)
No funding / not reported 24 (16%) 15 (63%)
Single center 54 (37%) 25 (46%)
Multicenter 92 (63%) 29 (32%)
10 or fewer ICUs 40 (27%) 18 (45%)
11-25 ICUs 25 (17%) 6 (24%)
>25 ICUs 27 (18%) 5 (19%)
Type of intervention studied
Protocol 71 (49%) 30 (42%)
Drug 59 (40%) 18 (31%)
Device/ monitoring 5 (3%) 1 (20%)
Other 11 (8%) 5 (45%)
Primary target patient populations
General ICU 52 (36%) 30 (58%)
Sepsis spectrum 22 (15%) 0
Cardiac critical care 17 (12%) 7 (41%)
Acute lung injury/ ARDS 16 (11%) 2 (13%)
Unit of randomization
Patient, surrogate, or family 137 (94%) 49 (36%)
ICU (cluster randomization) 9 (6%) 5 (56%)
Primary outcome (1 per trial, n=146 CCRCTs)
Mortality (e.g., Hospital, ICU, 28-day)* 40 (27%) 4 (10%)
Infection related 33 (23%) 19 (58%)
Ventilation related 30 (21%) 13 (43%)
Quality (complications/adverse outcomes) 14 (10%) 7 (50%)
Organ failure 8 (5%) 1 (13%)
Composite outcome 7 (5%) 2 (29%)
Delirium 5 (3%) 2 (40%)
Hospital Discharge disposition (functional status) 3 (2%) 1 (33%)
Length of Stay 3 (2%) 2 (67%)
Smoking cessation 2 (1%) 2 (100%)
Quality of sleep 1 (1%) 1 (100%)
Most frequent secondary outcomes (multiple possible per RCT)
Mortality
ICU Mortality 47 (32%) 4 (9%)
In-hospital mortality 44 (30%) 2 (5%)
28 day 29 (20%) 4 (14%)
29-180 days 35 (24%) 5 (14%)
Ventilation
Duration of MV 55 (38%) 12 (22%)
Ventilator free days 22 (15%) 6 (27%)
Length of Stay
ICU length of stay 93 (64%) 12 (13%)
Hospital length of stay 71 (49%) 5 (7%)
Quality (Complications/adverse outcomes) 60 (41%) 14 (23%)
Infection related 36 (25%) 8 (22%)
20
The most common secondary outcomes across all RCTs were ICU (64%) and hospital
(49%) length of stay (Table 2.3).
Of the 122 (84%) trials that disclosed the funding source, 34% reported receipt of
industry funding, and 66% reported no industry funding. There was no relationship between
industry funding and the probability that a trial would be positive (33% vs. 31%, p = 0.9). The
remaining 24 trials did not disclose any sources of funding, and these were more likely to be
positive (63%, p = 0.005 for comparison with all studies reporting funding sources). Single center
RCTs (n=54) were less common than multi-center RCTs (n=92). However, multi-center RCTs
were less likely to be positive and the rate decreased as the number of participating ICUs
increased (p=0.03) in univariate analyses. In the multivariable regressions, RCTs that did not
report any funding source (OR=3.3, 95% CI: 1.2-9.4) and RCTs that did not study a primary
mortality outcome (OR=6.8, 95% CI: 2.1-22.7) were significantly more likely to be successful
(Figure 2.2).
Figure 2.2. Adjusted associations of selected RCT characteristics with positive primary outcomes
21
Power or sample size were discussed in 135 RCTs (92%), however, only 68% of these
studies cited prior research, a pilot study, or examination of other data (e.g., from the authors’
center) to justify the inputs used in calculating the required sample size (Table 2.4). A CONSORT
diagram portraying participant flow was reported in 119 RCTs (82%).
Table 2.4. Power and sample size characteristics of randomized clinical trials in critical care
Characteristic Number of RCTs n (%)
positive
Total 146
Included a consort diagram (patient flow) 119 (82%)
Rationale for power parameters (e.g., baseline rate,
predicted delta, expected time to event) 92 (63%)
Type of outcome
Binary outcome 101 (69%) 31 (31%)
Duration: (e.g., event free-days) or time-to-event
outcome
35 (24%) 16 (46%)
Rate (e.g., per 1,000 patient days) 7 (5%) 6 (86%)
Continuous 3 (2%) 1 (33%)
RCT stopped early 32 (22%)
Futility 12 (8%)
Safety 9 (6%)
Recruitment / logistical issues 11 (8%)
Power or sample size plan discussed, including cluster
trials
135 (92%)
RCT reported a targeted a priori sample size 130/135 (96%)
Recruited < 95% of target or stopped early due to
recruitment / logistical issues
20/130 (15%) 4/20 (20%)
Recruited 95-110% of target sample size or stopped
early for futility 88/130 (68%) 36/88 (41%)
Recruited > 110% of target sample size 13/130 (10%) 4/13 (31%)
22
A total of 101 (69%) RCTs used a binary primary outcome. Of these, 40 examined a
mortality outcome and 61 used other nonmortal outcomes (e.g., incidence of VAP). Twenty-three
of the 40 RCTs with mortality as a primary outcome explained the rationale for their predicted
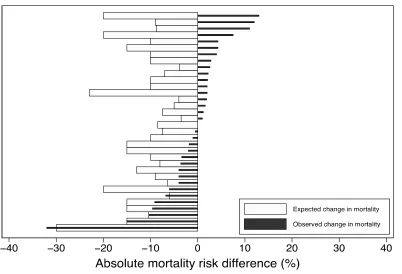
treatment-associated mortality reduction. Thirty-four of these 40 RCTs reported the values for
their power calculation and specified that they were superiority trials (i.e., powered for a specific
treatment-associated mortality reduction). Of these 34 mortality endpoint superiority trials, three
were positive (two only after pre-specified adjustment), and 11 (33%) had non-significant absolute
treatment effects in the hypothesized direction that were larger than 3% (Figure 2.3).
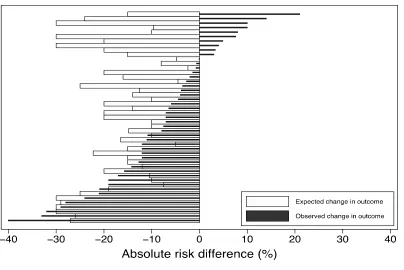
Of the 61 RCTs with a primary nonmortal binary outcome, 47 were two-arm superiority
trials and reported the predicted treatment-associated reduction they used for their power
calculation (Figure 2.1). Of these 47 RCTs, 20 were positive and 27 were statistically non-
23
Figure 2.4. Expected versus actual treatment effect in 47 superiority trials with a binary non-mortal primary outcome
significant, of which 12 (44.4%) observed absolute treatment effects in the hypothesized direction
that were larger than 3% (Figure 2.4).
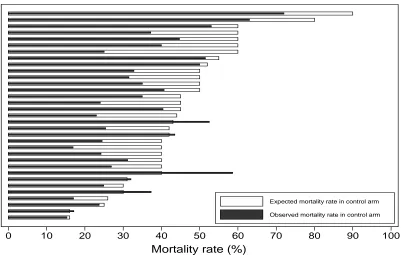
Among the 33 superiority trials without adaptive control arms reporting expected control
group mortality rates, the actual control group mortality differed from the expected value by 7.5%
or more in 22 RCTs (Figure 2.5). Despite these frequent differences between expected and
observed control group mortality rates, this rarely accounted for a study's inability to detect a
given effect size as significant. For example, 12 (out of 30) negative mortality trials that tested for
superiority could have detected a 10% mortality reduction with the observed control group
mortality rate, compared with 13 such trials if the expected control group mortality had been
observed (Figure 2.6). Among the 46 (of 47) nonmortal superiority trials with a binary endpoint in
which expected control group rates were reported in the manuscripts, the actual control group
24
Figure 2.5. Expected and observed rate of mortality in control arms in RCTs that tested the effect of an intervention on mortality
Figure 2.6. Simulation results of superiority trials where the primary outcome was mortality assuming 80% power to find a treatment-associated mortality reduction of 3 to 15%
0 10 20 30 40 50 60 70 80 90 100
Mortality rate (%)
25
results for mortality trials, misspecification of control group rates rarely accounted for a study's
inability to detect a given effect size as significant.
Discussion
This contemporary study of 146 RCTs published in the leading medical and critical care
journals yields several important findings. First, investigators choose a variety of primary
outcomes for trials of ICU-based interventions. Some of this heterogeneity is appropriate given
different anticipated effects of various interventions. However, the variation of endpoints selected
even among trials using some form of a mortality primary endpoint suggests little agreement on
the optimal outcomes in critical care. These data complement a prior study showing variability in
ventilation-associated outcomes in critical care RCTs (Blackwood et al., 2014). This lack of
standardized definitions and methods for assessing common outcomes poses challenges for
comparing and understanding differences between RCTs, replicating results, and conducting
meta-analyses.
Second, a majority of RCTs are “negative” in the sense that they do not demonstrate a
benefit from the tested intervention. This is particularly true when mortality is the primary outcome
(10% positive rate, or 5% if only crude rates are considered), with higher proportions of positive
trials when other outcomes are used (13-100% positive rate) (Table 2.3). Of note, a 5-10%
positive rate is roughly the rate that would be expected assuming a conventional type I error rate
of 0.05. A prior review of RCTs in both adults and children published in the journal Intensive Care
Medicine from 2000-2010 found an overall success rate of 48.8% (of 221 RCTs) (Latronico et al.,
2013), somewhat higher than our observed rate of 37% (of 146 RCTs). Additionally, two reviews
that focused on RCTs using mortality endpoints found success rates of 14% (10 of 72 RCTs
published before August 2006) (Ospina-Tascon et al., 2008) and 18% (7 of 38 RCTs published
26
rate of 10%. Although it is possible that more trials are becoming negative over time, these
differences may also be attributable to variability in the journals sampled and the eligibility criteria
used to include RCTs. Because our study and all prior studies focused on published RCTs, the
true rates of successful trials are likely even lower.
The high rate of negative trials does not, itself, suggest a problem; a majority of trials may
“appropriately” fail to detect significant reductions in mortality. Such “true negatives” could arise if
more interventions being tested are truly ineffective, as may occur when a discipline matures.
Alternatively, such findings may be attributable to the fact that mortality in the ICU is heavily
determined by physicians’ decisions to withhold or withdraw life support (Garland & Connors,
2007), crowding out any plausible effect of an intervention. Finally, 10% or 20% of trials should be
negative by chance alone even when power is set to 90% or 80%, respectively.
Nonetheless, the present study suggests that in many cases, critical care RCTs, and
especially those studying mortal endpoints, have not been designed to identify realistic treatment
effects. For example, we find that in a majority of negative RCTs, the results move in the
predicted direction, often considerably so, yet fail to attain the predicted treatment effect upon
which the study was powered (Figures 2.3 and 2.4). This provides contemporary evidence in
support of the notion that investigators commonly select implausibly large treatment effects upon
which to base sample size requirements (Aberegg et al., 2010). Although the problem of
underpowered trials is certainly not unique to critical care, it does raise ethical concerns because
such trials expose research participants to the risks and burdens of research without being
(sufficiently) able to deliver on the purported benefits of expanding knowledge and improving
future care (S. D. Halpern et al., 2002; Luce et al., 2004).
A third and related finding is that investigators commonly err in predicting the baseline
event rate in their trials. With high-predicted background rates, large absolute risk reductions
might seem plausible to investigators because they would reflect more modest relative risk
27
considerably lower than predicted, which could make such large effects improbable. For instance,
it may be unreasonable to assume that an intervention predicted to bring mortality down to 30%,
assuming a base rate of 40%, would also reduce mortality to 10% if the base rate turned out to be
20%. Thus, as the baseline mortality rate declines, there will invariably be diminishing marginal
returns for any intervention – i.e., a lower proportion of potentially save-able patients.
Despite the possibility that over-predictions of control group event rates would contribute
to critical care RCTs being negative, this appears to be only a minor piece of the problem. We
found that even when large errors were made in predicted baseline mortality, this rarely changed
whether a trial would or would not have detected a given difference as significant. This may be
attributable to a counterbalancing phenomenon whereby as the baseline rate moves away from
50%, the sample size required to detect any given difference on an absolute scale decreases.
Studies of secular declines in mortality rates for common pathologies, such as done with
multicenter RCTs in sepsis (Stevenson et al., 2014) and acute lung injury (Spragg et al., 2010),
could better inform control group mortality rates, and also guide selection of more reasonable
treatment effects when designing future RCTs. Further, event-driven adaptive trial designs, such
as utilized in the PROWESS-SHOCK trial (Ranieri et al., 2012), that adjust (by increasing sample
size) to lower than expected mortality in the control group offer an attractive solution to this issue.
Additional strategies for improving trial success might include use of pre-specified
covariate adjustment (Hernandez et al., 2004; Roozenbeek et al., 2010; Roozenbeek et al., 2009)
[e.g., see Jansen and colleagues (Jansen et al., 2010)], larger target sample sizes, and more
realistic and conservative treatment effect expectations (Scales & Rubenfeld, 2005) (Table 2.5).
Additionally, innovative trial designs, such as Bayesian adaptive trials, may be particularly
valuable for assessing drug therapies (Angus & van der Poll, 2013; Spragg et al., 2010).
Regarding endpoints, some have questioned the conceptual propriety of using mortality as an
endpoint for research or quality assessment on seriously or critically ill patients (Holloway & Quill,
28
critically ill patients, others have called for greater use of nonmortal clinical endpoints (Ferguson
et al., 2013; Spragg et al., 2010). Unfortunately, nonmortal endpoints face several threats to
validity including, but not limited to, ascertainment bias (measurement error) and the limits of
commonly used statistical methods for addressing the competing risks and informative dropout
attributable to high ICU mortality rates. Indeed, our observation that RCTs of nonmortal endpoints
were more likely to be positive may be an artifact of these measurement and analysis problems.
Ongoing methodological work designed to offer new critical care outcome measures that
incorporate mortality into the assessment of ICU length of stay or post-ICU quality of life may
ultimately offer optimal approaches for quantifying the effects of interventions in the ICU.
This study has limitations. First, we only calculated power and detectable differences for
trials using binary endpoints. We considered methods to assess effect sizes of trials employing
continuous or time-to-event outcome such as ventilator-free days or time to extubation. However,
potential effect size cutpoints (i.e., Cohen’s d, Glass’s Δ or Hedges’s g), are all based on
assumptions of normally distributed data. Because we found these assumptions unrealistic for
most critical care outcomes, and the inputs difficult, if not impossible to back calculate from the
published findings, we limited our power assessments to trials using binary outcomes. Second,
our review was limited to adult critical care RCTs published in 16 selected journals. Third, since
we relied on published data (and online supplements when available), changes in journal
requirements over time may have contributed to certain reporting omissions (e.g., funding
information or CONSORT diagrams). Fourth, important design issues such as allocation
concealment, blinding or masking and ascertainment bias were not assessed. Finally, while we
implemented an exhaustive search with oversight from a medical librarian, it is conceivable that
our search strategy did not identify all eligible trials.
In summary, we believe greater dialogue is needed to determine the utility of nonmortal
outcomes to patients, providers, and payers, and to identify elements of trial design and analysis
29
al., 2010). Rather than abandoning RCTs, the results suggest opportunities for designing critical
care trials more efficiently. Actionable first steps might include consensus building among the
critical care community (including journal editors) regarding a minimum core outcome set
(Blackwood et al., 2014; Young et al., 2012), methodological work to improve strategies for
measuring these outcomes, and closer scrutiny of submitted manuscripts to ensure an “honest”
power calculation, which should in turn encourage more realistic trial design.
In the subsequent chapters we examine some of these considerations by focusing on
30
Table 2.5. Selected recommendations for critical care trial design
Domain Hypothesis Recommendations to potentially improve design
Study population
Treatment-effect
heterogeneity might lead to a diluted effect estimate because while
interventions work for certain patients, others are too sick and/or have too many competing risks for death for singular interventions to be of benefit.
Stratified randomization.
Pre-specified severity of illness adjustment when estimating treatment effects (Hernandez et al., 2004).
Stratification of trial results based on severity of illness at baseline (Kent et al., 2008; Kent & Hayward, 2007).
Adaptive trial designs (e.g., using biomarkers to stratify patients into more homogeneous subgroups (Angus & van der Poll, 2013), event-driven adaptive trials (Ranieri et al., 2012), or starting trials with several arms and then adjusting sample sizes (Friede & Kieser, 2006) or narrowing arms based on observed interim safety and efficacy data (Lewis et al., 2013)).
Participant accrual and retention
RCTs are sufficiently powered but patient attrition leads to appreciable post-randomization losses so that the intention-to-treat analyses are highly conservative.
Incorporation of patient attrition estimates when making sample size calculations.
Improved models of informed consent (Scales, 2013) and potentially incentives for research participation (S. D. Halpern, 2011a).
Statistical power calculations
Even when the target sample size is achieved and retained, RCTs may be insufficiently powered to detect relatively small but important effects on appropriate outcomes.
Increased meta-studies to better inform control arm event rates (e.g., (Stevenson et al., 2014)).
Use of more realistic and conservative predicted treatment effects when estimating sample sizes.
Use of continuous outcomes when possible.
Reconstruction of binary endpoints into categorical endpoints to improve statistical efficiency (McHugh et al., 2010; Roozenbeek et al., 2010).
Outcome
Outcome measures are inappropriately specified or analyzed.
Consensus development among trial groups and intensivists about follow-up periods and definitions of outcomes for specific conditions to support comparisons across trials (e.g., meta-analysis) (Blackwood et al., 2014; Young et al., 2012).
Novel methods for handling right-censoring due to deaths in analyses of quality of life and other nonmortal outcomes (Rosenbaum, 2006).