University of Pennsylvania
ScholarlyCommons
Publicly Accessible Penn Dissertations
1-1-2013
The Effect of Specialty Tier Placement on
Enrollment and Utilization in Medicare Part D
Erin Audrey Taylor
University of Pennsylvania, ertaylor@wharton.upenn.edu
Follow this and additional works at:
http://repository.upenn.edu/edissertations
Part of the
Economics Commons
, and the
Health and Medical Administration Commons
This paper is posted at ScholarlyCommons.http://repository.upenn.edu/edissertations/807
For more information, please contactlibraryrepository@pobox.upenn.edu.
Recommended Citation
Taylor, Erin Audrey, "The Effect of Specialty Tier Placement on Enrollment and Utilization in Medicare Part D" (2013).Publicly Accessible Penn Dissertations. 807.
The Effect of Specialty Tier Placement on Enrollment and Utilization in
Medicare Part D
Abstract
Health insurance design has distinct and well-documented effects on choice of insurance plan and health care utilization and expenditures. The question of how to design benefits for newer technologies such as specialty drugs presents new challenges in balancing adverse selection and moral hazard concerns with beneficiary coverage. The Medicare Prescription Drug Benefit Program adds complexity via additional governmental regulation of the market and coverage design for specialty drugs. This dissertation presents a conceptual model of the supply-side tier placement decision on the part of Part D plans, and uses Part D formulary and claims data to estimate the demand-side response by Medicare beneficiaries. An instrumental variables approach is employed to address the endogeneity present in the specialty tier placement (supply-side) and enrollment, utilization, and spending (demand-side) decisions. Results are mixed when applying the
instrumental variable, showing that a $100 increase in the out-of-pocket costs imposed on beneficiaries results in a significant increase in the likelihood of utilization for those beneficiaries with rheumatoid arthritis or multiple sclerosis, but a significant reduction of 16.2% (2007) and 35.1% (2008) for beneficiaries diagnosed with one of four types of cancer. Results suggest that beneficiaries do respond to higher cost sharing, raising questions about the imposition of higher cost sharing amounts for such expensive drugs.
Degree Type
Dissertation
Degree Name
Doctor of Philosophy (PhD)
Graduate Group
Healthcare Systems
First Advisor
Patricia M. Danzon
Keywords
Insurance, Medicare, Part D, Pharmaceuticals, Specialty drugs
Subject Categories
Economics | Health and Medical Administration
THE EFFECT OF SPECIALTY TIER PLACEMENT ON ENROLLMENT AND UTILIZATION IN MEDICARE PART D
Erin Audrey Taylor A DISSERTATION
in
Health Care Management and Economics
For the Graduate Group in Managerial Science and Applied Economics Presented to the Faculties of the University of Pennsylvania
in
Partial Fulfillment of the Requirements for the Degree of Doctor of Philosophy
2013
Supervisor of Dissertation
Signature ______________________________
Patricia M. Danzon, Professor of Health Care Management
Graduate Group Chairperson
Signature ______________________________
Eric Bradlow, Professor of Marketing, Statistics, and Education
Dissertation Committee
Patricia M. Danzon, Professor of Health Care Management
Mark V. Pauly, Professor of Health Care Management & Business Economics and Public Policy
THE EFFECT OF SPECIALTY TIER PLACEMENT ON ENROLLMENT AND UTILIZATION IN MEDICARE PART D
COPYRIGHT 2013
ACKNOWLEDGMENT
I could not have completed this dissertation without the help and support of a number of people. My advisor and chair, Patricia Danzon, provided me with the tools and training necessary to complete this project. With her help I grew to understand the importance of teasing out the minute aspects of the data, and also how to draw
overarching conclusions from them. My committee also provided tremendous help. Jalpa Doshi gave me access to the data for the dissertation, and helped me navigate the difficult path to preparing the data for analysis. Mark V. Pauly and Jonathan Kolstad reviewed a number of drafts and helped me ensure that my economic reasoning was sound. I am grateful to all of them for their help in my development as a researcher.
This dissertation also benefitted greatly from the support of current students and alumni of the Health Care Management Department. I am especially grateful to Andrea Puig, Victoria Perez, and Andrew Mulcahy, who provided feedback and moral support as I worked to complete the dissertation.
Finally, I would not be where I am today without my family, including my parents, Dee and Paul Taylor, and my brother and sister-in-law Jeff and Stef Taylor. I am very grateful for their ongoing support. My husband, Fernando Hoces de la Guardia, not only devoted hours to training me in Stata and helping me to understand the data, but also provided constant support through all of the ups and downs associated with the dissertation. I would not have been able to complete the dissertation without him.
ABSTRACT
THE EFFECT OF SPECIALTY TIER PLACEMENT ON ENROLLMENT AND UTILIZATION IN MEDICARE PART D
Erin Audrey Taylor Patricia M. Danzon
TABLE OF CONTENTS
ACKNOWLEDGMENT ... iii
ABSTRACT ... iv
LIST OF TABLES ... vii
LIST OF FIGURES ... ix
CHAPTER 1: INTRODUCTION ... 1
1.1 Health Insurance Design ... 1
1.2 Specialty Drugs ... 2
1.3 The Effect of Tiered Formularies ... 3
1.4 The Impact of Specialty Drugs on Insurance Coverage ... 5
1.5 Literature Review ... 6
1.6 Hypotheses ...16
1.7 Outline ...21
CHAPTER 2: BACKGROUND ...22
2.1 The Medicare Program ...22
2.2 Benefit Design ...23
2.3 Formulary Design ...25
2.4 The Specialty Tier Option ...27
2.5 Utilization Management Tools ...28
2.6 Actuarial Equivalence ...29
2.7 Risk Sharing ...31
2.8 Low Income Subsidy ...34
2.9 The Interaction Between Parts B and D ...35
2.10 Conclusions ...36
CHAPTER 3: CONCEPTUAL MODEL...39
3.1 Introduction ...39
3.2 The Competitive Nature of Part D ...40
3.3 The Profit Model ...41
3.4 Hypotheses ...47
CHAPTER 4: PART D PLAN MARKET SHARES ...50
4.1 Introduction ...50
4.2 Data Sources ...51
4.3 Empirical Approach ...53
4.4 Descriptive Statistics ...55
4.5 Results ...61
4.6 Conclusions ...64
CHAPTER 5: MEDICARE BENEFICIARY CLAIMS DATA ...66
5.1 Introduction ...66
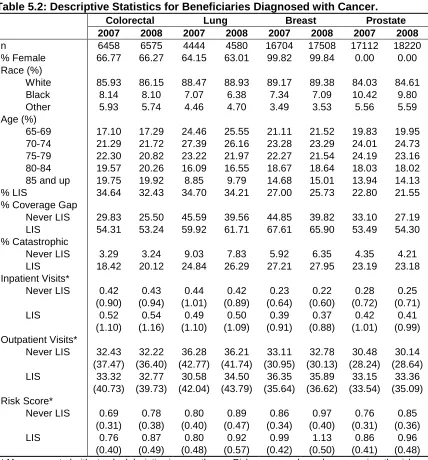
5.2 Conditions of Interest ...66
5.3 Data Sources and Sample Selection ...68
5.4 Variable Definitions ...75
5.5 Data Limitations ...83
CHAPTER 6: BENEFICIARY UTILIZATION AND SWITCHING...87
6.1 Introduction ...87
6.2 Empirical Approach ...89
6.3 Addressing the Endogeneity Problem ...94
6.4 Descriptive Statistics ...95
6.5 Results ...98
6.6 Testing the Instrumental Variable ... 107
6.7 Substitution Effects ... 107
6.8 Sensitivity Analyses ... 111
6.9 Conclusions ... 114
CHAPTER 7: BENEFICIARY AND PLAN EXPENDITURES ... 117
7.1 Introduction ... 117
7.2 Empirical Approach ... 117
7.3 Descriptive Statistics for Expenditures ... 119
7.4 Results ... 124
7.5 Testing the Instrumental Variable ... 130
7.6 Sensitivity Analyses ... 130
7.7 Conclusions ... 132
CHAPTER 8: CONCLUSIONS ... 134
APPENDIX ... 140
LIST OF TABLES
Table 2.1: Part D Standard Benefit Design Thresholds, 2006-2010 ... 25
Table 4.1: Plan-Level Data Descriptive Statistics ... 56
Table 4.2: Average Market Share for Part D Plans, 2007-2010 ... 57
Table 4.3: Plan Specialty Tier Placement and Utilization Management Tools ... 58
Table 4.4: Descriptive Statistics for Part D Plan Cost Sharing for Plans with a Specialty Tier Compared to Plans with No Specialty Tier ... 59
Table 4.5: Part D Region-Level Descriptive Statistics ... 60
Table 4.6: Cross-sectional OLS Results for Plan-Level Market Share ... 62
Table 4.7: Market Share Regression Results, Lagged Independent Variables ... 64
Table 5.1: Descriptive Statistics for Beneficiaries Diagnosed with RA or MS ... 70
Table 5.2: Descriptive Statistics for Beneficiaries Diagnosed with Cancer ... 72
Table 5.3: Descriptive Statistics for Part D Plans Included in the Sample ... 73
Table 5.4: Drug-Level Descriptive Statistics for Plans Included in the Sample, Comparing Specialty Tier Plans with Non-Specialty Tier Plans ... 74
Table 5.5: Number of NDCs Eligible for the Specialty Tier, By Condition ... 79
Table 5.6: Percent of Eligible Drugs Placed on the Specialty Tier, for Plans with at Least One Drug Placed on Specialty Tier ... 80
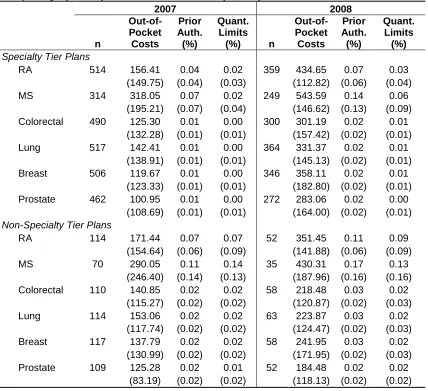
Table 5.7: Average Out-of-Pocket Costs for Specialty Tier-Eligible Drugs, for Plans with Utilization of These Drugs ... 82
Table 5.8: Beneficiaries with Missing Out-of-Pocket Costs at the Plan Level ... 85
Table 6.1: Descriptive Statistics for Beneficiary Utilization and Plan Switching ... 97
Table 6.2: Logistic Regression Results for Any Utilization by Non-LIS Beneficiaries ... 99
Table 6.3: Instrumental Variables Results for Any Utilization by Non-LIS Beneficiaries ... 100
Table 6.4: Poisson Regression Results for Number of Fills by Non-LIS Beneficiaries . 102 Table 6.5: Instrumental Variable Results for Number of Fills by Non-LIS Beneficiaries ... 103
Table 6.6: Bootstrapped Confidence Intervals for the Instrumental Variable Estimation of Number of Fills, for Non-LIS Beneficiaries ... 104
Table 6.7: Logistic Regression Results for Switching Plans, Non-LIS Beneficiaries .... 105
Table 6.8: Instrumental Variables Results for Switching, Non-LIS Beneficiaries ... 106
Table 6.10: Logistic Regression Results for Substitution Within Part D, Non-LIS
Beneficiaries ... 109 Table 6.11: Logistic Regression Results for Substitution to Part B Drugs, Non-LIS
Beneficiaries ... 110 Table 6.12: Logistic Regression Results for Low-Income Subsidy Eligible Beneficiaries ... 112 Table 6.13: Results for Mean Out-of-Pocket Costs Using the Expanded Drug Eligibility Definition, for Non-LIS Beneficiaries ... 113 Table 7.1: Descriptive Statistics for Beneficiary Spending, MS and RA ... 119 Table 7.2: Descriptive Statistics for Beneficiary Spending, Beneficiaries Diagnosed with Cancer ... 121 Table 7.3: Descriptive Statistics for Plan Spending for Beneficiaries Diagnosed with RA or MS ... 122 Table 7.4: Descriptive Statistics on Plan Spending for Beneficiaries Diagnosed with Cancer ... 123 Table 7.5: GLM Results for Beneficiary Total Expenditures by Non-LIS Beneficiaries 125 Table 7.6: Instrumental Variable GLM Results for Beneficiary Spending, Non-LIS
Beneficiaries ... 126 Table 7.7: GLM Results for Plan Expenditures, Non-LIS Beneficiaries ... 127 Table 7.8: Instrumental Variable GLM Results for Plan Expenditures, Non-LIS
Beneficiaries ... 129 Table 7.9: Bootstrapped Confidence Intervals for the Instrumental Variables Estimates of Beneficiary and Plan Spending, for Non-LIS Beneficiaries ... 130 Table 7.10: Results of Durbin-Wu-Hausman Test of Endogeneity, for Non-LIS Spending Models ... 130 Table 7.11: Beneficiary and Plan Expenditure Results for Beneficiaries Eligible for the Low-Income Subsidy ... 131 Table 7.12: Beneficiary and Plan Expenditure Results for the Expanded Definition of Eligibility for the Specialty Tier, for Non-LIS Beneficiaries ... 132 Table A.1: ICD-9 Codes Associated with Each Condition ... 140 Table A.2: Poisson Results for Number of Fills in the Pre-Coverage Gap Phase, for Non-LIS Beneficiaries ... 142 Table A.3: GLM Results for Beneficiary Spending, for Non-LIS Beneficiary Spending in the Pre-Coverage Gap Phase ... 143 Table A.4: GLM Results for Plan Spending for Non-LIS Beneficiaries in the
LIST OF FIGURES
CHAPTER 1: INTRODUCTION
1.1 Health Insurance Design
The design of health insurance benefits has distinct and well-documented effects on health care utilization and expenditures, as well as choice of health plan. In broad terms, optimal insurance design seeks to balance the existence of moral hazard with the appropriate level of coverage for a given technology. In addition, in competitive markets the design of insurance benefits can lead to adverse selection, as patients may be able to change insurance plans in order to obtain more generous benefits. Insurers therefore face significantly different incentives when designing benefits than do those who receive the benefits; the design of insurance must balance these two competing interests.
As a significant player in the insurance market, the federal government regulates the design of benefits associated with the Medicare Prescription Drug Benefit Program (Part D). For Part D benefits, which are provided by private insurers, the federal
government established specific regulations in order to achieve certain goals related to beneficiary protection and, in the early years of the benefit, the limitation of financial risk for private insurers providing the benefits in order to encourage insurer participation in the new program. These regulations carry significant implications for the manner by which insurers design the Part D benefits offered to beneficiaries.
Drug Benefit Program, or Part D, from both the supply side and demand side
perspectives. The supply side considers how and why Part D plans choose to cover specialty drugs, and the demand side considers beneficiary responses to such
coverage, in terms of enrollment in plans and utilization and expenditures on specialty drugs.
1.2 Specialty Drugs
Specialty drugs represent a relatively new technology in the pharmaceutical marketplace, with pharmaceutical companies increasingly focusing on the development of these drugs over the past 15-20 years. Specialty drugs have very high prices, which can reach $40,000 or more per year, and are most often prescribed by specialists. The Part D Program has defined specialty drugs as those having a negotiated monthly price exceeding a defined dollar threshold (currently $600). For the purposes of this
dissertation, the term “specialty drug” refers to the Medicare Program definition. Specialty drugs present a new challenge to insurers, as they imply significantly higher unit prices and per patient annual cost than most small molecule entities.
one of these drugs. Further discussion of the rationale behind plans placing these drugs on higher cost sharing tiers is presented in Section 1.6.
Since the extent of the high cost specialty drug market is a relatively new phenomenon, very little research has been conducted on the effect of these high
coinsurance amounts on patient utilization, enrollment, and expenditures. The majority of the research conducted on specialty drugs has used older data from the early 2000s (see for example: Goldman, Lakdawalla, Malin, Malkin & Sun, 2010; Goldman, Joyce, Lawless, Crown & Willey, 2006). The number of drugs in the more general category of specialty drugs (not applying the Part D price definition) has significantly increased over time, from fewer than 30 drugs on the market in the mid-1990s to more than 200 in 2006. By 2014, projections indicate that about 400 drugs will have been released that fall into this category (Kober, 2008). Spending for these drugs has grown by more than 10% every year, compared to growth rates of about 2-6% for small-molecule entities (Kober, 2008). Given these trends, there is a need to examine how patients respond to different levels of cost sharing for these drugs. Specialty tiers thus arise as an important issue in seeking to understand how patients’ decisions are affected by the insurers’ benefit design.
1.3 The Effect of Tiered Formularies
higher cost sharing ($25-40), and non-preferred brand drugs on the third tier ($50-70). The basic purpose of these traditional tiered formularies is to use differential copayments to shift utilization to drugs on the lower tiers (including generic versions of the same drug). This enables health insurers to leverage tier placement in manufacturer discount negotiations, whereby the insurer offers to place a given drug on a lower tier in
exchange for rebates or discounts from the manufacturer, conditional on increases in utilization.
More generally, insurers use various forms of patient cost sharing to constrain utilization whose marginal benefit is less than its cost. This implies two potential effects: first, the one addressed above, where utilization shifts to less-expensive medications (substitutes) on the formulary; and second, where no utilization occurs at all. This dissertation addresses the potential for both of these effects by examining whether or not beneficiaries use any specialty drugs in response to higher cost sharing for those drugs, and also by examining the utilization of less-expensive substitutes for those specialty drugs.
results to the predictions seen in theory, in terms of the effects of specialty tier placement on utilization, enrollment, and expenditures for these specialty drugs.
1.4 The Impact of Specialty Drugs on Insurance Coverage
The advent of specialty tiers has implications across the entire spectrum of insurance coverage in the United States. As discussed above, Part D allows the private insurers that manage the coverage to place drugs that cost more than $600 per month (2008 - present; $500 in 2007) on a specialty tier. The Part D specialty tier policy allows Part D plans to charge coinsurance higher than the 25% rate established by the
standard benefit for drugs on the specialty tier, in exchange for reducing or eliminating the deductible for all beneficiaries. In practice, this results in coinsurance rates as high as 33%, which is $200 on a $600 drug. The trade-off of higher coinsurance in exchange for reducing the deductible shifts the direct cost of specialty drugs from the plan’s
general enrollment to those beneficiaries who have been prescribed the specialty drugs. In addition, private employer-sponsored plans are shifting the coverage of
specialty drugs to these higher tiers, although they are doing so at a slower rate than plans providing coverage for Part D (Walsh, 2009). Finally, Medicare Part B, which provides coverage for medications administered in physician offices, may be affected by such changes because outpatient specialty drugs may be used as substitutes for drugs originally covered under Part B. This dissertation presents the results of an analysis that examined the likelihood of using Part B substitutes due to higher cost sharing for Part D specialty drugs.
as a percent of overall spending (nearly 15%) compared to non-Medicare households (4.8% of spending) (Kaiser Family Foundation, 2011), suggesting that health care spending is a significant concern for Medicare beneficiaries. The Government
Accountability Office (GAO) (2010) found that specialty drugs eligible for the specialty tier in 2007 accounted for 10% of Part D spending, of $5.6 billion, and that more than 75% of the prescriptions filled for specialty tier drugs were for beneficiaries eligible for the low-income subsidy (LIS), who are not subject to full cost sharing for their
medications.1
Thus, specialty drug spending is a relatively high proportion of Part D spending, considering the small number of drugs in this category. In addition, there are potentially interesting effects in the Part D coverage design for specialty drugs, in that beneficiaries not eligible for the LIS may be deterred from filling prescriptions for these drugs due to high coinsurance levels. While deterring moral hazard is an objective of cost sharing design, 33% coinsurance on specialty drugs with a price of at least $600 per month may be an excessive amount, and a lower coinsurance amount for high-priced drugs may be optimal.
1.5 Literature Review
This section presents a review of the literature related to the effects of tiered formularies on the demand for prescription drugs. Previous research breaks down into three general categories: the use of tiered formularies in prescription drug insurance programs, the elasticity of demand for various classes and categories of prescription drugs, and findings related to the use of specialty tiers in employer-sponsored plans. In general, prior research results have supposed the hypothesis that the use of tiered
1
formularies is associated with reduced utilization of those drugs placed on higher cost-sharing tiers, and that patients do respond to incentives inherent in cost cost-sharing that varies across different types of pharmaceuticals. Of note, a review of the literature related to the demand-related effects of cost-sharing tiers found that the majority of studies confirmed the hypothesis that increased cost sharing resulted in a reduction in both utilization and total expenditures, as well as lower levels of adherence to
medications (Gibson, Ozminkowski, and Goetzel, 2005).
The Effect of Tiered Formularies
The mid-1990s and early 2000s saw the initiation and expansion of tiered formularies as a key design aspect of the outpatient pharmaceutical benefit. Studies released during this time fall into two specific categories: first, studies that made us of a differences-in-differences approach to examine the effect of a plan’s implementation of additional formulary tiers, in comparison to the previous policy of fewer (usually two) tiers; and second, studies that estimate the effect of formulary tiers on utilization and costs using cross-sectional estimation techniques. The majority of these studies focus on specific categories or classes of drugs, most of which fall into the category of
“maintenance medications,” or medications that are used for an extended period of time in order to control a chronic condition. Examples of conditions requiring maintenance medications are high cholesterol and hypertension. In addition, most studies use data from employer-sponsored plans in order to estimate these effects.
preferred drugs, providing evidence that the objective of tiered formularies, which was to shift market share to preferred drugs, was effective.
Fairman, Motheral, and Henderson (2003), and Huskamp, Frank, McGuigan, and Zhang (2005) estimated the effect on utilization and costs of having three copayment tiers instead of two. Both projects used a differences-in-differences approach to examine the effect of an insurer’s switch from a two-tier to a three-tier formulary. Results indicate that the presence of three tiers reduced utilization of drugs that were placed on the third tier, and the addition of the third tier also reduced net drug cost growth for the insurer over the study period.
Briesacher, Kamal-Bahl, Hochberg, Orwig, and Kahler (2004) conducted an analysis designed to estimate the effect of three-tier formularies on medication utilization for patients diagnosed with rheumatoid arthritis and enrolled in insurance plans covering 45 large employers. Results indicated that even in cases where use of more expensive drugs on a higher tier might have been appropriate, more tiers resulted in lower odds of use, with the likelihood for use half that of patients enrolled in a one tier plan. Another study by Gibson, McGuigan, Axelsen, and Wang (2006) used cross-sectional data to examine the effect of different cost-sharing tiers on adherence to drugs used to treat high cholesterol (statins). Results indicated differential effects for new and continuing users; new users were less likely to adhere the higher the copayment, but continuing users did not change adherence in response to higher cost sharing. Finally, Kamal-Bahl and Briesacher (2004) focused on hypertension in examining the effects of cost sharing on the specific drug selected for treatment, as well as overall spending. While the
on those higher tiers, their findings support those of Huskamp et al. (2005), that overall likelihood of utilization for drugs in that category is unchanged.
Elasticity of Demand for Prescription Drugs
A number of papers have presented the results of studies designed to estimate patients’ demand response to changes in insurance coverage for prescription drugs. Perhaps the most famous study of the effect of varying coinsurance on utilization of health care services is the RAND Health Insurance Experiment (HIE). Liebowitz,
Manning, and Newhouse (1985) used data from the RAND HIE to estimate the demand for prescription drugs as a result of randomized assignment into different levels of cost sharing. Results that the elasticity of demand for prescription drugs was similar to the elasticity of demand for all outpatient services; however, coinsurance also varied for the medical benefit as well, making it difficult to draw conclusions about the effect of cost sharing on the drug portion alone. In addition, while the results provide helpful insight into the general demand reaction to cost-sharing variations, the results are now relatively out-of-date. More recent papers have also calculated the demand response to changes in benefit design while taking into account the non-linear nature of prescription drug benefits.
Contoyannis, Hurley, Grootendorst, Jeon, and Tamblyn (2005) employ an instrumental variables approach to estimate patient demand response to an increase in the coinsurance rate charged by the PharmaCare program for elderly enrollees in Quebec, Canada. Using individual claims data, the authors calculated a “synthetic” price for the prescription drugs used in the post-implementation period, based on utilization for that drug in the period before the coinsurance increase. Results indicate that the
lower than they would otherwise be (for example, -0.124 compared to -0.47 for the second period of interest in the data), both of which are statistically significant.2 While these results suggest a relatively low elasticity of expenditure for prescription drugs in light of increases in the coinsurance rate, the authors were unable to verify their instrumental variable, thus calling into question the validity of the results.
Gilman and Kautter (2007 and 2008) also estimated the effects of tiered
formularies on utilization of generic drugs, and the elasticity of demand associated with tiered formularies. Their first paper (Gilman and Kautter, 2007) used
employer-sponsored retiree data for Medicare beneficiaries. The authors found that higher risk patients were more likely to be enrolled in plans with more tiers (three as opposed to one), and that larger differences in copayments across tiers within a given plan resulted in increased use of generic drugs and lower total prescriptions filled. This suggests not only that additional tiers may be important, but also that the difference in cost sharing between tiers within a plan may have important impacts on utilization levels and cost for beneficiaries. Gilman and Kautter (2008) also used these data to estimate the elasticity of demand for prescriptions drugs, with findings the same as those of other papers, namely that plans with more differences in cost sharing experienced lower prescription utilization. Their calculated price elasticity of demand was -0.23, suggesting a relatively inelastic response to changes in the out-of-pocket price. In addition, the authors
separated out drugs used as maintenance medications, and found a lower elasticity of demand in response to tier changes for these types of medications than for others.
2
Effects of Specialty Drug Tier Placement
Although the above studies examined the effects of tier placement in the area of pharmaceuticals more generally, none of them specifically focused on the impacts of specialty drug cost sharing on patient utilization, enrollment, and expenditures. Specialty drugs may give rise to very different demand responses from less expensive small-molecule drugs, as their associated out-of-pocket costs for patients can vary much more significantly. The following studies focused specifically on the effects of specialty drug coverage.
A study conducted relatively soon after specialty drugs entered the market examined expenditures by patients diagnosed with one of four conditions for which treatment is usually a specialty drug (Goldman, Joyce, Lawless, Crown, and Willey, 2006). Using claims data from 2003-2004 from 55 private health plans, the authors focused on patients diagnosed with cancer, kidney disease, rheumatoid arthritis (RA), or multiple sclerosis (MS). The authors calculated total expenditures on drugs used to treat these conditions, and compared those expenditures across plans with different levels of generosity of benefits. This latter point is particularly important, as the authors claimed that determination of plan generosity cannot solely be based on the tier placement of the drug, but instead must take into account the structure of the deductible and other
After controlling for demographic and socioeconomic characteristics for patients in the sample, as well as for any common comorbid conditions, the authors implemented a two-part model to first estimate the likelihood of any use of the specialty drugs and, given any utilization, to estimate expenditures. Based on these results the authors estimated price elasticities of use and spending. Results indicate that demand for these specialty drugs is inelastic, with elasticity of spending estimates ranging from -0.07 for MS drugs to -0.21 for RA drugs.
Another study by Goldman, Jena, Lakdawalla, Malin, Malkin, and Sun (2010) estimated the elasticity of demand associated with five specific specialty drugs used to treat cancer. Using similar claims data from private health plans from 1997 to 2005, the authors exploited the differences in generosity across plans in order to determine whether utilization varied with associated out-of-pocket costs. Of note, for this particular study the focus was not only on outpatient prescriptions but also on drugs administered in the physician’s office, which in the context of Medicare would be covered under the Part B benefit. Given that many of these specialty outpatient pharmacy drugs can be substituted for drugs administered in a physician’s office, it is important to control for potential substitution effects across the different medical settings. As with the previous paper by Goldman et al. (2006), the authors estimated demand using a two-part model, and used those results in order to calculate arc elasticities for out-of-pocket costs and income.
the likelihood of initiating therapy. The income elasticities for initiation of therapy,
however, were not statistically significant. For the case of therapy continuation, in which the authors estimated the likelihood of continuing to fill prescriptions for the given medication, the authors did find statistically significant demand elasticities. These
elasticities fell within a range of -0.037 to -0.108. The authors conclude that low elasticity of demand for anti-cancer agents suggests that the potential effects of moral hazard may be low to anti-cancer drugs.
More recent studies have examined the effects of cost sharing on utilization and abandonment rates for RA, MS, and cancer drugs. Curkendall, Patel, Gleeson,
Campbell, Zagari, and Dubois (2008) focused on RA biologics in order to estimate the effects of out-of-pocket costs on persistence and adherence. The authors used claims data from a sample of self-insured employer plans, for which out-of-pockets were
generally pretty low (less than $20 per week). Results indicated that higher out-of-pocket costs (greater than $50 per week) were associated with a significantly lower likelihood of utilization after one year. The results were limited, however, by very few observations of high out-of-pocket costs.
Streeter, Schwartzberg, Husain, and Johnsrud (2011) estimated the
abandonment rate of oral cancer drugs as a function of the cost sharing for those drugs. They used pharmacy claims to estimate whether or not a pharmacy claim was
adjudicated after 90 days in order to determine whether the cost share associated with the drug was likely to result in the patient not picking up the prescription. They estimated that cost sharing above $500 resulted in a 4-fold greater likelihood of prescription
This suggests that high cost sharing does lead to lack of utilization, relative to low cost sharing.
Engel-Nitz, Satram-Hoang, Cao, and Reyes (2012) also examined the use of cancer drugs in association with cost sharing. The authors focused on the use of erlotinib, which is used to treat lung cancer, after a change in the formulary by a large U.S. health care plan. In this case, the formulary change was “positive” for patients, in that erlotinib was moved from tier 3 to tier 2 in the formulary. The authors found that more prescriptions for erlotinib were filled after the tier change, and that the likelihood of discontinuing treatment was lower after the formulary change.
Romley, Goldman, Eber, Dastani, Kim, and Raparla (2012) examined the likelihood of initiating therapy for MS patients, using claims data from
employer-sponsored plans. They found that the likelihood of initiating therapy within two years of diagnosis of MS was significantly lower the higher the coinsurance. More specifically, an increase of 17.8% in the coinsurance rate resulted in a 2.9% lower rate of initiation. Palmer, Abouzaid, Shi, Fowler, Lenhart, Dastani, and Kim (2012) also examined the effect of cost sharing on utilization of MS drugs. They separated patients in the data into two cohorts based on whether they had low or high cost sharing. Results indicated that those with high cost sharing were much less likely (0.79 odds ratio) to receive MS drug treatment, compared to those with lower cost sharing.
Conclusions
results from calculations of the elasticity of demand associated with prescription drugs shows a wide range of estimates, with most estimates indicating somewhat inelastic demand for medications, which is likely not due to catastrophic protections or other subsidies (that are present in Part D). While the previous literature provides a helpful foundation for understanding the empirical approach to estimating the effects of tier structures on patient demand, this dissertation adds to the current research by focusing not only on the beneficiary decisions associated with tier placement, but also on Part D plans’ decisions in light of the presence of competition in the Part D market.
Another important aspect of the literature related to the impact of cost sharing on utilization and other outcomes is the fact that previous empirical analyses tended not to control for utilization management tools such as prior authorization and step therapy.3 This may affect the results, as coverage levels are not dependent solely on cost-sharing levels but also on the additional restrictions a plan may place on access to the drug. While the data used in the empirical analyses do contain information on utilization managements tools, limitations in the data result in a potential biased measure of prior authorization; therefore, the market share and utilization analyses did not incorporate utilization management tools as an additional control.
In addition, while some of the studies presented here have acknowledged the difficulty inherent in estimating the demand effect in the presence of benefit structures that vary over the course of the year, this paper not only attempts to address those issues but also takes into account the potential endogeneity of tier placement. This endogeneity lies in the fact that the Part D plan makes its tier placement decision given certain expectations of the demand of its potential enrollees, and that enrollees will in
3
turn select a plan given the placement of their drugs on specific tiers. Therefore, the results of any analyses that do not address these issues may be biased. This dissertation uses an instrumental variable for the tier placement decision that is designed to resolve this endogeneity problem.
1.6 Hypotheses
The preceding background and rationale illustrate the anticipated effects of a Part D plan’s tier placement decision on beneficiary switching, utilization, and spending behavior in Medicare Part D. A conceptual model presented in Chapter 3 describes the complex nature of the Part D plan’s tier placement decision for specialty drugs. From the supply side perspective, Part D plans weigh numerous factors in making this decision, each of which involves trade-offs that affect other factors in complex and varying ways. The Part D plan has certain incentives, given the structure and competitive nature of the Part D benefit, to place these drugs on the specialty tier and charge a higher cost share, but those incentives work in conjunction with the other aspects of the Part D benefit (see Table 4.1 for illustration as to how the different aspects of the benefit move).
Incentive 1: Avoiding Adverse Selection
The first incentive the plan faces for specialty tier placement is associated with the potential for enrolling high-risk beneficiaries in the Part D plan (adverse selection). Given that beneficiaries can change plans each year, the Part D plan may not want to be the sole plan in an area offering the lowest cost-sharing rate for specialty drugs, thereby potentially inducing enrollment shifts to the plan.
based on the previous year’s claims data for each beneficiary, and provides an
additional payment to each plan for higher risk beneficiaries. The accuracy of the Part D risk adjustment model plays an important role, however. If the risk adjuster is an
accurate predictor of beneficiary risk, the plan will be indifferent to the enrollment of higher risk beneficiaries because the adjusted premium will be sufficient to account for the additional risk of enrolling those beneficiaries. If the risk adjuster is not accurate, the plan will be more likely to increase the cost share for specialty drugs, so as to deter higher risks from enrolling in the benefit.
The second aspect that tempers the Part D plan’s specialty tier placement decision in relation to the adverse selection problem is the fact that beneficiaries notoriously make bad decisions in selecting the plan in which to enroll. Abaluck and Gruber (2011) found that Medicare beneficiaries who enrolled in Part D made their enrollment decision largely based on the premium charged by the plan, and not by weighing their own expected out-of-pocket costs. This suggests that the results for this dissertation may show beneficiaries do not respond to cost sharing in making their enrollment decision, and in fact this is the case.
placement on the specialty tier, and also due to the trade-off allowed by Part D, in that higher cost sharing for specialty tier drugs can only be imposed in exchange for reducing or eliminating the deductible, as described above. This policy results in shifting the costs of drugs placed on the specialty tier specifically to those higher-income beneficiaries who are prescribed those drugs, as well as to the Medicare Program, which pays for the deductible on behalf of those eligible for the low-income subsidy (LIS). This shift occurs while reducing or eliminating the deductible for the general population enrolled in the plan. The results for the market share analysis support the hypothesis, in that the effects of specialty tier placement on general enrollment are not significant.4
Incentive 2: Avoiding Moral Hazard
Part D plans also face an incentive, due to the accuracy of the risk adjustment model described above, to deter moral hazard. That is, Part D plans want to set the cost sharing for drugs such that the lower observed price by beneficiaries does not induce additional utilization. The supply-side conceptual model illustrates that Part D plans set the cost share for specialty drugs in conjunction with the cost sharing for substitutes, so as to encourage utilization of lower-priced substitutes. Part D plans also may set the cost share so as to deter utilization within the Part D benefit altogether; this may result in shifting utilization over to other Parts of Medicare, like Part B (which covers medications administered in the physician’s office).
The second part of the dissertation uses Part D claims data to examine the demand-side effects of specialty tier placement on beneficiary switching, utilization, and spending behavior. This group of analyses focuses on a subset of Part D beneficiaries diagnosed with one of six conditions (RA, MS, or one of four types of cancer) who are
4
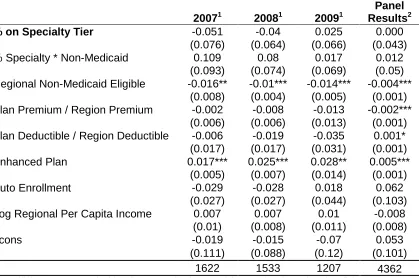
therefore more likely to be prescribed a specialty tier-eligible drug. The hypotheses for these analyses are that higher out-of-pocket cost sharing imposed by the Part D plan will reduce beneficiary utilization of the specialty tier-eligible drugs for patients not eligible for the LIS; that higher cost sharing will increase the likelihood of switching out of that plan, in order to find a plan with lower cost sharing; and higher cost sharing will increase beneficiary total spending. In addition, an analysis looking at plan spending expected to find that the higher the cost sharing imposed for specialty tier-eligible drugs, the lower the plan portion of the total costs. These analyses do not address the effect of specialty tier placement on total costs.
A significant challenge in estimating the effects of specialty tier placement on utilization, enrollment, and expenditures lies in the endogeneity present in both the plan’s tier placement decision and the beneficiary’s enrollment and utilization decisions. A plan’s decision to place a drug on the specialty tier, as opposed to a lower tier, may be influenced by its expectation of beneficiaries’ decisions, first to enroll in the plan, and then whether or not to utilize the drug. Therefore, an instrumental variables approach is used in the claims data analyses,5 which uses the average out-of-pocket spending for other conditions to instrument for the cost sharing for the condition of interest. This approach is explained in more detail in Chapter 5.
The results of the claims data analyses show somewhat mixed results, in that beneficiaries diagnosed with RA and MS have a significant positive response to cost sharing. This may be the result of data limitations, as well as the fact that the deductible (normalized by region) is highly correlated with the specialty tier cost share. However, for
5
beneficiaries with cancer, the hypotheses generally hold, in that higher out-of-pocket costs for specialty tier-eligible drugs reduces the likelihood of any utilization of those drugs, relative to no utilization of those drugs at all. For all analyses, however, the magnitude of the results is very small.
Two analyses designed to test the validity of the models resulted in somewhat mixed results. The first analysis measured the response of low-income subsidy beneficiaries to cost sharing for specialty tier-eligible drugs. This analysis should have shown no significant response to cost sharing for LIS beneficiaries, as they are not subject to the same cost share amounts as non-LIS beneficiaries. This was not always the case, suggesting that LIS beneficiaries do respond to the small, nominal cost shares imposed by the Part D benefit. The second sensitivity analysis examined the effect of a broader definition of specialty tier eligibility, which included all drugs for which at least one plan had a negotiated total monthly cost above the threshold for eligibility. This analysis was designed to show how sensitive the results are to the definition of specialty tier eligibility. The results show that the definition of specialty tier eligibility for drugs does affect the results, but that the results are still mixed.
presence of moral hazard means that plans are unwilling to eliminate the cost share. Given the fact that plans are likely competing on premium and not on other aspects of the benefit (Abaluck and Gruber, 2011), the incentives are such that plans increase the cost share for expensive specialty drugs, potentially reducing welfare compared to alternative market structures. It is important to note, however, that the purpose of this dissertation is not to estimate welfare gain or loss associated with specialty tier placement, but instead to assess the effects of such tier placement specifically on enrollment, utilization, and spending. Future work may address the welfare implications.
1.7 Outline
This dissertation is organized as follows. Chapter 2 consists of background on the Medicare Part D Program, specifically focusing on the effect of the government-imposed requirements on the Part D plans’ ability to vary their benefit designs. Chapter 3 presents the conceptual model underlying the empirical analyses. This conceptual model takes as given previous theoretical work on beneficiary demand for health care, and presents a new conceptual model designed to explain the plans’ tier placement decision for specialty drugs. This conceptual model yields two testable predictions, which flow through to the empirical sections of the project.
Chapter 4 describes the market share analysis, which focuses on estimating the overall impact of specialty tier placement on plan market share at a plan and regional level. Chapters 5 through 7 discuss the analyses related to the impact of specialty tier placement on beneficiaries, which use claims data to estimate the beneficiary response to tier placement in terms of switching, utilization, and expenditures. Chapter 8 presents conclusions based on the analyses, discusses the limitations associated with the
CHAPTER 2: BACKGROUND
2.1 The Medicare Program
The Medicare Program provides health insurance coverage for those either over age 65, are disabled, or have end-stage renal disease (ESRD). People over age 65 are eligible for Medicare if they have worked and paid into the Medicare system for at least 10 years. Beneficiaries receive their coverage from different “Parts” of Medicare. Part A provides coverage for inpatient hospital stays, Part B for outpatient health care services, and Part D provides voluntary outpatient prescription drug coverage. Parts A and B are provided and paid for by the federal government. Medicare Part C, also called Medicare Advantage, combines Parts A and B into one coverage option that is provided by private insurance companies. This dissertation focuses on Medicare Part D.
The Medicare Prescription Drug Benefit Program, or Part D, provides voluntary outpatient prescription drug coverage to all Medicare beneficiaries. Part D was created by Congress as part of the Medicare Prescription Drug, Improvement, and
Modernization Act of 2003 (also referred to as the Medicare Modernization Act), and insurance companies began providing coverage in January 2006. While Part D is administered and funded by the federal government, private insurance companies contract with the government to provide this coverage to Medicare beneficiaries. As a result, these private insurers offer a variety of drug insurance packages from which beneficiaries select the plan in which to enroll for a given year. Beneficiaries are able to change plans every year if they so choose.6
Part D allows beneficiaries to choose the plan they believe will best meet their needs for a given year. As a result, insurers compete for enrollees. Within federal
6
guidelines, Part D plans are allowed to vary their benefit designs in order to try to encourage enrollment by beneficiaries. This chapter presents further background on the benefit and formulary design requirements for Part D, as well as a description regarding Part D plan payments and the policies associated with risk management.
2.2 Benefit Design
The requirements related to the design of the Part D benefit play an important role in a Part D plan’s tier placement decision for specialty drugs, primarily due to the manner by which the design itself affects the plan’s expected costs over the benefit year.
The standard benefit designed by Congress in 2003 includes a deductible, initial coverage of 75% of drug costs, a gap in coverage where the beneficiary is responsible for 100% of the negotiated price, and a catastrophic period during which the beneficiary is responsible for the greater of 5% of the drug cost or small copayments. As an
Figure 1.1 Medicare Part D Standard Benefit, 2010.
For a Part D plan, the most important aspects of the benefit design are the initial coverage period and the catastrophic period. In the initial coverage period (post-deductible and prior to the beneficiary reaching the gap, represented by the lower orange block in Figure 1.1), the plan is responsible for 75% of the cost of medications filled by its enrollees. This means that, to the extent a plan receives enrollment of beneficiaries who fill prescriptions for expensive specialty drugs, the plan may be
responsible for the full 75% difference between the initial coverage limit ($2,830 in 2010) and the deductible ($310), as beneficiaries taking these medications are very likely to
$310 Deductible $2,830 in Total Drug Costs
($940 out of pocket) $3,610 Coverage Gap
(“Doughnut Hole”)
Plan Pays 75%
Plan Pays 15%; Medicare Pays 80%
Enrollee Pays 100% minus $250
rebate Enrollee Pays
5%
Enrollee Pays 25%
$6,440 in Total Drug Costs ($4,550 out of pocket)
enter the coverage gap and even catastrophic coverage.7 Table 2.1 presents the deductible, initial coverage limit, and catastrophic threshold values for the years 2006-2010. The data used to estimate beneficiary utilization and enrollment effects are for the years 2007 through 2008.
Table 2.1. Part D Standard Benefit Design Thresholds, 2006-2010.1 Deductible
(Beneficiary)
Initial Coverage Limit
(Plan + Beneficiary)
Catastrophic Coverage Threshold
(Beneficiary)
2006 $250 $2250 $3600
2007 $265 $2400 $3850
2008 $275 $2510 $4050
2009 $295 $2700 $4350
2010 $310 $2830 $4550
1
Sources: Medicare Part D Benefit Parameters for Standard Benefit, CMS, 2007-2008; CMS 2009 & 2010.
In addition, the plan’s expectation of the number of beneficiaries who will enter the catastrophic period will play an important role in tier placement. This is due to the fact that the plan is still responsible for 15% of the cost of all medications in the catastrophic phase. Thus, the plan will take into consideration expected costs in the catastrophic phase when determining tier placement for specialty drugs, which are much more likely to cause beneficiaries to enter the catastrophic period than other, less
expensive medications.
2.3 Formulary Design
Formulary design is another important aspect of the Part D benefit design. Formularies in general allow insurance plans the ability to encourage enrollees to use lower-priced medications, such as generics and lower-priced therapeutic alternatives, and also give plans the flexibility to negotiate discounts with manufacturers in exchange
7
for lower (or preferred) tier placement. The Part D formulary requirements place some important limits on the ability of plans to accomplish these objectives, particularly in relation to specialty drugs prescribed for cancer patients.
The first important formulary requirement states that plans must cover at least two drugs in each category or class of medication. This policy allows Part D plans to establish differentiated and restricted formularies that may appeal to potential enrollees, while ensuring that beneficiaries receive coverage of at least two drugs for each possible category or class of disease. This policy may also help to reduce Part D plan costs to the extent that plans can negotiate discounts with manufacturers in exchange for lower tier placement. Clearly, the extent to which these discounts may apply is a function of the depth and breadth of a given category or class of medication, as more drugs in a category or class gives the plan more flexibility to restrict the overall number of drugs covered, as well as to negotiate deeper discounts for those drugs selected for the formulary.
However, there are six categories and classes of medications for which Part D plans are required to cover all or substantially all drugs. These classes, which are the following: immunosuppressant, antidepressant, antiretroviral, anticonvulsant,
essentially guaranteed (Office of Inspector General, 2011). The effects of this policy will be important when it comes to examining the effect of tier placement on cancer drug utilization and enrollment by Medicare beneficiaries with cancer, as all therapeutic substitutes will be included on the Part D formulary. The six classes, however, do not include drugs used to treat rheumatoid arthritis (RA) or multiple sclerosis (MS), therefore the effects would be expected to differ for these conditions.
2.4 The Specialty Tier Option
CMS allows Part D plans offering non-standard benefit designs to add a specialty tier to the formulary. In order to be placed on the specialty tier, drugs must have a
monthly price of at least $600 ($500 in 2007). Plans are generally restricted to 25% coinsurance for drugs placed on the specialty tier, but they may increase the
coinsurance in exchange for reducing or eliminating the deductible, which in practice results in a maximum coinsurance amount of 33% for the specialty tier. The specialty tier policy also shields plans from requests for cost sharing exemptions from beneficiaries who cannot take substitutes that carry lower cost sharing and who wish to pay that lower cost share amount. If plans do not place a specialty drug on the specialty tier, they may impose any level of cost sharing they choose (even exceeding 33%), so long as the actuarial equivalence requirement of 25% coinsurance is met across all covered drugs.8 However, in practice plans tend not to increase the cost sharing above 33% if the drug is not placed on the specialty tier; as a result, the cost share for the specialty tier is usually the highest cost share imposed by a given plan.
8
2.5 Utilization Management Tools
Part D plans also have the ability to impose utilization management (UM) tools, such as prior authorization, step therapy, and quantity limits, on specific medications placed on the formulary. Prior authorization requires coverage approval by the plan prior to the beneficiary filling the prescription, as an additional check on the appropriate use of a given drug. Step therapy restrictions require patients to try lower-priced covered substitutes before having their coverage approved for the more expensive medication. Finally, quantity limits are as the name implies; the plan has imposed a limit on either the number of fills of a medication it will cover, the number of pills in a given month it will cover, etc. The use of these tools places additional restrictions on access to these medications for Medicare beneficiaries; their use in the case of specialty drugs may affect utilization, enrollment, and expenditures to an even greater extent than high cost sharing alone.
However, in order to ensure that utilization management tools do not place overly restrictive requirements on access, CMS has stated in formulary guidance that it expects utilization management tools to reflect practice consistent with “existing formulary
2.6 Actuarial Equivalence
When Congress designed the Part D benefit in 2003, it provided options for plans to structure their benefits in a manner different from the standard benefit described above. In order to offer such alternative benefits, however, the Part D plans must be able to show that the new design is at least “actuarially equivalent” in value to the standard plan design. This actuarial equivalence requirement is extremely important when considering how plans design these alternative benefits.
There are four potential benefit design alternatives for Part D. The first is the standard benefit as designed by Congress (and described in the first section, above). The second option is Actuarially Equivalent plans; the only difference when compared to the standard defined benefit is that these plans are allowed to vary the cost-sharing requirements imposed on beneficiaries via the creation of tiered formularies or via establishment of preferred pharmacy networks. These cost sharing requirements are allowed to vary not only in the initial coverage period, but also in the catastrophic period. For Actuarially Equivalent plans, CMS requires two tests of actuarial equivalence (CMS, Actuarial Bid Training, 2010): the first test shows that the expected average cost sharing below the initial coverage limit is equal to the 25% cost sharing required by standard coverage; and second, a test that shows that the expected cost sharing in the catastrophic period is actuarially equivalent to the cost-sharing under the defined standard benefit (American Academy of Actuaries Work Note, 2008; Medicare Prescription Drug Benefit Manual, CMS, 2009).
allowed to reduce the deductible and increase the initial coverage limit (the dollar threshold beyond which a beneficiary enters the coverage gap). These types of plans must pass give different actuarial equivalence tests (Actuarial Bid Training, 2010).
Enhanced Alternative plans are also allowed to provide additional coverage beyond what the standard Part D benefit offers. This additional coverage includes coverage in the gap and coverage of drugs that are otherwise excluded from the Part D benefit by law. Beneficiaries enrolling in Enhanced Alternative plans are required to pay a supplemental premium for those benefits that are above and beyond what Medicare will pay for the standard value of the benefit.
For these final two plan options, actuarial equivalence is demonstrated via five specific tests. The first test is for the initial coverage period, and ensures that the “plan coverage for [enrollees] who have claims greater than the initial coverage limit would need to be great or equal” to 75% of the difference between the initial coverage limit and the deductible. For catastrophic coverage, the average cost sharing percentage has to be no greater than the cost sharing imposed by the standard plan (American Academy of Actuaries Work Note, 2008; Medicare Prescription Drug Benefit Manual, CMS, 2009).
The third test ensures actuarial equivalence of the final benefit design aspect that plans are able to alter. Thus, the deductible must be no greater than the deductible for the standard plan. The fourth and fifth tests examine the overall value of the benefit: the fourth ensures that “the total covered costs of the proposed plan… equal or exceed the total covered costs of standard coverage;” and the second ensure that “the unsubsidized value of the proposed plan…equal[s] or exceed[s] that of the standard coverage”
Finally, all Part D plan designs are reviewed in order to ensure that they will not discriminate against any type of Part D beneficiary. According to Medicare actuaries, statistical methods are used in order to determine the “acceptable cost-sharing
thresholds” for plans in light of attempts to avoid discrimination (Sue Todhunter, Personal Communication, 27 June 2011).
2.7 Risk Sharing
Private insurance companies that elect to participate in the Part D program receive monthly payments from the federal government for coverage provided to beneficiaries enrolled in their plan. If the plan does not receive any enrollees, the plan receives no payments. These monthly payments are equivalent to, on average,
approximately 74.5% of the premium for Part D coverage, plus additional payments for risk adjustment, low-income subsidies, and estimated catastrophic assistance. At the end of the plan year, the government conducts a reconciliation process to ensure that all payments were appropriate, and to calculate the risk corridors.
All of the additional payments, including risk adjustment, catastrophic assistance, and the risk corridors, are designed to mitigate the Part D plan’s risk of providing
insurance to Medicare beneficiaries. These mechanisms were built in to the Part D benefit in order to ensure that private insurers would choose to participate in the new program, by providing financial protection to plans under three different circumstances. This section describes these payment mechanisms in more detail, as all of these payments provide significant protection against the risk of high plan spending.
Catastrophic Cost Subsidization
who enter the catastrophic portion of the benefit. During this phase, beneficiaries pay the greater of 5% of the medication price or low copayments for their medications. The Part D plan, however, only pays 15% of the total cost of the drugs; the federal
government pays 80%.
The sharing of catastrophic costs on the part of the government reduces Part D plans’ exposure to high costs in the event that an enrollee will incur significantly high prescription drug spending, and may alter the Part D plan’s decision-making when establishing the tiered formulary structure for the initial coverage phase of the benefit. This latter effect may increase the likelihood that Part D plans will place specialty drugs on a lower cost-sharing tier, as the plan would not be responsible for all spending in the event that enrollees enter the catastrophic phase of the benefit. However, the plan may be concerned that lower tier placement may increase the number of beneficiaries who use specialty drugs who choose to enroll in the plan. This would increase overall plan costs even in the catastrophic period; as a result, the plan may still prefer to place the drug on the specialty tier.
Risk Adjustment
note that this risk is based on lagged data on an individual beneficiary; as such, the plan may be susceptible to some unforeseen costs due to any new diagnoses for that beneficiary in a given year.
Analysis of the early risk adjustment model (2006) for Part D has found that it under-predicted spending for beneficiaries with high costs (Hsu, Huang, Fung et al., 2009). This suggests that plans are in fact at higher financial risk if they enroll high-risk Part D beneficiaries, as the payments made under risk adjustment will not be sufficient to offset the higher costs associated with those beneficiaries. This provides further incentive to plans to deter enrollment and utilization of specialty drugs by beneficiaries of high risk. However, these early risk adjustment models have been replaced with newer, more robust models that more accurately predict the risk of spending for sub-groups, mostly by using actual Part D claims data to construct the model (Kautter, Ingber, Pope, and Freeman, 2012).
Risk Corridors
The final risk mitigation policy for Part D is the risk corridors. The risk corridors were designed to allow the federal government to share in either the losses or profits that the Part D plan incurred in a given year. At the end of the year, CMS calculates the target amount for a Part D plan, which is equal to expected costs incurred by the plan on behalf of all of their beneficiaries. These are equal to total revenues for the plan, which in this case are the total premiums received by the plan from the government and
beneficiaries. This target amount is then compared to the total amount the plan paid out in benefits over the course of the year, net or any discounts received from
around the target amount), the federal government either pays the Part D plan a portion of the losses, or recoups a portion of the profits.
Of note, the thresholds around the target amount were smaller in the early years of Part D, so as to expose Part D plans to smaller levels of risk given the uncertainty of starting up the new program. The thresholds have expanded over time, and the amount of profit/loss shared by the government has also been reduced. This means that Part D plans have been exposed to increasing risk of overall profits and losses in more recent years, although the catastrophic spending protections and risk adjustment payments continue.
2.8 Low Income Subsidy
The final Part D policy that may affect a Part D plan’s tier placement decision for specialty drugs is the low-income subsidy (LIS). This subsidy exists for beneficiaries who are either eligible for Medicare and Medicaid (dual eligibles), or who meet income and asset requirements as established by the MMA. Beneficiaries who receive the low-income subsidy pay no or very reduced premiums for Part D, and pay very low fixed copayments for all of their medications. For example, dual eligibles with incomes below or equal to 100% of the Federal Poverty Level (FPL) paid $1.00 cost sharing for generic or preferred drugs in 2006 and 2007, and $3.00/$3.10 for other medications in
2006/2007, while dual eligibles with incomes above 100% FPL paid $2.00/$2.15 or $5.00/$5.35 in 2006/2007, respectively (Medicare Part D Benefit Parameters for
The low-income subsidy may affect a Part D plan’s tier placement decision due to the fact that LIS beneficiaries who enroll in the plan are not subject to the tiered formulary, and therefore will likely have different utilization patterns compared to those beneficiaries who are not eligible for the LIS. The federal government subsidizes all differences in actual costs between the standard benefit and the plan payment amount for LIS beneficiaries, and as a result the plan may not have significant incentive to try to alter utilization patterns with the use of tiered formularies. However, Part D plans are still required to pay 15% of the cost of LIS beneficiaries’ medications in the catastrophic phase, which provides some incentive to affect utilization patterns.
Only non-enhanced plan types are eligible for full subsidization of the premium, and only a subset of those plans are eligible each year for enrollment by LIS
beneficiaries at the $0 premium level. The determination as to which plans are eligible for these enrollments is made every year based on the premium offered by plans in a given region; the number of eligible plans changes significantly by year and region. Thus, Part D plans seeking to enroll large numbers of LIS beneficiaries must take their premium into account when establishing the benefit structure for Part D.
2.9 The Interaction Between Parts B and D
for specialty drugs which may have substitutes covered under an alternative benefit (in this case, Part B being the alternative), Medicare beneficiaries may elect to receive their medications in a physician office setting in order to pay a lower absolute
copayment. In addition, while additional cost-sharing assistance is generally prohibited in Part D, the copayment for Part B medications can be bought down by alternative
coverage sources, such as Medigap, further creating an incentive for Medicare
beneficiaries to use Part B substitutes as opposed to specialty drugs covered under Part D.
2.10 Conclusions
The Part D Program has enabled Medicare beneficiaries to access outpatient pharmacy benefits via a melding of private plans and government regulation. The Part D Program has a number of objectives, including: to offer beneficiaries a variety of plan options, to encourage plans to be at least somewhat innovative in their plan benefit designs, to protect beneficiaries from plan offerings that may not provide sufficient coverage, and to protect plans from unexpectedly high costs / financial risk. The results of all of these objectives is an extensive array of regulations and guidance governing the ability of Part D plans to vary their offerings from the standard benefit as defined by Congress.
likely are taken into consideration when a plan designs its benefits; of particular interest for this dissertation is the tier placement determination for specialty drugs.
Part D plans do retain some ability to vary benefits within the CMS actuarial equivalence parameters. This suggests that the identification strategy of this
dissertation, which assumes that beneficiaries may alter their enrollment and utilization patterns in response to their Part D plans’ tier placement strategy for specialty drugs, holds true because Part D plans are able to vary offerings across a variety of factors.
One manner by which Part D plans can vary such offerings is by electing to place specialty tier drugs on a higher cost-sharing tier, with coinsurance of 25% to 33%. Since the actuarial equivalence tests, which solely require equivalence to the standard
coinsurance of 25%, are conducted across all drugs included in the formulary, plans are able to design benefits that (for example) incorporate flat copayments on lower tiers and coinsurance on higher tiers. This may result in plan designs that trade off lower
copayments for lower tier (i.e., generic) drugs, with coinsurance (and therefore higher out-of-pocket costs) for specialty tier drugs. As a result, beneficiaries who take generic medications may end up paying less than 25% out-of-pocket for their medications, while those taking specialty drugs placed on the specialty tier may pay 25% (or more).
CHAPTER 3: CONCEPTUAL MODEL
3.1 Introduction
The conceptual approach for this dissertation incorporates two perspectives: the insurer, which determines whether to place the specialty drug on the specialty tier, and the beneficiary, who decides whether to utilize a given specialty drug and/or whether to maintain enrollment in a given plan. Following previous theory (Grossman, 1972), the model begins with the assumption that beneficiaries have some demand for medical care as a function of prices for that care, their insurance coverage, and their individual income level. They will demand specialty drugs based on these three factors.
The insurance factor is also of interest in this dissertation, because insurance reduces drug prices for beneficiaries below their full price, potentially increasing
beneficiary demand for covered services and/or drugs. Previous literature, as described in the introduction, has discussed beneficiary responses to cost sharing. The conceptual model described below draws on this literature in order to establish a foundation for the empirical analyses, but does not add new theory from the viewpoint of the beneficiary’s decision. The extent to which insurers design coverage so as to vary the cost share levels for different types of drugs, and the demand response by beneficiaries to these out-of-pocket costs, is the focus of this dissertation.