ARTICLE
US Infant Mortality Trends Attributable to
Accidental Suffocation and Strangulation in Bed
From 1984 Through 2004: Are Rates Increasing?
Carrie K. Shapiro-Mendoza, PhD, MPHa, Melissa Kimball, MPHa, Kay M. Tomashek, MD, MPHa, Robert N. Anderson, PhDb, Sarah Blanding, MPHa
aDivision of Reproductive Health, National Center for Chronic Disease Prevention and Health Promotion, Centers for Disease Control and Prevention, Atlanta, Georgia; bNational Center for Health Statistics, Centers for Disease Control and Prevention, Hyattsville, Maryland
The authors have indicated they have no financial interests relevant to this article to disclose.
What’s Known on This Subject
Several recent studies have examined trends and characteristics of infant deaths attrib-uted to injury, but these studies were either limited to postneonatal deaths or did not specifically examine infant injury attributed to ASSB.
What This Study Adds
Infant mortality rates attributable to ASSB have quadrupled in the last 2 decades, with the most dramatic increase occurring after 1996. The reason for this increase is un-known, but black male infants⬍4 months of age are disproportionately affected.
ABSTRACT
OBJECTIVE.Accidental suffocation and strangulation in bed, a subgroup of sudden, unexpected infant deaths, is a leading mechanism of injury-related infant deaths. We explored trends and characteristics of these potentially preventable deaths.
METHODS.In this descriptive study, we analyzed US infant mortality data from 1984 through 2004. To explore trends in accidental suffocation and strangulation in bed and other sudden, unexpected infant deaths, we calculated cause-specific infant mortality rates and estimated proportionate mortality. Sudden, unexpected infant death was defined as a combination of all deaths attributed to accidental suffocation and strangu-lation in bed, sudden infant death syndrome, and unknown causes. Finally, we exam-ined factors that were reported as contributing to these accidental suffocation and strangulation in bed deaths.
RESULTS.Between 1984 and 2004, infant mortality rates attributed to accidental suffoca-tion and strangulasuffoca-tion in bed increased from 2.8 to 12.5 deaths per 100 000 live births. These rates remained relatively stagnant between 1984 and 1992 and increased between 1992 and 2004; the most dramatic increase occurred between 1996 and 2004 (14% average annual increase). In contrast, total sudden, unexpected infant death rates remained stagnant between 1996 and 2004, whereas the proportion of deaths attributed to sudden infant death syndrome declined and to unknown cause increased. Black male infants⬍4 months of age were disproportionately affected by accidental suffocation and strangulation in bed. Beds, cribs, and couches were reported as places where deaths attributed to accidental suffocation and strangulation in bed occurred.
CONCLUSIONS.Infant mortality rates attributable to accidental suffocation and strangu-lation in bed have quadrupled since 1984. The reason for this increase is unknown. Prevention efforts should target those at highest risk and focus on helping parents
and caregivers provide safer sleep environments.Pediatrics2009;123:533–539
A
CCIDENTAL SUFFOCATION ANDstrangulation in bed (ASSB), a subgroup ofsud-den, unexpected infant deaths (SUIDs), is a leading category of injury-related infant deaths. Although evidence suggests that the rate of ASSB is increasing,1ASSB
deaths are potentially preventable. ASSB includes suffocation by (1) soft bedding, pillow, or waterbed mattress, (2) overlaying or rolling on top of or against infant while sleeping, or (3) wedging and entrapment of an infant between 2 objects such as a mattress and wall, bed frame, or furniture; and strangulation by asphyxiation, such as when an infant’s head and neck become caught between crib railings. ASSB
deaths share many of the same sociodemographic characteristics as sudden infant death syndrome (SIDS) and cause
unknown deaths.1
A comprehensive death-scene investigation is critical to classify SUIDs deaths accurately and to help distinguish ASSB deaths from SIDS deaths. Autopsy findings alone often cannot differentiate between ASSB and SIDS because
www.pediatrics.org/cgi/doi/10.1542/ peds.2007-3746
doi:10.1542/peds.2007-3746
The views in this article are those of the authors and do not necessarily represent the official position of the Centers for Disease Control and Prevention.
Key Words
accidental suffocation, sudden unexpected infant death, sudden infant death syndrome, SIDS, infant mortality, classification, reporting, death certification, vital statistics, death-scene investigation, unintentional injury
Abbreviations
ASSB—accidental suffocation and strangulation in bed
SUID—sudden, unexpected infant death SIDS—sudden infant death syndrome CDC—Centers for Disease Control and Prevention
SUIDIRF—Sudden, Unexplained Infant Death Investigation Report Form NCHS—National Center for Health Statistics
ICD-9 —International Classification of Diseases, Ninth Revision
ICD-10 —International Statistical Classification of Diseases and Related Health Problems, Tenth Revision
CI— confidence interval Accepted for publication May 19, 2008
Address correspondence to Carrie K. Shapiro-Mendoza, PhD, MPH, Centers for Disease Control and Prevention, Maternal and Infant Health Branch, Division of Reproductive Health, Mail Stop K-23, 4770 Buford Hwy NE, Atlanta, GA 30341-3717. E-mail: [email protected]
pathophysiological findings that can distinguish an ASSB death from a SIDS death are not always evident.2,3
Recent evidence showed that the decline in SIDS, from 1998 through 2001, was offset by an increase in ASSB and cause unknown deaths, suggesting that there has been a change in the way these SUIDs are classified and reported.1,8Researchers need improved scientific
knowl-edge and understanding about the epidemiology of ASSB deaths so that preventive interventions can be effectively designed.
Prevention of ASSB deaths can have an important effect on reducing the overall infant mortality rate. In-juries and injury-related deaths can be prevented by ensuring that all infants live in a safe environment; therefore, public health professionals must first know what constitutes a dangerous environment and second, how to best educate caregivers about providing safe infant environments.
Although several recent studies have examined trends and characteristics of infant deaths attributed to injury, these studies were either limited to postneonatal
deaths or did not specifically examine ASSB deaths.4–8
Earlier descriptive studies5that examined trends in
in-fant ASSB deaths were conducted before the release of the national SUID death-scene guidelines in 1996 or were limited to deaths reported to the US Consumer Product Safety Commission. The Centers for Disease Control and Prevention’s (CDC’s) 1996 guidelines for death-scene investigation and Sudden, Unexplained
In-fant Death Investigation Report Form (SUIDIRF)9were
part of an effort to standardize and improve the quality of data collection at infant death-scene investigations and promote a more informed assignment of cause-of-death classification.
In this study, we explored trends in infant deaths attributed to ASSB since 1984, before and after the release of the 1996 national guidelines, and assessed how the trend indicating fewer SIDS deaths might be explained by the trends showing increases in ASSB and cause unknown deaths. In addition, we evaluated de-mographic characteristics of infants who reportedly died of ASSB and examined the primary circumstances and factors that were reported as contributing to these deaths. This analysis focused on improving understand-ing of the epidemiology of these deaths and thereby strengthening our ability to design more effective pre-vention strategies.
METHODS
For this population-based, descriptive study, we calcu-lated and analyzed cause-specific infant mortality rates for ASSB, SIDS, and cause unknown and estimated pro-portionate mortality for 1984 –2004 using mortality data from the Compressed Mortality File accessed via CDC WONDER (http://wonder.cdc.gov). The Compressed Mortality File is derived from the National Vital Statistics System and is compiled by the CDC’s National Center for Health Statistics (NCHS). Non-US residents were ex-cluded.
We defined the cause-specific infant mortality rate as the number of deaths attributed to a specific cause in a
calendar year per 100 000 live births for the same year.10
Codes for cause of death were defined according to the
International Classification of Diseases, Ninth Revision
(ICD-9) for 1984 –1998, and the International Statistical Classification of Diseases and Related Health Problems, Tenth Revision(ICD-10) for 1999 –2004.11,12We used guidelines
from the NCHS to determine the comparability between
ICD-9 and ICD-10 codes.13We defined cause of death by
using the following ICD-9 and ICD-10 codes: ASSB (E913.0; W75), SIDS (798.0; R95), and unknown cause, (799.9; R99) based on the underlying cause of death. SUID was the combination of ASSB, SIDS, and cause unknown deaths.
We used Poisson regression to determine the average annual percent change in cause-specific mortality rates by using the number of deaths as the response variable with a population offset and added years to the model as an independent variable. Rate ratios generated from regres-sion models were subtracted from 1 and then multiplied by
100 to estimate the average annual percent changes. z
values and corresponding 95% confidence intervals (CIs) were used to assess the precision of the percent changes.
The change from ICD-9 to ICD-10 in 1999 resulted in comparability problems for many causes of death, in-cluding those in our analysis (eg, both ASSB and SIDS were more likely to be selected as the underlying cause of death under ICD-10 than under ICD-9). These com-parability problems result in discontinuities in the trends for these causes. We accounted for this comparability issue in our calculations of the annual percent change by
creating a dummy variable in our regression models (1⫽
ICD-10 years, 0 ⫽ ICD-9 years) to control for the
dis-continuity caused by changing revisions.
We defined proportionate ASSB mortality as the number of deaths attributable to ASSB divided by the total number of SUIDs multiplied by 100. We also cal-culated the proportionate mortality for SIDS and un-known causes. To improve our understanding of the demographic characteristics of infants whose deaths were attributed to ASSB, we compared ASSB percent distributions by age at death, month of death, and day of death using the 2002–2004 US Multiple Cause of Death Data file. We combined these most recent years of data available to provide more stable rates because annual random variations in subcategories with small numbers can produce wide fluctuations in rates.
reported to have occurred (eg, adult bed, crib, sofa) and by whether bed sharing or cosleeping was reported.
We limited our assessment of racial and ethnic dis-parities to black and white infants because misreporting of decedent’s racial and ethnic identity to groups on the death certificate is a concern.14 Because this analysis
used existing deidentified NCHS data, it was determined to be research not involving human subjects, and there-fore exempt from human subjects review. Data were analyzed by using Stata 9 statistical software (Stata Cor-poration, College Station, TX).
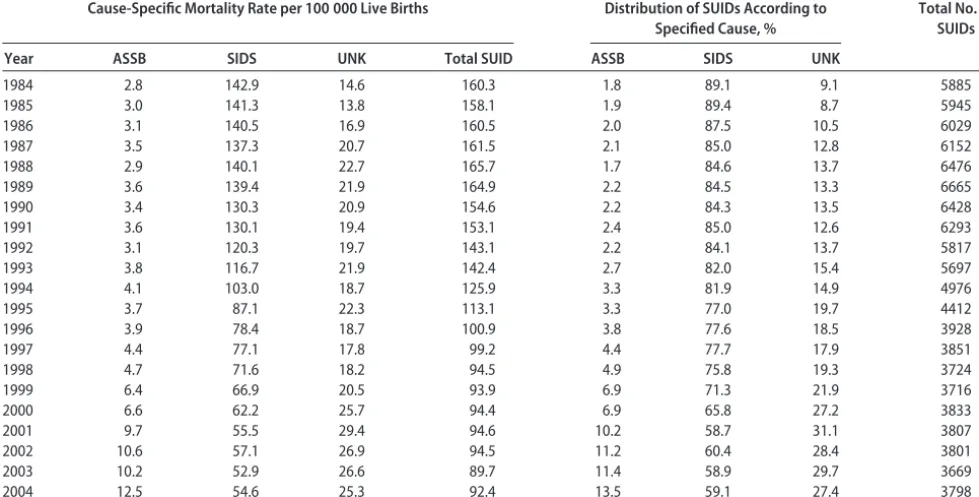
RESULTS
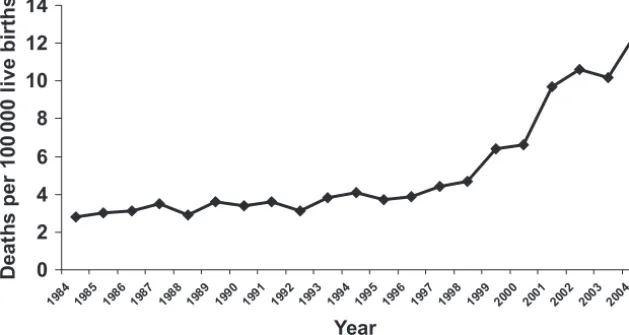
In Table 1 we assess the overall and cause-specific SUID mortality trend, as well as the distribution of SUIDs by cause of death. The trend in the overall total SUID rate mirrors the trend in the SIDS rate until 1998 when the total SUID rate begins to become stagnant and remain stagnant through 2004, the latest year that data were available. Between 1984 and 2004, ASSB infant mortal-ity rates more than quadrupled, from 2.8 to 12.5 deaths per 100 000 live births (Table 1 and Fig 1). This repre-sents 513 infant deaths attributed to ASSB in 2004 com-pared with 103 in 1984. Between 1984 and 1992, infant mortality attributed to ASSB remained relatively stag-nant ranging from 2.8 to 3.6 deaths per 100 000 live births. Then, between 1992 and 1996, the number of infant deaths attributed to ASSB began to increase. This increase continued through 2004, but was more dra-matic after 1996 and onward. Of note, each of the cause-specific rates and the number of deaths decrease in 2003. In 2004, only the rate for ASSB returns to a higher level than previous years. In contrast, the proportion of deaths attributed to ASSB and cause unknown increased
in 2003 compared with 2004, whereas the proportion of SIDS deaths during this time declined. In 2004, the proportion of deaths attributed to ASSB and SIDS deaths both increased, whereas unknown cause declined.
Deaths attributed to cause unknown increased from 1984 through 1986 and then remained relatively stag-nant from 1987 through 1999. Rates increased from a range of 17.8 to 22.7 deaths per 100 000 live births during 1987–1999 to 25.3 to 29.4 during 2000 –2004. Deaths attributed to SIDS declined from 1984 through 2000 and then remain stagnant from 2001 through 2004.
To assess the rate of change in cause-specific mortality rates, we calculated the average annual percent change from 1996 through 2004. Although there has been a statistically significant average annual percent increase
in ASSB deaths of 14% (95% CI: 11% to 16%;P⬍.05),
the total SUID rates have remained fairly stagnant
(av-erage annual percent change: ⫺1% [95% CI:⫺2% to
0%]; P ⬍.05). The average annual percent of deaths
increased 2% (95% CI: 1% to 3%; P ⬍.05) for cause
unknown deaths and declined 4% (95% CI: ⫺5% to
⫺3%;P⬍.05) for deaths attributable to SIDS.
In our assessment of proportionate mortality, the pro-portion of SUID deaths attributed to ASSB remained fairly stable, ranging from 1.8% to 2.4% for 1984 through 1992 (Table 1 and Fig 2). However, this propor-tion began to increase in 1993 and continued to do so through 2004, increasing fivefold from 2.7% in 1993 to 13.5% in 2004. Although the combined SUID rate re-mained stable from 1997 through 2004, the proportion of SUID deaths attributed to ASSB more than tripled, from 4.4% in 1997 to 13.5% in 2004 and the proportion of deaths attributed to SIDS declined, from 77.7% in TABLE 1 Total and Cause-Specific SUID Mortality Rates and Proportionate SUID Mortality, United States, 1984 –2004
Cause-Specific Mortality Rate per 100 000 Live Births Distribution of SUIDs According to Specified Cause, %
Total No. of SUIDs
Year ASSB SIDS UNK Total SUID ASSB SIDS UNK
1984 2.8 142.9 14.6 160.3 1.8 89.1 9.1 5885
1985 3.0 141.3 13.8 158.1 1.9 89.4 8.7 5945
1986 3.1 140.5 16.9 160.5 2.0 87.5 10.5 6029
1987 3.5 137.3 20.7 161.5 2.1 85.0 12.8 6152
1988 2.9 140.1 22.7 165.7 1.7 84.6 13.7 6476
1989 3.6 139.4 21.9 164.9 2.2 84.5 13.3 6665
1990 3.4 130.3 20.9 154.6 2.2 84.3 13.5 6428
1991 3.6 130.1 19.4 153.1 2.4 85.0 12.6 6293
1992 3.1 120.3 19.7 143.1 2.2 84.1 13.7 5817
1993 3.8 116.7 21.9 142.4 2.7 82.0 15.4 5697
1994 4.1 103.0 18.7 125.9 3.3 81.9 14.9 4976
1995 3.7 87.1 22.3 113.1 3.3 77.0 19.7 4412
1996 3.9 78.4 18.7 100.9 3.8 77.6 18.5 3928
1997 4.4 77.1 17.8 99.2 4.4 77.7 17.9 3851
1998 4.7 71.6 18.2 94.5 4.9 75.8 19.3 3724
1999 6.4 66.9 20.5 93.9 6.9 71.3 21.9 3716
2000 6.6 62.2 25.7 94.4 6.9 65.8 27.2 3833
2001 9.7 55.5 29.4 94.6 10.2 58.7 31.1 3807
2002 10.6 57.1 26.9 94.5 11.2 60.4 28.4 3801
2003 10.2 52.9 26.6 89.7 11.4 58.9 29.7 3669
2004 12.5 54.6 25.3 92.4 13.5 59.1 27.4 3798
1997 to 59.1% in 2004. During the same time, the proportion of deaths attributed to unknown cause in-creased until 2000, but between 2000 and 2004, the proportion of deaths are nearly identical with periodic rises and falls in that time period. Thus, for deaths of unknown cause, there was no indication of an increas-ing or decreasincreas-ing trend durincreas-ing 2000 through 2004, al-though the proportion of deaths was higher than any previous years.
Infants whose deaths were attributed to ASSB during 2002–2004 had some noteworthy characteristics. For example, black infants were disproportionately affected (27.3 vs 8.5 deaths per 100 000 live births for blacks and whites, respectively), as were male infants (12.5 vs 9.6 deaths per 100 000 live births for males and females,
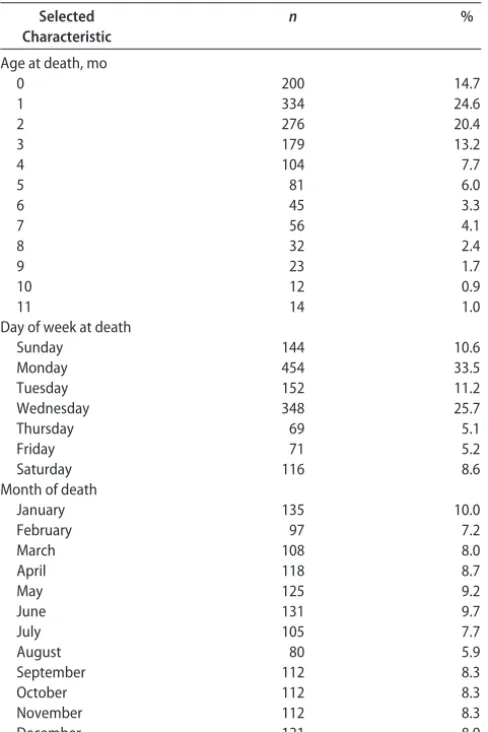
respectively). Table 2 shows ASSB percent distributions by age at death, month of death, and day of death. Infants 0 to 3 months old (especially those 1 month old) had the highest mortality attributable to ASSB. Whereas there was no seasonal variation detected for ASSB mor-tality, the day of week pattern was more variable. ASSB mortality was from 3 to 6 times higher on Mondays and Wednesdays than other days of the week, and mortality on Sundays and Tuesdays was double that of Thursdays and Fridays.
Review of the 2003–2004 death certificate written text revealed that overlay was the most frequently re-ported circumstance for infant ASSB deaths (33.8%), followed by suffocation by bedding materials (13.8%) and wedging or entrapment (14.2%; Table 3). However,
0 2 4 6 8 10 12 14
1984 1985 1986 1987 1988 1989 1990 1991 1992 1993 1994 1995 1996 1997 199
8
1999 2000 2001 2002 2003 2004
Year
D
ea
th
s
pe
r
1
00
0
00
li
v
e births
FIGURE 1
Infant mortality rates per 100 000 live births attributable of ASSB, United States, 1984 –2004.
0 10 20 30 40 50 60 70 80 90 100
1984 1985 1986 1987 1988 1989 1990 1991 1992 1993 1994 1995 1996 1997 1998 1999 2000 2001 2002 2003 2004
Year
P
e
rce
n
t
o
f
S
U
ID
d
eat
h
s
0 20 40 60 80 100 120 140 160 180
D
eat
h
s
p
e
r
1
00
000
li
ve
b
ir
th
s
SIDS
Unknown cause ASSB
Total SUID death rate
FIGURE 2
the circumstances could not be ascertained from the data provided in 35.1% of the cases. Beds, cribs, and couches were reported as the most common sleep surfaces where ASSB deaths occurred. Of the 931 ASSB deaths during 2003 and 2004, 27.5% were reported as occurring in adult beds, 6.8% in cribs, 10.0% on sofas or couches,
and 1.1% in other places (n ⫽10, including car seats,
bean bags, playpens, and cars). No mention of sleep surface was made in 54.6% of all death certificates. Cosleeping or bed sharing was reported in 53.3% of the cases.
DISCUSSION
Infant mortality rates attributable to ASSB have quadru-pled in the last 2 decades, with the most dramatic in-crease occurring after 1996. Although the overall SUID rate showed no important increasing or decreasing trend from 1998 through 2004, the trend showed signs of a potential decline after 2003. The pattern observed for the other SUID-specific causes of death during this time did reveal an increasing trend for ASSB and cause un-known and a declining trend for SIDS. Death rates for
total SUID and each SUID-specific cause of death de-clined in 2003, with all but cause unknown increasing again in 2004. It is unknown whether this trend is significant, because this dip in rates seems anomalous. Only additional years of data will allow us to determine whether this represents a changing trend in SIDS and total SUID, or whether the dip in rates is because of unstable estimates.
With some promise of a declining total SUID rate form the latest years of data available, during 2001– 2004, the proportion of SUID deaths attributed to ASSB continued to increase, whereas the proportion of deaths attributable to SIDS remained stable and the proportion attributable to unknown cause declined. Black male in-fants are disproportionately affected by ASSB, and infant mortality attributable to ASSB is highest among infants 0 to 3 months of age; most cases occur at 1 month of age. ASSB deaths occurred more frequently in the earlier half of the week (Sunday through Wednesday) compared with the later half (Thursday through Saturday). Factors contributing to ASSB deaths could be determined in about two thirds of all ASSB cases; overlaying was the most frequently reported contributing factor. Cribs, adult beds, sofas, and other sleep surfaces were
impli-cated in ASSB infant deaths, but⬎50% of the cases did
report data about the sleep surface.
The impressive decline in SIDS during the 1990s has been credited to national efforts promoting a supine sleep position for infants.15,16Yet since 1998, safe-sleep TABLE 2 ASSB Percent Distributions According to Age at Death,
Month of Death, and Day of Death, United States, 2002–2004
Selected Characteristic
n %
Age at death, mo
0 200 14.7
1 334 24.6
2 276 20.4
3 179 13.2
4 104 7.7
5 81 6.0
6 45 3.3
7 56 4.1
8 32 2.4
9 23 1.7
10 12 0.9
11 14 1.0
Day of week at death
Sunday 144 10.6
Monday 454 33.5
Tuesday 152 11.2
Wednesday 348 25.7
Thursday 69 5.1
Friday 71 5.2
Saturday 116 8.6
Month of death
January 135 10.0
February 97 7.2
March 108 8.0
April 118 8.7
May 125 9.2
June 131 9.7
July 105 7.7
August 80 5.9
September 112 8.3
October 112 8.3
November 112 8.3
December 121 8.9
TABLE 3 Selected Characteristics Associated With ASSB Death According to Text From the Cause-of-Death Section of the Death Certificate (Causes of Death and the Description of How the Injury Occurred) as Entered by the Death Certificate Certifier, United States, 2003–2004
Characteristic n %
Mechanism attributable to suffocation
Overlay 315 33.8
Suffocation by bedding/soft materials on sleep surface
128 13.7
Wedging/entrapment between 2 objects (eg, bed, wall)
132 14.2
Face down or obstructed position 24 2.6 Other (car seat, strangulation) 4 0.4 Unknown/could not be determined 214 23.0
Pendinga 114 12.2
Sleep surface or place where death occurred
Bed 256 27.5
Crib 63 6.8
Sofa/couch/recliner 93 10.0
Other (bean bag, chair, car seat, playpen) 10 1.1 Unknown/could not be determined 397 42.6
Pending 112 12.0
Cosleeping/bed sharing reported
Yes 456 51.2
No 56 6.3
Unknown/could not be determined 266 29.9
Pending 113 12.7
aCause of death was still pending investigation when the NCHS statistical file was closed
prevention efforts may have had little effect in reducing total SUID deaths overall. Instead, the relatively stagnant total SUID rate together with the observation that de-clining SIDS rates are being offset by increasing ASSB and unknown cause rates suggests that the way these deaths are classified has changed. This change in classi-fication and reporting has been observed in recent stud-ies.1,8
One explanation for this diagnostic change may be stricter adherence to the 1991 SIDS definition,17ie,
un-explained deaths that lack a thorough case investigation cannot be classified as SIDS, and thus are classified as cause unknown. Also, the requirement of a thorough death-scene investigation for a SIDS diagnosis could have lead to more accurate cause-of-death classification and explain why the total SUID mortality rate has re-mained stagnant, whereas the proportion of ASSB and cause unknown deaths among total SUID deaths have been increasing and SIDS deaths have been decreasing. Similarly, the use of CDC’s 1996 death-scene
investiga-tion guidelines and SUIDIRF9by many jurisdictions may
explain why deaths are being classified as ASSB more often. However, CDC’s renewed efforts to teach and encourage the use of standard approaches for infant scene investigation predate this current analysis’s study period (see www.cdc.gov/SIDS/SUID.htm).
The increase in local and state child death teams that review SUID cases may also be contributing to improved understanding of SUID deaths. Child death review teams often request comprehensive death-scene investigation evidence in an effort to improve prevention efforts and some can influence cause-of-death classification.18 It is
also possible that changes in classification may reflect diagnostic preferences of certifiers.3,8 Guidance about
classifying SUID deaths, although offering different per-spectives, have recently been published.19,20
This study has several strengths. To our knowledge, it is the first study to document the national trend showing a fourfold increase in ASSB infant mortality in recent years. In addition, the analysis examines all infant mor-tality, not just postneonatal mormor-tality, an important fac-tor because 15% of all ASSB deaths occur during the first month of life. Additional study strengths include its US population base and the many years of data available for analysis.
The study also has some limitations. First, because we relied on death certificate data, cause-of-death reporting practices may be inconsistent between medical certifiers. Second, we were limited to the variables recorded on the death certificate and did not have more detailed data such as investigation reporting forms and autopsy re-ports.
In respect to the subanalysis of the written textual information on the death certificate, observations pro-vided some insight about the circumstances contributing to these deaths. Although this subanalysis is an impor-tant strength, we were limited by incomplete textual information for nearly half of the cases and lack of knowledge about certifier reporting practices. Some of the incomplete information resulted from cases where
the text indicated that a cause of death was still pending investigation when the NCHS statistical file was closed. Finally, because ours is a descriptive study, there is no comparison group, and we do not assess risk factors related to ASSB. A national SUID surveillance system that captures standardized and consistent information from the death-scene investigation and autopsy would provide valuable information for future studies and could better inform prevention activities. Having com-plete data from infant death-scene investigations not only is critical for accurate and consistent classification of cause of death, but also importantly informs our under-standing about the circumstances in which ASSB and other SUID deaths occur.
CONCLUSIONS
Infant mortality rates attributable to ASSB have quadru-pled in the last 2 decades, with the most dramatic in-crease in rates occurring after 1996. The reason for the
increase is unknown, but black male infants⬍4 months
of age are disproportionately affected. Prevention efforts should target those at highest risk and focus on helping caregivers provide safer sleep environments. Increased and understanding of the specific circumstances of sleep environments associated with ASSB deaths may help researchers determine why recent safe-sleep promotion efforts have resulted in a reduction in SIDS, but not ASSB deaths.
REFERENCES
1. Shapiro-Mendoza CK, Tomashek KM, Anderson RN, Wingo J. Recent national trends in sudden, unexpected infant deaths: more evidence supporting a change in classification or report-ing.Am J Epidemiol.2006;163(8):762–769
2. Bass M, Kravath RE, Glass L. Death-scene investigation in sudden infant death.N Engl J Med.1986;315(2):100 –105 3. Hanzlick R. Death scene investigation. In: Byard RW, Krous
HF, eds.Sudden Infant Death Syndrome: Problems, Progress and Possibilities. London, United Kingdom: Arnold; 2001:58 – 65 4. Tomashek KM, Hsia J, Iasi S. Trends in postneonatal mortality
attributable to injury, United States, 1988 –1998. Pediatrics.
2003;111(5 pt 2):1219 –1225
5. Drago DA, Dannenberg AL. Infant mechanical suffocation deaths in the United States, 1980 –1997. Pediatrics. 1999; 103(5). Available at: www.pediatrics.org/cgi/content/full/103/ 5/e59
6. Overpeck MD, Brenner RA, Cosgrove C, Trumble AC, Kochanek K, MacDorman M. National underascertainment of sudden unexpected infant deaths associated with deaths of unknown cause.Pediatrics.2002;109(2):274 –283
7. Malloy MH. Trends in postneonatal aspiration deaths and re-classification of sudden infant death syndrome: impact of the “Back to Sleep” program.Pediatrics.2002;109(4):661– 665 8. Malloy MH, MacDorman M. Changes in the classification of
sudden unexpected infant deaths: United States 1992–2001.
Pediatrics.2005;115(5):1247–1253
9. Centers for Disease Control and Prevention. Guidelines for death scene investigation of sudden, unexplained infant deaths: recommendations of the Interagency Panel on Sudden Infant Death Syndrome.MMWR Morb Mortal Wkly Rep.1996; 45:1–22
11. World Health Organization.International Statistical Classification of Diseases and Related Health Problems. 10th rev ed. Geneva, Switzerland: World Health Organization; 1992
12. World Health Organization.Manual of the International Statistical Classification of Diseases, Injuries, and Causes of Death, Based on the Recommendations of the Ninth Revision Conference, 1975. Geneva, Switzerland: World Health Organization; 2007
13. Anderson RN, Minin˜o AM, Hoyert DL, Rosenberg HM. Com-parability of cause of death between ICD-9 and ICD-10: Pre-liminary estimates.Natl Vital Stat Rep.2001;49(2):1–32 14. Rosenberg HM, Maurer JD, Sorlie PD, et al. Quality of death
rates by race and Hispanic origin: a summary of current re-search, 1999.Vital Health Stat 2.1999;(128):1–13
15. American Academy of Pediatrics, Task Force on Infant Posi-tioning and SIDS. PosiPosi-tioning and Sudden Infant Death Syn-drome (SIDS).Pediatrics.1992;89(6 pt 1):1120 –1126 16. Willinger M, Hoffman HJ, Wu KT, et al. Factors associated with
the transition to nonprone sleep positions of infants in the United States: the National Infant Sleep Position Study.JAMA.
1998;280(4):329 –335
17. Willinger M, James LS, Catz C. Defining the sudden infant death syndrome (SIDS): deliberations of an expert panel con-vened by the National Institute of Child Health and Human Development.Pediatr Pathol.1991;11(5):677– 684
18. Krous HF, Beckwith JB, Byard RW, et al. Sudden infant death syndrome and unclassified sudden infant deaths: a definitional and diagnostic approach.Pediatrics.2004;114(1):234 –238 19. Corey TS, Hanzlick R, Howard J, Nelson C, Krous H. A
func-tional approach to sudden unexplained infant deaths. Am J Forensic Med Pathol.2007;28(3):271–277
20. Hargrove T, Bowman L. Thousands of babies die of preventable suffocation each year. Scripps Howard News Service, 2007. Available at: http://scrippsnews.s10113.gridserver.com/node/ 550. Accessed December 8, 2008
TEXTING SHOWS RECOVERY AFTER FAINT
“Festival Medical Services . . . provides music festivals throughout the United Kingdom with doctors, nurses, paramedics, first aiders, and other trained medical and administrative staff. This team provides a resuscitation facility for the audience at the 2 main stages at Glastonbury and Reading festivals as well as a triage system to sort or treat people who need medical attention. Three years ago we noticed that most of the patients with faint or panic attack were teenagers and as soon as they could they used their mobile phones to send an SMS (short message service) text message to their friends. SMS allows the interchange of short text messages between mobile phones. About 1.4 billion text messages are sent in the UK alone every week, according to the Mobile Data Association (www.text.it). The ability to text, whether or not it actually makes sense, requires a Glasgow coma scale score of 15 (fully conscious), an adequately functioning ‘executive system’ in the frontal lobes, and a high degree of manual dexterity and psychomotor coordination. It also shows a degree of common sense not always evident in teenagers. Two years ago we decided to use this texting sign as an indication that patients had recovered from their faint or panic attack and were orientated and coordinated enough to be discharged back to the festival. At times of massive influx to the medical tent, when up to 2 patients a minute are triaged, this system seems to work well. The texting sign needs further investigation to determine whether it is a valid criterion for recovery after faint or panic attack at festivals as well as in busy accident and emergency departments.”
DOI: 10.1542/peds.2007-3746
2009;123;533
Pediatrics
Anderson and Sarah Blanding
Carrie K. Shapiro-Mendoza, Melissa Kimball, Kay M. Tomashek, Robert N.
Strangulation in Bed From 1984 Through 2004: Are Rates Increasing?
US Infant Mortality Trends Attributable to Accidental Suffocation and
Services
Updated Information &
http://pediatrics.aappublications.org/content/123/2/533
including high resolution figures, can be found at:
References
http://pediatrics.aappublications.org/content/123/2/533#BIBL
This article cites 14 articles, 5 of which you can access for free at:
Subspecialty Collections
http://www.aappublications.org/cgi/collection/safety_sub
Safety
_management_sub
http://www.aappublications.org/cgi/collection/administration:practice
Administration/Practice Management
following collection(s):
This article, along with others on similar topics, appears in the
Permissions & Licensing
http://www.aappublications.org/site/misc/Permissions.xhtml
in its entirety can be found online at:
Information about reproducing this article in parts (figures, tables) or
Reprints
http://www.aappublications.org/site/misc/reprints.xhtml
DOI: 10.1542/peds.2007-3746
2009;123;533
Pediatrics
Anderson and Sarah Blanding
Carrie K. Shapiro-Mendoza, Melissa Kimball, Kay M. Tomashek, Robert N.
Strangulation in Bed From 1984 Through 2004: Are Rates Increasing?
US Infant Mortality Trends Attributable to Accidental Suffocation and
http://pediatrics.aappublications.org/content/123/2/533
located on the World Wide Web at:
The online version of this article, along with updated information and services, is
by the American Academy of Pediatrics. All rights reserved. Print ISSN: 1073-0397.