A Trigger Tool to Detect Harm in
Pediatric Inpatient Settings
David C. Stockwell, MD, MBAa,b, Hema Bisarya, MHSA, RDc, David C. Classen, MD, MSd,e, Eric S. Kirkendall, MD, MBIf,g, Christopher P. Landrigan, MD, MPHh,i,j, Valere Lemon, RN, MBAk, Eric Tham, MD, MSl,m, Daniel Hyman, MD, MMMl,n,
Samuel M. Lehman, MDo, Elizabeth Searles, RN, MBAp, Matt Hall, PhDq, Stephen E. Muething, MDg, Mark A. Schuster, MD, PhDh,j, Paul J. Sharek, MD, MPHr,s
abstract
OBJECTIVES:An efficient and reliable process for measuring harm due to medical care is neededto advance pediatric patient safety. Several pediatric studies have assessed the use of trigger tools in varying inpatient environments. Using the Institute for Healthcare Improvement’s adult-focused Global Trigger Tool as a model, we developed and pilot tested a trigger tool that would identify the most common causes of harm in pediatric inpatient environments.
METHODS:After formal training, 6 academic children’s hospitals used this novel pediatric trigger tool to review 100 randomly selected inpatient records per site from patients discharged during the month of February 2012.
RESULTS:From the 600 patient charts evaluated, 240 harmful events (“harms”) were identified,
resulting in a rate of 40 harms per 100 patients admitted and 54.9 harms per 1000 patient days across the 6 hospitals. At least 1 harm was identified in 146 patients (24.3% of patients). Of the 240 total events, 108 (45.0%) were assessed to have been potentially or definitely preventable. The most common patient harms were intravenous catheter infiltrations/burns, respiratory distress, constipation, pain, and surgical complications.
CONCLUSIONS:Consistent with earlier rates of all-cause harm in adult hospitals, harm occurs at
high rates in hospitalized children. Availability and use of an all-cause harm identification tool will establish the epidemiology of harm and will provide a consistent approach to assessing the effect of interventions on harms in hospitalized children.
WHAT’S KNOWN ON THIS SUBJECT:Harm occurs at a high rate in adult inpatient populations. One single-center study, applying an adult-based surveillance tool, suggests that a pediatric inpatient population also has a high rate of harm.
WHAT THIS STUDY ADDS:Harm occurred frequently in 6 freestanding children’s hospitals. Identification and understanding of the harm is thefirst step to making necessary improvements and to preventing future harm.
Despite the increased attention paid to patient safety over the past 15 years since the publication of“To Err Is Human,”harm rates for
hospitalized patients remain high.1,2
Advanced harm detection techniques suggest that national rates of harm resulting in death among hospitalized patients are.4 times higher than originally reported. These rates suggest that almost half a million people die in the United States per year as a result of hospital-associated harm.3This estimate would place
patient harm as the third leading overall cause of death behind heart disease and cancer.4
Consistent and accurate detection of patient harm remains a challenge for most organizations. Although voluntary reports have been shown to capture only 2% to 8% of all harms, they remain the mainstay of harm detection in most hospitals.5The
Institute of Healthcare Improvement (IHI) noted recently that“public health researchers have established that only 10 to 20 percent of errors are ever reported and, of those, 90 to 95 percent cause no harm to patients.”6Noting this gap, efforts to
improve harm detection have accelerated, with the most visible perhaps being the development, testing, and dissemination of the adult-focused IHI Global Trigger Tool (GTT). A“trigger”is a medical record-based“hint”(such as the use of the antidote naloxone) that“triggers”the search of the medical record to determine whether an adverse event (such as a clinical overdose of an opiate, as opposed to a therapeutic use in response to a nonprescribed opiate use) might have occurred. The GTT, which includes 55 such triggers, has been used in such settings as the North Carolina Patient Safety Study, the Office of the Inspector General of the Centers for Medicare and Medicaid Services report on
inpatient harm, and the Office of the Inspector General work in skilled nursing facilities.2,6–11These efforts
have reinforced the perspective that
the trigger tool approach is at present the most reliable and consistent harm detection method.3,7,10
Although the IHI GTT was designed for the adult population, 1 children’s hospital tested it on its pediatric inpatient records and identified
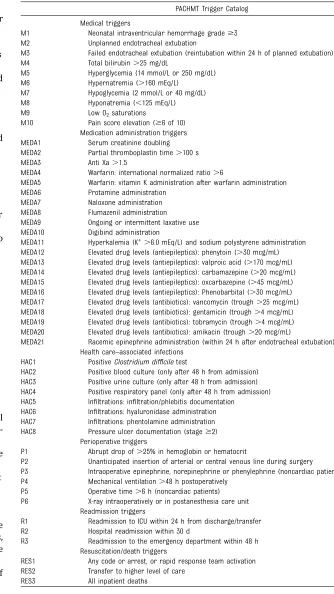
TABLE 1 PACHMT
PACHMT Trigger Catalog
Medical triggers
M1 Neonatal intraventricular hemorrhage grade$3 M2 Unplanned endotracheal extubation
M3 Failed endotracheal extubation (reintubation within 24 h of planned extubation) M4 Total bilirubin.25 mg/dL
M5 Hyperglycemia (14 mmol/L or 250 mg/dL) M6 Hypernatremia (.160 mEq/L)
M7 Hypoglycemia (2 mmol/L or 40 mg/dL) M8 Hyponatremia (,125 mEq/L) M9 Low O2saturations
M10 Pain score elevation ($6 of 10) Medication administration triggers MEDA1 Serum creatinine doubling MEDA2 Partial thromboplastin time.100 s MEDA3 Anti Xa.1.5
MEDA4 Warfarin: international normalized ratio.6
MEDA5 Warfarin: vitamin K administration after warfarin administration MEDA6 Protamine administration
MEDA7 Naloxone administration MEDA8 Flumazenil administration MEDA9 Ongoing or intermittent laxative use MEDA10 Digibind administration
MEDA11 Hyperkalemia (K+.6.0 mEq/L) and sodium polystyrene administration MEDA12 Elevated drug levels (antiepileptics): phenytoin (.30 mcg/mL) MEDA13 Elevated drug levels (antiepileptics): valproic acid (.170 mcg/mL) MEDA14 Elevated drug levels (antiepileptics): carbamazepine (.20 mcg/mL) MEDA15 Elevated drug levels (antiepileptics): oxcarbazepine (.45 mcg/mL) MEDA16 Elevated drug levels (antiepileptics): Phenobarbital (.30 mcg/mL) MEDA17 Elevated drug levels (antibiotics): vancomycin (trough.25 mcg/mL) MEDA18 Elevated drug levels (antibiotics): gentamicin (trough.4 mcg/mL) MEDA19 Elevated drug levels (antibiotics): tobramycin (trough.4 mcg/mL) MEDA20 Elevated drug levels (antibiotics): amikacin (trough.20 mcg/mL)
MEDA21 Racemic epinephrine administration (within 24 h after endotracheal extubation) Health care–associated infections
HAC1 PositiveClostridium difficiletest
HAC2 Positive blood culture (only after 48 h from admission) HAC3 Positive urine culture (only after 48 h from admission) HAC4 Positive respiratory panel (only after 48 h from admission) HAC5 Infiltrations: infiltration/phlebitis documentation
HAC6 Infiltrations: hyaluronidase administration HAC7 Infiltrations: phentolamine administration HAC8 Pressure ulcer documentation (stage$2)
Perioperative triggers
P1 Abrupt drop of.25% in hemoglobin or hematocrit
P2 Unanticipated insertion of arterial or central venous line during surgery P3 Intraoperative epinephrine, norepinephrine or phenylephrine (noncardiac patients) P4 Mechanical ventilation.48 h postoperatively
P5 Operative time.6 h (noncardiac patients) P6 X-ray intraoperatively or in postanesthesia care unit
Readmission triggers
R1 Readmission to ICU within 24 h from discharge/transfer R2 Hospital readmission within 30 d
R3 Readmission to the emergency department within 48 h Resuscitation/death triggers
RES1 Any code or arrest, or rapid response team activation RES2 Transfer to higher level of care
patient harm in more than one-third of admissions.12In addition, there
have been ongoing efforts to develop trigger tools tailored for pediatric settings. These have included trigger tools for discrete settings (eg, the NICU, PICU, and general pediatric non–intensive care inpatient environment) and specific types of harms (eg, adverse drug events). Such applications of focused trigger tools have identified dramatically higher rates of harm compared with voluntary reports of safety events.13–17However, a single,
pediatric-specific detection tool that can be applied across all settings, analogous to the IHI’s GTT, has not been available. Until a comprehensive standard harm measure is established in pediatrics, improvement efforts will continue to focus on a fraction of the harm that occurs to patients, leaving countless harms within the system unrecognized and
unaddressed.18
Recently, a comprehensive pediatric trigger list for the inpatient
environment using a modified Delphi technique was developed. The tool was modeled after the IHI GTT and named the Pediatric All-Cause Harm Measurement Tool (PACHMT).19 Of note, the PACHMT
was developed anticipating future automation to allow integration into electronic health records. Using the PACHMT, we sought to pilot test the
tool to estimate harm rates across 6 children’s hospitals and to ensure the feasibility and appropriateness of the tool as a way to estimate the rates of all-cause harm in
hospitalized children. Although no tool can consistently identify all causes of harm, the PACHMT was designed to identify many of the most common causes of pediatric harm able to be recognized through trigger methodology.
METHODS
Design, Setting, and Patients
As has been done in previous trigger tool studies, we used a cross-sectional study design, using retrospective chart review in 6 academic
freestanding children’s hospitals with previous trigger tool experience from different regions of the country. Patient records were eligible for inpatients who were,22 years of age, had a length of stay between 24 hours and 6 months, and were discharged in February 2012.20Any
patients who were admitted for rehabilitation, to the normal newborn nursery, to day treatment areas, or with a primary discharge diagnosis related to psychiatric or obstetric care were excluded as is consistent with earlier study designs.12–17A
random sample of 100 patients who met the inclusion criteria was selected from each site for review. Institutional review board waiver or approval for this study was granted at each site.
Intervention
The list of pediatric-specific triggers from the PACHMT was created via a modified Delphi process described previously.19The
PACHMT trigger list (Table 1), an
instruction manual containing detailed definitions of triggers, a list of likely associated predefined harm events and case examples, and data collection forms were distributed to each hospital. Each site identified at least 1 nonphysician clinical reviewer, either a nurse or pharmacist, as well as 1 physician reviewer. All clinical reviewers and physician reviewers from each site completed standard training on trigger tool chart review methods incorporating the PACHMT and based on previous work by the Children’s Hospital Association and IHI.6,13,14,17Training was taught by
IHI GTT expert educators and consisted of 3 interactive
educational webinars. During these sessions, these experts described trigger detection, introduced the PACHMT trigger list, presented the process for the standard application of the tool, reviewed examples, and facilitated active dialogue. The site reviewers independently completed standard case studies for detecting triggers, harm identification, and harm classification that were reviewed during training sessions. Calibration exercises, such as extensive case reviews and group review of event and harm
classifications, during training assisted in promoting consistency in the use of the tool and study definitions.
The reviewer-physician team at each site then applied the standard trigger tool review method to review their 100 charts. There were no limits placed on the review time per chart. Once a trigger was identified, the reviewer would determine if there was harm. Harm was defined as an
“unintended physical injury (resulting from or contributed to) by medical
TABLE 3 Patient Lengths of Stay and Age
Characteristic Mean (95% CI) Median [IQR]
Length of stay (d) 7.3 (6.2–8.3) 4 (3–7) Length of stay when.30 d (n= 16, 2.7% of total) 68.8 (46.7–90.8) 55.5 (39.5–76) Patient age (y) 6.2 (5.7–6.7) 4 (0.5–12.0) TABLE 2 Harm Classification of Harms Using
the NCC MERP (Categories E–I)
Category E Contributed to or resulted in temporary harm to the patient and required intervention
Category F Contributed to or resulted in temporary harm to the patient and required initial or prolonged hospitalization Category G Contributed to or resulted in
permanent patient harm Category H Required intervention to
sustain life
Category I Contributed to or resulted in the patient’s death
care that required additional monitoring, treatment, or
hospitalization, or that resulted in death.”7This definition is consistent
with the Centers for Medicare and Medicaid Services, Office of the Inspector General, and the Agency for Healthcare Research and Quality’s definition of harm.7,11,21Once harm
was identified, its level of severity was assigned on the basis of the National Coordination Council for Medication Error Reporting and Prevention classification approach (Table 2).22
After harm identification and classification, reviewers were asked
to assign a level of preventability or nonpreventability. Each harm was assigned as“definitely preventable,”
“probably preventable,” “probably not preventable,”or“definitely not preventable.”Preventable events were defined as“events where definite breach of standard professional behavior or technique was identified; necessary precautions were not taken; event was
preventable by modification of behavior, technique or care.”2All
other harms were considered not preventable.
After the reviewer’s assessment of a chart and PACHMT trigger application, physician reviewers reviewed a summary of the harm and either confirmed or modified the primary reviewer’s assessment. The physician reviewer’s assessment and scoring of the case was considered
final.
Outcomes
The primary outcomes of this study were harms per patient and harms per 1000 patient days. Secondary outcomes of interest were (1) triggers per patient,(2) trigger-positive predictive values (defined as the number of times a specific trigger independently identified harm divided by the number of times a trigger was identified) individually and for PACHMT in total,(3) harm severity,(4) percentage of harms that were preventable, percentage of harms that were also identified in local occurrence reports, and median time for chart review.
Statistical Analysis
Patient characteristics were described with means and 95% confidence intervals (CIs), as well as medians with interquartile ranges (IQRs). We summarized harms with frequencies and percentages, and computed rates with 95% Poisson CIs. Finally, for each trigger, we report positive predictive values with exact binomial 95% confidence intervals (CI). All analyses were performed with SAS v.9.3 (SAS, Cary, NC), and
P,.05 were considered statistically significant.
RESULTS
The median age of patients whose chart was in the study was 4 years (IQR: 0.5–12.0), and 287 (47.8%) were female. The median length of stay was 4 days (IQR: 3–7), and 2.7% of patients had a length of stay.30 days (Table 3).
There were 1093 triggers detected resulting in identification of 204 (85.0%) of the total harms identified. The remaining 36 harms were identified during the chart review process but were not linked to any specific trigger. The positive predictive value of the aggregate PACHMT trigger list was 22.0% (95% CI: 19.0–25.1).
A total of 240 harms were identified from the 600 total patient records reviewed resulting in a rate of 40 harms per 100 patients admitted (95% CI: 35.2–45.4) and 54.9 harms per 1000 patient days (95% CI: 48.3–62.3). At least 1 harm was
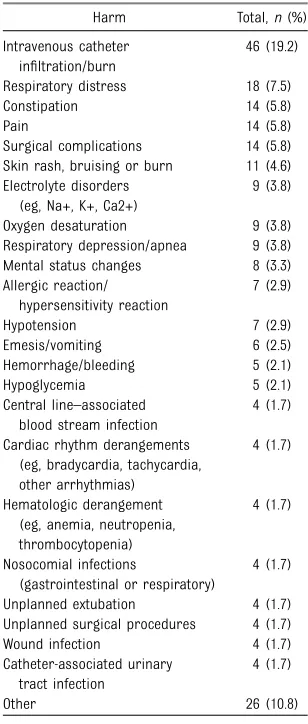
TABLE 4 Harms by Frequency (N= 240)
Harm Total,n(%) Intravenous catheter
infiltration/burn
46 (19.2)
Respiratory distress 18 (7.5) Constipation 14 (5.8)
Pain 14 (5.8)
Surgical complications 14 (5.8) Skin rash, bruising or burn 11 (4.6) Electrolyte disorders
(eg, Na+, K+, Ca2+)
9 (3.8)
Oxygen desaturation 9 (3.8) Respiratory depression/apnea 9 (3.8) Mental status changes 8 (3.3) Allergic reaction/
hypersensitivity reaction
7 (2.9)
Hypotension 7 (2.9) Emesis/vomiting 6 (2.5) Hemorrhage/bleeding 5 (2.1) Hypoglycemia 5 (2.1) Central line–associated
blood stream infection
4 (1.7)
Cardiac rhythm derangements (eg, bradycardia, tachycardia, other arrhythmias)
4 (1.7)
Hematologic derangement (eg, anemia, neutropenia, thrombocytopenia)
4 (1.7)
Nosocomial infections
(gastrointestinal or respiratory)
4 (1.7)
Unplanned extubation 4 (1.7) Unplanned surgical procedures 4 (1.7) Wound infection 4 (1.7) Catheter-associated urinary
tract infection
4 (1.7)
Other 26 (10.8)
“Other”includes the following: diarrhea (n= 3);
hyper-thermia/fever (n = 3); intubation
complications/post-extubation stridor (n = 3); cardiac arrest (n = 2);
decubitus ulcers (n= 2); dehydration (n= 2);
gastroin-testinal bleed (n= 2); insulin use complication or misuse
(n= 2); iatrogenic renal injury, renal failure, renal
dys-function (n= 2); other (n= 2); death (n= 1); seizures
(n= 1); and weakness/loss of strength (n= 1).
TABLE 5 Harm Count and Percent of Total Harms by Harm and Preventability
NCC MERP Harm Category
Total Harms by Category,
n(%)
Definitely Preventable,
n(%)
Probably Preventable,
n(%)
Definitely Not Preventable,
n(%)
Probably Not Preventable,
n(%) E 165 (68.5) 26 (10.8) 46 (19.2) 14 (5.8) 79 (32.9) F 49 (20.4) 8 (3.3) 19 (7.9) 3 (1.3) 19 (7.9)
G 1 (0.4) 1 (0.4) 0 0 0
H 24 (10.0) 3 (1.3) 5 (2.1) 6 (2.5) 10 (4.2)
I 1 (0.4) 0 0 1 (0.4) 0
Totals 240 38 (15.8) 70 (21.2) 24 (10.0) 108 (45.0)
identified in 146 patients; thus, 24.3% of all patients experienced$1 harms. Fifty-one patients (8.5% of the total) had multiple harms. One hundred and eight harms (45.0%) were documented as either probably preventable or definitely
preventable.
The mean time for chart review was 42 minutes with a median of 30 minutes (IQR: 15.5–60.0). Of the 240 harms identified, 22 (9.2%) of these were also identified within the hospital’s voluntary reporting system.
The most common harms were intravenous catheter infiltrations/ burns, respiratory distress, constipation, pain, surgical
complications and skin rash, bruising, or burn. A complete listing of the harms experienced is included in Table 4. Sixty-eight percent of the harms documented were rated as level E on the National Coordination Council for Medication Error
Reporting and Prevention harm scale. Table 5 categorizes the identified harms by severity level and preventability as determined by the reviewers.
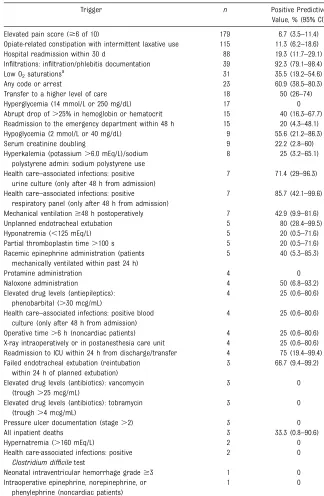
Thirty-six (70.6%) of the PACHMT triggers were identified at least once during the chart review. Table 6 lists the triggers in order of frequency and lists each trigger’s positive predictive value.
DISCUSSION
Using a novel pediatric-specific list of triggers, we found 40 harms per 100 admissions among children hospitalized at 6 large children’s hospitals. Consistent with earlier trigger-based harm detection studies, nearly one half of the harm was deemed preventable.2,13,14One
of every 4 pediatric admissions in our study had at least 1 identified harm. Our detected harm rate is similar to a recent single-site study, which detected a pediatric harm rate of 37 harm events for every 100 admissions using the
adult-focused IHI GTT.12This is thefirst
multisite study describing all-cause inpatient pediatric harm using a novel pediatric-specific global trigger tool.
Consistent with previous trigger tool efforts, harms were identified substantially more frequently with the PACHMT than with voluntary reporting. Nevertheless, we consider
TABLE 6 Triggers by Frequency, With Positive Predictive Value
Trigger n Positive Predictive
Value, % (95% CI)
Elevated pain score ($6 of 10) 179 6.7 (3.5–11.4) Opiate-related constipation with intermittent laxative use 115 11.3 (6.2–18.6) Hospital readmission within 30 d 88 19.3 (11.7–29.1) Infiltrations: infiltration/phlebitis documentation 39 92.3 (79.1–98.4) Low O2saturationsa 31 35.5 (19.2–54.6) Any code or arrest 23 60.9 (38.5–80.3) Transfer to a higher level of care 18 50 (26–74) Hyperglycemia (14 mmol/L or 250 mg/dL) 17 0 Abrupt drop of.25% in hemoglobin or hematocrit 15 40 (16.3–67.7) Readmission to the emergency department within 48 h 15 20 (4.3–48.1) Hypoglycemia (2 mmol/L or 40 mg/dL) 9 55.6 (21.2–86.3) Serum creatinine doubling 9 22.2 (2.8–60) Hyperkalemia (potassium.6.0 mEq/L)/sodium
polystyrene admin: sodium polystyrene use
8 25 (3.2–65.1)
Health care–associated infections: positive urine culture (only after 48 h from admission)
7 71.4 (29–96.3)
Health care–associated infections: positive
respiratory panel (only after 48 h from admission)
7 85.7 (42.1–99.6)
Mechanical ventilation$48 h postoperatively 7 42.9 (9.9–81.6) Unplanned endotracheal extubation 5 80 (28.4–99.5) Hyponatremia (,125 mEq/L) 5 20 (0.5–71.6) Partial thromboplastin time.100 s 5 20 (0.5–71.6) Racemic epinephrine administration (patients
mechanically ventilated within past 24 h)
5 40 (5.3–85.3)
Protamine administration 4 0
Naloxone administration 4 50 (6.8–93.2) Elevated drug levels (antiepileptics):
phenobarbital (.30 mcg/mL)
4 25 (0.6–80.6)
Health care–associated infections: positive blood culture (only after 48 h from admission)
4 25 (0.6–80.6)
Operative time.6 h (noncardiac patients) 4 25 (0.6–80.6) X-ray intraoperatively or in postanesthesia care unit 4 25 (0.6–80.6) Readmission to ICU within 24 h from discharge/transfer 4 75 (19.4–99.4) Failed endotracheal extubation (reintubation
within 24 h of planned extubation)
3 66.7 (9.4–99.2)
Elevated drug levels (antibiotics): vancomycin (trough.25 mcg/mL)
3 0
Elevated drug levels (antibiotics): tobramycin (trough.4 mcg/mL)
3 0
Pressure ulcer documentation (stage.2) 3 0 All inpatient deaths 3 33.3 (0.8–90.6)
Hypernatremia (.160 mEq/L) 2 0
Health care-associated infections: positive
Clostridium difficiletest
2 0
Neonatal intraventricular hemorrhage grade$3 1 0 Intraoperative epinephrine, norepinephrine, or
phenylephrine (noncardiac patients)
1 0
The following triggers were not identified during chart review: total bilirubin.25 mg/dL; Anti Xa.1.5; Warfarin triggers:
international normalized ratio.6; Warfarin triggers: vitamin k administration after warfarin,flumazenil administration,
Digibind administration; elevated drug levels (antiepileptics): phenytoin (.30 mcg/mL); elevated drug levels
(anti-epileptics): valproic acid (.170 mcg/mL); elevated drug levels (antiepileptics): carbamazepine (.20 mcg/mL); elevated
drug levels (antiepileptics): oxcarbazepine (.45 mcg/mL); elevated drug levels (antibiotics): gentamicin (trough.4 mcg/mL);
elevated drug levels (antibiotics): amikacin (trough.20 mcg/mL); infiltrations: hyaluronidase administration; infi
ltra-tions: phentolamine administration; unanticipated insertion of arterial or central venous line during surgery.
these 2 approaches to patient safety measurement to be complementary. Although a trigger tool’s systematic measurement captures substantially more harm events, voluntary reporting often provides information related to near miss events that are not detected by the trigger tool methodology. We believe
a combination of both approaches results in an enhanced
understanding of a system’s potential fallibilities.23
There are several limitations to this study. First, as a pilot, our study had a relatively small sample size and only 1 physician reviewer (rather than the more typical design of 2 physician reviewers) to assess and rate the harms. Second, like adult trigger tool studies,6,19 our study
lacked definitive evidence for which triggers were the best to include, and it does not capture all harms. In an effort to construct a parsimonious list of highly predictive triggers, several potential triggers such as
hypocalcemia or hypokalemia were not included in thefinal trigger tool. Third, we did not undertake inter- or intrarater reliability testing, so we do not yet know the reliability and consistency of this tool between alternative users. Finally, although this was a relatively large,
multicenter pilot study, larger studies are needed to better identify rare but clinically important harms, to define the operating characteristics of less common triggers, and to examine how trigger tools work in a more diverse set of hospitals. The federal Pediatric Quality Measures Program is developing such a measure at present, drawing on the work of PACHMT and other trigger tools.
CONCLUSIONS
The application of a novel pediatric global trigger tool identified 40 harms per 100 admissions in 6 freestanding children’s hospitals. Despite more than a decade of intense focus, harm continues to occur in large numbers in hospitalized children. The use of the PACHMT trigger tool will provide the foundation to capture harms in a rigorous and systematic way. Use of such trigger tools will lead to a better understanding of the epidemiology of harm in hospitalized children as well as allow tracking of change with patient-safety-focused interventions. Because this work was only intended to be a pilot study, future research should focus on editing the PACHMT to establish the next generation pediatric global trigger tool, conduct a formal study to establish harm rates
and epidemiology, and determine the operating characteristics of this tool, with an eye toward integration into the electronic medical record and eventual automation.
ACKNOWLEDGMENTS
The following participants and associated hospitals performed chart review and data collection, and we greatly appreciate their efforts: Boston Children’s Hospital:
Annemarie Fayemi, RN, MS, Shannon Cottreau, RN, BSN, CPN, Christopher Landrigan, MD, MPH; Children’s Hospital Central California: Dana Sankrit, BS, RN, Richard Sakai, PharmD, Kathleen Murphy, MD; Children’s Hospital Colorado: Megan Dix, RN, Viktor Lasmarias, RN, Eric Tham, MD; Children’s National Medical Center: Valere Lemon MBA, BSN, RN, David C. Stockwell, MD, MBA; Cincinnati Children’s Hospital Medical Center: Carol Frese, BSN, RN, Deborah Hacker, ASN, RN, Eric Kirkendall, MD, MBI; Lucile Packard Children’s Hospital: Krisa Hoyle Elgin, MPH, FNP-BC, Paul Sharek, MD, MPH. We also thank John Mallet, Child Health Corporation of America, for data collection form and database design and for database query and management.
Dr Schuster carried out local data collection and provided resources, assisted with interpretation of data, and reviewed and revised the manuscript; Dr Sharek co-conceptualized and designed the study and drafted and edited the initial manuscript; and all authors approved thefinal manuscript as submitted.
www.pediatrics.org/cgi/doi/10.1542/peds.2014-2152
DOI:10.1542/peds.2014-2152 Accepted for publication Feb 27, 2015
Address correspondence to David C. Stockwell, MD, MBA, Children’s National Medical Center, 111 Michigan Ave, NW, Suite M-4800, Washington, DC 20010. E-mail: [email protected]
PEDIATRICS (ISSN Numbers: Print, 0031-4005; Online, 1098-4275).
Copyright © 2015 by the American Academy of Pediatrics
FUNDING:This work was partially supported by the Children’s Hospital Association. Drs Landrigan and Schuster and data collection at Boston Children’s Hospital were supported by grant U18 HS020513. The views expressed in this article are those of the authors and do not necessarily represent the views of the US Department of Health and Human Services or the Agency for Healthcare Research and Quality.
POTENTIAL CONFLICT OF INTERESTS:Dr Stockwell reports partial employment by Pascal Metrics, a federally certified Patient Safety Organization. Dr Classen reports employment by Pascal Metrics, a federally certified Patient Safety Organization. Dr Landrigan reports having served as a paid expert witness in cases regarding patient safety and sleep deprivation. The other authors have indicated they have no potential conflicts of interest relevant to this article to disclose.
REFERENCES
1. Kohn LT, Corrigan JM, Donaldson MS, eds.To Err Is Human: Building a Safer Health System. Washington, DC: National Academies Press; 1999
2. Landrigan CP, Parry GJ, Bones CB, Hackbarth AD, Goldmann DA, Sharek PJ. Temporal trends in rates of patient harm resulting from medical care.N Engl J Med. 2010;363(22):2124–2134
3. James JTA. A new, evidence-based estimate of patient harms associated with hospital care.J Patient Saf. 2013; 9(3):122–128
4. Center for Disease Control and Prevention. FASTSTATs—Leading Causes of Death. Available at: http://www.cdc. gov/nchs/fastats/leading-causes-of-death.htm. Accessed January 5, 2015
5. Stockwell DC, Slonim AD. Quality and safety in the intensive care unit.J Intensive Care Med. 2006;21(4):199–210
6. Griffin FA, Resar RK.IHI Global Trigger Tool for Measuring Harms(IHI Innovation Series white paper). 2nd ed. Cambridge, MA: Institute for Healthcare Improvement; 2009. Available at http:// www.IHI.org
7. Office of the Inspector General.Adverse Events in Hospitals: Methods for Identifying Events(OEI-06-08-00221). Washington, DC: Department of Health and Human Services; 2010. Available at: http://www.oig.hhs.gov/oei/reports/oei-06-08-00221.pdf. Accessed January 5, 2015
8. Rozich JD, Haraden CR, Resar RK. Adverse drug event trigger tool: a practical methodology for measuring medication related harm.Qual Saf Health Care. 2003;12(3):194–200
9. Resar RK, Rozich JD, Classen D. Methodology and rationale for the measurement of harm with trigger tools.
Qual Saf Health Care. 2003;12(suppl 2): ii39–ii45
10. Classen DC, Resar R, Griffin F, et al. “Global trigger tool”shows that adverse events in hospitals may be ten times greater than previously measured.
Health Aff (Millwood). 2011;30(4): 581–589
11. Office of the Inspector General.Adverse Events in Skilled Nursing Facilities: National Incidence Among Medicare Beneficiaries(OEI-06-11-00370). Washington, DC: Department of Health and Human Services; 2014. Available at: http://oig.hhs.gov/oei/reports/oei-06-11-00370.pdf. Accessed January 5, 2015
12. Kirkendall ES, Kloppenborg E, Papp J, et al. Measuring adverse events and levels of harm in pediatric inpatients with the Global Trigger Tool.Pediatrics. 2012;130(5). Available at: www.pediatrics. org/cgi/content/full/130/5/130/5/e1206
13. Sharek PJ, Horbar JD, Mason W, et al. Adverse events in the neonatal intensive care unit: development, testing, and findings of an NICU-focused trigger tool to identify harm in North American NICUs.Pediatrics. 2006;118(4):1332–1340
14. Agarwal S, Classen D, Larsen G, et al. Prevalence of adverse events in pediatric intensive care units in the United States.Pediatr Crit Care Med. 2010;11(5):568–578
15. Larsen GY, Donaldson AE, Parker HB, Grant MJ. Preventable harm occurring to critically ill children.Pediatr Crit Care Med. 2007;8(4):331–336
16. Hooper AJ, Tibballs J. Comparison of a trigger tool and voluntary reporting to identify adverse events in a paediatric intensive care unit.Anaesth Intensive Care. 2014;42(2):199–206
17. Takata GS, Mason W, Taketomo C, Logsdon T, Sharek PJ. Development, testing, andfindings of a pediatric-focused trigger tool to identify
medication-related harm in US children’s hospitals.Pediatrics. 2008;121(4). Available at: www.pediatrics.org/cgi/ content/full/121/4/e927
18. Walsh KE, Bundy DG, Landrigan CP. Preventing health care-associated harm in children.JAMA. 2014;311(17): 1731–1732
19. Stockwell DC, Bisarya H, Classen DC, et al. Development of an electronic pediatric all-cause harm measurement tool using a modified Delphi method [published online ahead of print August 26, 2014].J Patient Safety. Available at: http://journals.lww.com/
journalpatientsafety/Abstract/ publishahead/Development_of_an_ Electronic_Pediatric_All_Cause.99719. aspx. Accessed January 5, 2015
20. American Academy of Pediatrics, Council on Child Health. Age limits of pediatrics.
Pediatrics. 1972;49(3):463
21. Hunt DR, Verzier N, Abend SL, et al. Fundamentals of medicare patient safety surveillance: intent, relevance, and transparency. In: Henriksen K, Battles JB, Marks ES, et al., eds.Advances in Patient Safety: From Research to
Implementation. Volume 2: Concepts and Methodology. Rockville, MD: Agency for Healthcare Research and Quality; 2005. Available at: http://www.ncbi.nlm.nih. gov/books/NBK20489. Accessed March 10, 2015
22. National Coordinating Council for Medication Error Reporting and Prevention. Types of Medication Errors. Available at: harm.nccmerp.org/ medErrorCatIndex.html Accessed January 5, 2015
DOI: 10.1542/peds.2014-2152 originally published online May 18, 2015;
2015;135;1036
Pediatrics
Sharek
Elizabeth Searles, Matt Hall, Stephen E. Muething, Mark A. Schuster and Paul J.
P. Landrigan, Valere Lemon, Eric Tham, Daniel Hyman, Samuel M. Lehman,
David C. Stockwell, Hema Bisarya, David C. Classen, Eric S. Kirkendall, Christopher
A Trigger Tool to Detect Harm in Pediatric Inpatient Settings
Services
Updated Information &
http://pediatrics.aappublications.org/content/135/6/1036
including high resolution figures, can be found at:
References
http://pediatrics.aappublications.org/content/135/6/1036#BIBL
This article cites 14 articles, 6 of which you can access for free at:
Subspecialty Collections
http://www.aappublications.org/cgi/collection/safety_sub Safety
sub
http://www.aappublications.org/cgi/collection/quality_improvement_ Quality Improvement
e_management_sub
http://www.aappublications.org/cgi/collection/administration:practic Administration/Practice Management
following collection(s):
This article, along with others on similar topics, appears in the
Permissions & Licensing
http://www.aappublications.org/site/misc/Permissions.xhtml
in its entirety can be found online at:
Information about reproducing this article in parts (figures, tables) or
Reprints
http://www.aappublications.org/site/misc/reprints.xhtml
DOI: 10.1542/peds.2014-2152 originally published online May 18, 2015;
2015;135;1036
Pediatrics
Sharek
Elizabeth Searles, Matt Hall, Stephen E. Muething, Mark A. Schuster and Paul J.
P. Landrigan, Valere Lemon, Eric Tham, Daniel Hyman, Samuel M. Lehman,
David C. Stockwell, Hema Bisarya, David C. Classen, Eric S. Kirkendall, Christopher
A Trigger Tool to Detect Harm in Pediatric Inpatient Settings
http://pediatrics.aappublications.org/content/135/6/1036
located on the World Wide Web at:
The online version of this article, along with updated information and services, is
by the American Academy of Pediatrics. All rights reserved. Print ISSN: 1073-0397.