Prevalence of Autism Spectrum Disorders in Hispanic
and Non-Hispanic White Children
WHAT’S KNOWN ON THIS SUBJECT: The number of individuals diagnosed with autism spectrum disorders (ASDs) continues to increase in the United States and other developed countries. Most prevalence estimates indicate that ASD is diagnosed less commonly in Hispanic individuals compared with non-Hispanic (NH) white populations.
WHAT THIS STUDY ADDS: Prevalence of ASD in Arizona’s population-based cohort is higher than reported previously. Prevalence in the Hispanic population and NH white population increased significantly over time, with a significant decrease in the gap between Hispanic and NH white prevalence.
abstract
OBJECTIVE: The number of individuals diagnosed with autism spec-trum disorders (ASDs) continues to increase in the United States and other developed countries; however, ASD is diagnosed less com-monly in Hispanic than in non-Hispanic white individuals. This report analyzes differences in ASD prevalence between Hispanic and non-Hispanic whites in a large, population-based sample of 8-year-old children, and explores how prevalence has changed over time.
METHODS: Population-based surveillance of ASD was conducted on 142 717 8-year-old children. Evaluation of clinical and educational records resulted in 1212 children meeting the case definition criteria in 4 study years between 2000 and 2006.
RESULTS:ASD prevalence in Hispanic children was lower than in non-Hispanic white children (P,.005) for all study years. More Hispanic than non-Hispanic white children met the case definition for intellectual disability (P , .05) in study years 2004 and 2006. Prevalence of ASD diagnosis increased in both groups; the Hispanic prevalence almost tripled, from 2.7 per 1000 in 2000 to 7.9 per 1000 in 2006. A comparison of prevalence ratios found that Hispanic and non-Hispanic white ASD prevalence became significantly more similar from 2000 to 2006 (x2= 124.89,P,.001).
CONCLUSIONS: The ASD prevalence for Hispanic individuals in this population-based sample is substantially higher than previously reported. Nonetheless, Hispanic children continue to have a significantly lower ASD prevalence in comparison with non-Hispanic whites. The prevalence of ASD is increasing in both populations, and results indicate that the gap in prevalence between groups is decreasing.Pediatrics2012;129:e629–e635 AUTHORS:Anita Pedersen, PhD,aSydney Pettygrove, PhD,b
F. John Meaney, PhD,cKristen Mancilla, BA,cKathy
Gotschall, MS,cDaniel B. Kessler, MD,dTheresa A. Grebe,
MD,dand Christopher Cunniff, MDc
aDepartment of Psychology, Arizona State University, Tempe, Arizona;bCollege of Public Health, University of Arizona, Tucson, Arizona;cDepartment of Pediatrics, University of Arizona College of Medicine, Tucson, Arizona; anddSt. Joseph’s Hospital and Medical Center, Phoenix, Arizona
KEY WORDS
autism spectrum disorder, prevalence, Hispanic, surveillance
ABBREVIATIONS
ADDM—Autism and Developmental Disabilities Monitoring Net-work
ADDSP—Arizona Developmental Disabilities Surveillance Pro-gram
ASD—autism spectrum disorder CI—confidence interval ID—intellectual disability NH white—non-Hispanic white OR—odds ratio
Dr Pedersen made substantial contributions to conception and design, analysis and interpretation of data, and drafting the article, and approved thefinal version to be published; Drs Meaney and Cunniff made substantial contributions to conception and design, analysis and interpretation of data, acquisition of data, and drafting the article, and approved the
final version to be published; Dr Pettygrove made substantial contributions to conception and design, analysis and interpretation of data, acquisition of data, critical revision of the manuscript for important intellectual content, and approved the
final version to be published; Ms Mancilla and Gotschall made substantial contributions to acquisition of data, analysis and interpretation of data, critical revision of the manuscript for important intellectual content, and approved thefinal version to be published; Drs Kessler and Grebe made substantial contributions to acquisition of data, critical revision of the manuscript for important intellectual content, and approved the
final version to be published.
www.pediatrics.org/cgi/doi/10.1542/peds.2011-1145
doi:10.1542/peds.2011-1145
Accepted for publication Nov 17, 2011
Address correspondence to Christopher Cunniff, MD, Department of Pediatrics, University of Arizona, 1501 N. Cambell Ave, PO Box 245073, Tucson AZ 85724. E-mail: ccunniff@peds.arizona.edu
PEDIATRICS (ISSN Numbers: Print, 0031-4005; Online, 1098-4275).
Copyright © 2012 by the American Academy of Pediatrics
FINANCIAL DISCLOSURE:The authors have indicated they have nofinancial relationships relevant to this article to disclose.
FUNDING:Supported by the Centers for Disease Control and Prevention.
orders characterized by abnormalities in communication, social impairments, and unusual or stereotypical behaviors. ASDs have been the subject of in-creasing scrutiny over the past decade, because the number of children iden-tified as having an ASD has risen dra-matically.1–9However, recent studies of ASD prevalence have shown significant discrepancies between the prevalence of ASD in different ethnic and racial groups.1–3 In particular, ASD preva-lence in Hispanic populations appears lower than ASD prevalence in the non-Hispanic white population.10–13 This difference may reflect a population difference in ASD prevalence between non-Hispanic white (NH white) and Hispanic groups as a result of genetic and environmental risk factors. Alter-natively, it may be explained by socio-economic issues, differing health behaviors, or other unknown factors that impede our ability to identify ASD prevalence accurately.
The Arizona Developmental Disabil-ities Surveillance Program (ADDSP) is a population-based surveillance system for ASD and intellectual disabilities that utilizes data from 15 school districts and clinical sources in Maricopa County, Arizona, the most populous county in Arizona, with∼100 000 annual births. ADDSP activities are conducted in con-junction with the Autism and Develop-mental Disabilities Monitoring Network (ADDM), a multisite network funded by the Centers for Disease Control and Prevention that uses a standardized protocol for ASD identification.14 Prev-alence estimates of the ADDM network have been published for children age 8 in 2000, 2002, 2004, and 2006.1–3 The purpose of this report is to use data from the ADDSP to investigate differ-ences in ASD prevalence between His-panic and NH white 8-year-old children and to explore time trends in prevalence
fi
tion of ASD in clinical and educational settings, and for future investigations of modifiable risk factors for ASD in both NH white and Hispanic pop-ulations.
METHODS
The ADDM surveillance system ascer-tains ASD among 8-year-old children through systematic review of clinical and educational records. Methods are modeled after the Centers for Disease Control and Prevention’s Metropolitan Atlanta Developmental Disabilities Sur-veillance Program, and have been de-scribed in detail.14 In brief, the ADDM protocol involves clinical and educa-tional record abstraction and expert clinician review. Educational records of children who are 8 years old in the appropriate study year (2000, 2002, 2004, or 2006) and receive special ed-ucational services are reviewed. Clini-cal records of all children born in the appropriate study year, who received clinical services before the end of that study year, and whose record cites 1 or more of an extensive list of Interna-tional Classification of Diseases, Ninth Revisiondiagnostic codes are also re-viewed. Educational or clinical records that document a previous ASD diag-nosis, results of tests commonly used to diagnose or evaluate ASD, or any of 34 key behaviors typical for ASD are abstracted. Data from all sources are deidentified and examined by a spe-cially trained clinician reviewer to de-termine whether the child meets ASD case definition. Abstraction of varia-bles related to intellectual disability (ID) was also performed for all children whose cases were abstracted for ASD, although clinician review for ID did not occur in 2000. The surveillance pop-ulation for the 2004 study year was smaller than the other study years and was completed by only a subset of
Coding of Race and Ethnicity
Race and ethnicity were coded during abstraction of records at school or clinical sources. In a minor modification of guidelines by the Office of Manage-ment and Budget, children were clas-sified as white, non-Hispanic; black, non-Hispanic; Hispanic, any race; American Indian or Alaska Native, non-Hispanic; Asian or Pacific Islander, Hispanic; and Other or mixed race, non-Hispanic.15 Child race and ethnicity were coded according to official docu-ments in the child’s record (such as an Individualized Education Plan or intake forms). If official sources within the record noted discrepant races, but each source noted the ethnicity as Hispanic, the child was coded as His-panic. However, if sources within the record did not agree as to the race, and the child was not identified as Hispanic, the child’s race and ethnicity was coded as “discrepant”. Where available, Ari-zona birth certificate information was obtained in cases of missing or dis-crepant race or ethnicity in the child’s record. If either parent was listed as Hispanic on the birth certificate, the child was coded as Hispanic. A child was coded as white only if both parents were listed as white and non-Hispanic.
Data Analysis Plan
obtained with Epi Info version 3.5.1. Epi Info was also used to evaluate the trends in prevalence over time by using thex2test for trend over time and the Mantel-Haenszel x2 test,16 both tests that can be used to evaluate a linear increase in prevalence.6 ASD preva-lence for the NH white and Hispanic populations was compared for the whole population, as well as separately for boys and girls, and changes in prevalence ratios were examined by using the Mantel-Haenszelx2test.
RESULTS
As seen in Table 1, the total number of 8-year-old children residing in the study area for all study years (2000, 2002, 2004, 2006) was 142 717. Of those chil-dren, 75 545 (52.9%) were NH white children, and 52 753 (37.0%) were His-panic children. The study area pop-ulation has a higher percentage of Hispanics than the overall population of Arizona: in the 2000 census, NH whites made up 63.8% of the pop-ulation and Hispanics made up 25.2%, with a smaller representation of other ethnic groups such as African Ameri-cans and Asian AmeriAmeri-cans.17
Overall, 2.4% of cases had missing or discrepant race information. Because these cases represented a small per-centage of total ASD cases, their impact on prevalence estimates was negligible. Among children living in the catchment area from 2000 to 2006, 1212 met ASD case definition as determined by the ADDM protocol.
Characteristics of the Hispanic and NH white children who met ASD case defi -nition are presented in Table 2 by study year. Among children who met criteria for ASD in all study years, both Hispanic and NH white samples showed a sig-nificantly greater number of boys than girls, with a boy-to-girl ratio among Hispanics ranging from 1.79 to 2.94, and a ratio among NH whites ranging from 3.80 to 5.72. Across all study years the
boy-to-girl ratio was more pronounced in the NH white population than in the Hispanic population. Among children who met the ASD case definition and whose records were also reviewed to ascertain case definition for ID (a
subset of the total ASD population), a similar proportion of Hispanic and NH white children met the case defi ni-tion for a co-occurring ASD and ID in 2002, but, a significantly higher pro-portion of Hispanic children met the
TABLE 1 Racial and Ethnic Characteristics of 8-Year-Old Children Who Meet the ASD Case Definition
Race/ethnicity 2000 2002 2004 2006
N % N % N % N %
Total populationa 42 338 100.0 45 113 100.0 13 619 100.0 41 647 100.0
White, non-Hispanic 24 058 56.8 25 252 56.0 6571 48.2 19 664 47.2 Hispanic, any race 14 252 33.7 15 348 34.0 5576 40.9 17 577 42.2 Other race/ethnicity 4028 9.5 4513 10.0 1472 10.8 4406 10.6 ASD populationb 295 100.0 280 100.0 133 100.0 504 100.0
White, non-Hispanic 211 71.5 195 69.6 83 62.4 295 58.5 Hispanic, any race 39 13.2 53 18.9 39 29.3 138 27.4 Other race/ethnicity 45 15.3 32 11.4 11 8.3 71 14.1 aPercentages noted represent proportion of all 8-year-old children.
bPercentages noted represent proportion of 8-year-old children who meet the ASD case definition.
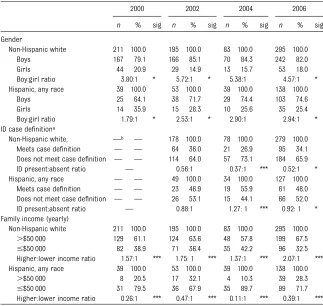
TABLE 2 Sociodemographic Characteristics of 8-Year-Old Children Who Meet the ASD Case Definition
2000 2002 2004 2006
n % sig n % sig n % sig n % sig
Gender
Non-Hispanic white 211 100.0 195 100.0 83 100.0 295 100.0 Boys 167 79.1 166 85.1 70 84.3 242 82.0 Girls 44 20.9 29 14.9 13 15.7 53 18.0 Boy:girl ratio 3.80:1 * 5.72:1 * 5.38:1 4.57:1 * Hispanic, any race 39 100.0 53 100.0 39 100.0 138 100.0
Boys 25 64.1 38 71.7 29 74.4 103 74.6 Girls 14 35.9 15 28.3 10 25.6 35 25.4 Boy:girl ratio 1.79:1 * 2.53:1 * 2.90:1 2.94:1 * ID case definitiona
Non-Hispanic white, —b — 178 100.0 78 100.0 279 100.0
Meets case definition — — 64 36.0 21 26.9 95 34.1 Does not meet case definition — — 114 64.0 57 73.1 184 65.9 ID present:absent ratio — 0.56:1 0.37:1 *** 0.52:1 * Hispanic, any race — — 49 100.0 34 100.0 127 100.0
Meets case definition — — 23 46.9 19 55.9 61 48.0 Does not meet case definition — — 26 53.1 15 44.1 66 52.0 ID present:absent ratio — 0.88:1 1.27: 1 *** 0.92: 1 * Family income (yearly)
Non-Hispanic white 211 100.0 195 100.0 83 100.0 295 100.0
.$50 000 129 61.1 124 63.6 48 57.8 199 67.5
#$50 000 82 38.9 71 36.4 35 42.2 96 32.5 Higher:lower income ratio 1.57:1 *** 1.75: 1 *** 1.37:1 *** 2.07:1 *** Hispanic, any race 39 100.0 53 100.0 39 100.0 138 100.0
.$50 000 8 20.5 17 32.1 4 10.3 39 28.3
#$50 000 31 79.5 36 67.9 35 89.7 99 71.7 Higher:lower income ratio 0.26:1 *** 0.47:1 *** 0.11:1 *** 0.39:1 ***
Percentages noted represent proportion of children in that ethnic group. sig, significance.
aFigures represent children who received clinician review for ID, which includes only a subset of all children who meet the ASD case definition.
bClinician review for ID was not conducted in study year 2000. *Comparison of proportions across ethnicity significant atP,.05. ***Comparison of proportions across ethnicity significant atP,.005.
study years a significantly higher per-centage of families of Hispanic children with ASD had incomes below the 2000 national average of $50 000 per year.
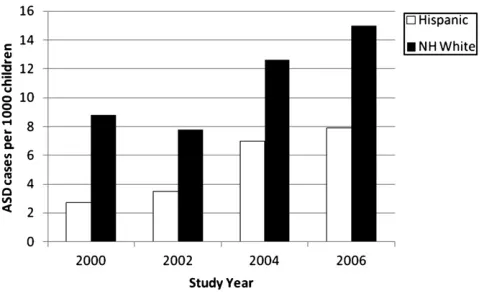
ASD Prevalence Trends
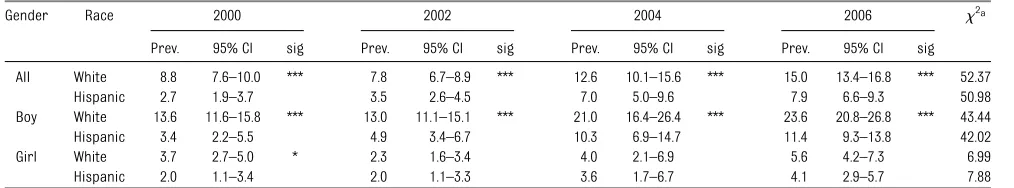
ASD prevalence for each study year is presented in Table 3 and Fig 1. Hispanic ASD prevalence, ranging from 2.7 to 7.9 per 1000, was higher than has been reported in previous investigations.10–13 For all study years, prevalence in His-panic children was lower than in NH white children (P,.005). x2tests of trend over time indicate that ASD prevalence in both Hispanic (x2 = 50.98, P ,.001) and NH white (x2 = 52.37, P , .001) samples increased significantly between 2000 and 2006.
Hispanic and NH white samples were further analyzed by gender. In each study year, prevalence of ASD for Hispanic boys was significantly lower than for NH white boys (Table 3). In contrast, among girls, Hispanic prevalence of ASD was signifi -cantly lower than among NH white girls only in study year 2000; in later years, prevalence of girls did not differ by eth-nicity (Table 3). x2 tests of trend over time indicate that in each gender and ethnicity group, prevalence increased significantly over the 6-year study period.
Comparison of Prevalence Ratios
The ratios of prevalence for ASD in NH white compared with Hispanic children
Mantel-Haenszel x2 tests of trend in-dicated that the OR of NH white to His-panic children decreased significantly (x2= 124.89,P,.001) from 3.22 (95% CI = 2.26–4.61) in 2000 to 1.92 (95% CI = 1.56–2.37) in 2006. When analyzed by gender, the OR of NH white to Hispanic children with ASD also significantly decreased in both boys and girls. Among girls (x2= 4.95,P,.05), the NH white to Hispanic ratio decreased from 1.85 in 2000 (95% confidence interval [CI] = 0.98–3.53) to 1.37 in 2006 (95% CI = 0.88–2.15). The ratio of NH white to Hispanic boys also showed a signifi -cant decrease over time (x2= 128.75, P,.001), dropping from 4.04 in 2000 (95% CI = 2.60–6.30) to 2.11 in 2006 (95% CI = 1.66–2.68). Regression lines used to test for a linear decrease in prevalence ratios between 2000 and 2006 found a nonsignificant decrease.
DISCUSSION
The prevalence of ASD in this population-based cohort showed significant increa-ses in 4 study years between 2000 and 2006, which is consistent with similar reports from across the United States and other developed countries.1–9The ASD prevalence for Hispanics in the current study, however, is markedly higher than has been reported pre-viously.10–12
The increased prevalence in Hispanic individuals that we observed in
thods for estimating prevalence. Ex-amining telephone survey results from the National Survey of Children’s Health between 2003 and 2004, Liptak and colleagues10 found that 2.6 per 1000 Latino children had a diagnosis of autism, per caregiver report.10 Though this result is lower than His-panic prevalence noted in the current study, at least some of this difference may result from Liptak and col-leagues’10focus on autism rather than on the current study’s broader case definition of ASD. In addition, Liptak and colleagues10 relied on caregiver response, whereas the current study examined clinical review of case re-cords from schools and clinical sour-ces, which sometimes identified a child with ASD who had not previously been diagnosed. In a similar inves-tigation using data from the National Health Interview Survey, the Hispanic ASD prevalence between 1997 and 2008 was estimated as 3.2 per 1000 children,18 similar to prevalence es-timates from the current study in 2000 and 2002, but lower than the prevalence in 2004 and 2006. Low ASD prevalence among Hispanic popula-tions has also been reported outside the United States; Montiel-Nava and Peña identified ASD in 1.7 per 1000 children in Maracaibo county, Ven-ezuela.12 Although they ascertained ASD cases in a manner similar to the
TABLE 3 Prevalence of ASD 2000–2006: White Versus Hispanic and Boys Versus Girls
Gender Race 2000 2002 2004 2006 x2a
Prev. 95% CI sig Prev. 95% CI sig Prev. 95% CI sig Prev. 95% CI sig
All White 8.8 7.6–10.0 *** 7.8 6.7–8.9 *** 12.6 10.1–15.6 *** 15.0 13.4–16.8 *** 52.37 Hispanic 2.7 1.9–3.7 3.5 2.6–4.5 7.0 5.0–9.6 7.9 6.6–9.3 50.98 Boy White 13.6 11.6–15.8 *** 13.0 11.1–15.1 *** 21.0 16.4–26.4 *** 23.6 20.8–26.8 *** 43.44 Hispanic 3.4 2.2–5.5 4.9 3.4–6.7 10.3 6.9–14.7 11.4 9.3–13.8 42.02 Girl White 3.7 2.7–5.0 * 2.3 1.6–3.4 4.0 2.1–6.9 5.6 4.2–7.3 6.99 Hispanic 2.0 1.1–3.4 2.0 1.1–3.3 3.6 1.7–6.7 4.1 2.9–5.7 7.88
Prev., number of ASD cases per 1000 8-year-old children in Arizona; sig, significance. aRefers tox2test for trend over time. Allx2values are significant atP,.01. *Significance testing of proportions across ethnicity atP,.05.
current study, some aspects of the Venezuelan health care system may have resulted in limited access to all ASD cases.12
Despite the higher prevalence of ASD in the current study, Hispanic children continue to show significantly lower prevalence in comparison with NH whites.10–13The reasons for these dif-ferences are likely complex and multi-faceted. Some recent investigations challenge the notion that Hispanic populations have a lower prevalence of ASD and suggest that reported rates are falsely low as a result of small sample sizes or limited access of the Hispanic community to appropriate health care facilities where ASD may be diagnosed.19Many of these disparities may be economically driven. Other disparities in health care access and utilization between Hispanic and NH white populations may also contribute to these differences. For example, mi-nority individuals are more likely to receive care in underresourced hospi-tals,20and doctors refer Hispanic chil-dren less frequently to specialists than their NH White peers.21Hispanic indi-viduals are also less likely to be medi-cally insured than NH whites,21 and non–English-speaking individuals may experience multiple barriers to medi-cal care.22,23 Although it was not the focus of the current study, more re-search is warranted examining the
potential association between health care disparities and ASD prevalence.
Previous investigations of adverse health outcomes in Hispanic popula-tions have found a lower than expected prevalence of such outcomes when compared with other ethnic groups, despite more risk factors such as lower socioeconomic status, reduced access to medical care, and fewer years of formal education.24,25 For example, in comparison with NH whites, Hispanic populations have lower mortality rates,26,27 lower incidence of mental health disorders,28and a lower risk of several types of cancer.29Despite the possibility that these differences may result from a decreased susceptibility to specific diseases, any genetic fac-tors that might explain them are largely unknown. It is also important to note that the Hispanic population rep-resents a heterogeneous group of individuals from a multitude of coun-tries, cultures, and historical back-grounds, which could contribute to genetic diversity among populations labeled as Hispanic. Lower ASD preva-lence among Hispanic populations is also consistent with an observed ten-dency for increased risk of ASD among individuals with higher family income and more years of formal education.30–32 The origins of this trend are not well understood, but may relate to in-creased access to diagnostic services,
or increased familiarity with and ac-ceptance of an ASD diagnosis among those who are more educated and
af-fluent.
The results of the current study cor-roborate other reports of increasing ASD prevalence in multiple ethnic and racial groups.4,31 In contrast to the highly significant differences in ASD prevalence in every study year for af-fected boys of different ethnicities, the difference among affected girls was significant for only 1 study year. As a result of these differences, the boy-to-girl ratio was substantially higher for NH white children with ASD in com-parison with Hispanic children. Although the boy-to-girl ASD prevalence ratio is consistently reported to be 3:1 or greater,1–3there is little research about the interaction of gender and ethnicity differences. The data herein reported suggest that the driver of these differ-ences is a persistently higher preva-lence in NH whites compared with Hispanic boys and that additional investigations into this phenomenon are warranted.
These results also suggest that the difference between Hispanic and NH white prevalence is decreasing. The decrease in the OR between NH white and Hispanic ASD prevalence appears largely due to the marked increase in Hispanic prevalence between 2000 and 2006. Although the reasons for in-creased ASD prevalence are unknown for all populations, it is possible that the increased prevalence in the Hispanic population may result from increased awareness of ASD among parents and health care professionals who work with Hispanic children, improved ac-cess to ASD-related services in the Hispanic population, and other related medical and educational factors. To explore this possibility further, we an-alyzed how the percentage of children who had a previous diagnosis of ASD (before they were identified by the
FIGURE 1
Histogram of prevalence rates (per 1000 8-year-old children) for both Hispanic and NH white groups.
rates of previous ASD diagnosis in the Hispanic population increased from 38% to 49% of children who met the case definition for ASD, and rates of previous diagnosis in the NH white population increased from 53% to 57%. These results suggest that the increase in Hispanic prevalence may be explained at least in part by increased awareness of ASD and an associated increase in community diagnosis.
Intellectual Disability and ASD
Findings from the current study in-dicate that more Hispanic than NH white children met ADDM criteria for both ID and ASD in 2004 and 2006. A number of interesting characteristics have been identified in individuals with co-occurring ID and ASD.31,33,34For exam-ple, people with both ID and ASD are reported to have significantly poorer social interactions than their peers with ID only and may also show more restricted interests and repetitive be-havior, although both groups often have similar communication.33–35 In keeping with the results of the current study, McInnes and colleagues36found that 21 of 35 (60%) children with ASD in a Costa Rican sample had an IQ,50. This is consistent with other inves-tigations of ID and ASD co-occurrence, in which children of Hispanic origin were at increased risk for severe ID in comparison with NH white children.37 However, Mandell and colleagues,11by using data from the ADDM network, found that among children with IQs,70, Hispanic children were less likely than NH white children to have a previous diagnosis of ASD. More surveillance
standing of prevalence and character-istics as they relate to race and ethnicity.
Strengths and Limitations
One of the primary strengths of this study is its population-based data col-lection, which eliminates the referral bias of most previous investigations. In addition, the systematic and externally validated nature of the casefinding and case identification procedures mini-mizes the clinical variability of referral samples. A potential limitation of this study is that individual cases are not validated prospectively by clinician evaluation. A recent analysis of the case definition protocol used in this study, however, shows that the ADDM protocol likely underestimates the number of children diagnosed with ASD, in com-parison with diagnosis by an experi-enced clinician who is blinded to case definition status.38 Another potential limitation of this investigation is that the results may not be generalizable to all populations of Hispanic origin. The Hispanic population of Arizona primar-ily comprises individuals of Mexican descent. It remains to be seen whether a similar prevalence will be found in Hispanic populations whose members come from other countries of origin and may have different sociodemographic characteristics. Finally, as a result of our data acquisition methods, thefi nd-ings of the study are necessarily limited to the accuracy of the information available within children’s records.
The results of this study have important implications for future ASD research
environmental, and systems-based influences on the ethnic disparities in ASD prevalence has the potential to identify modifiable risk factors that may improve clinical outcomes. Clinically, the results of the current study un-derscore the importance of continuing to improve access to quality health care for people across all racial and ethnic populations, in particular, given the increasing prevalence of ASD in the Hispanic population. For example, sur-veillance for ASD would likely benefit from improved screening measures available in both English and Spanish. Also, the high rate of co-occurring ID and ASD in the Hispanic population indi-cates unique educational and health care needs that must be met by
quali-fied professionals.
CONCLUSIONS
The prevalence of ASD in the Hispanic population appears to be higher than previously reported, even though His-panic children have lower ASD prev-alence when compared with non-Hispanic Whites. Building on previous reports that examined single point-in-time prevalence, results of the cur-rent study show that ASD prevalence in non-Hispanic white and Hispanic populations is rising, and that the prevalence gap between Hispanic and non-Hispanic white individuals is de-creasing.
ACKNOWLEDGMENTS
The authors thank Zhenqiang James Lu for his expert statistical consulta-tion.
REFERENCES
1. Autism and Developmental Disabilities
Mon-itoring Network 2006 Principal Investigators.
Prevalence of autism spectrum disorders—
autism and developmental disabilities
mon-itoring network, United States, 2006.MWWR
Surveill Summ. 2009;58(SS10):1–20
2. Autism and Developmental Disabilities
Monitoring Network Surveillance Year 2000
spectrum disorders—autism and deve-lopmental disabilities monitoring network, six sites, United States, 2000.MWWR Sur-veill Summ. 2007;56(SS01):1–11
3. Autism and Developmental Disabilities Monitoring Network Surveillance Year 2002 Principal Investigators. Prevalence of au-tism spectrum disorders—autism and developmental disabilities monitoring net-work, 14 sites, United States, 2002.MWWR Surveill Summ. 2007;56(SS01):12–28
4. Croen LA, Grether JK, Hoogstrate J, Selvin S. The changing prevalence of autism in California.J Autism Dev Disord. 2002;32(3): 207–215
5. Lazoff T, Zhong L, Piperni T, Fombonne E. Prevalence of pervasive developmental disorders among children at the English Montreal School Board.Can J Psychiatry. 2010;55(11):715–720
6. Rice C, Nicholas J, Baio J, et al. Changes in autism spectrum disorder prevalence in 4 areas of the United States.Disabil Health J. 2010;3(3):186–201
7. Gal G, Abiri L, Reichenberg A, Gabis L, Gross R. Time trends in reported autism spectrum disorders in Israel, 1986–2005 [published online ahead of print May 13, 2011].J Autism Dev Disord. doi:10.1007/s10803-011-1252-7
8. Hertz-Picciotto I, Delwiche L. The rise in autism and the role of age at diagnosis.
Epidemiology. 2009;20(1):84–90
9. Fombonne E. Epidemiology of pervasive developmental disorders. Pediatr Res. 2009;65(6):591–598
10. Liptak GS, Benzoni LB, Mruzek DW, et al. Disparities in diagnosis and access to health services for children with autism: data from the National Survey of Children’s Health. J Dev Behav Pediatr. 2008;29(3): 152–160
11. Mandell DS, Wiggins LD, Carpenter LA, et al. Racial/ethnic disparities in the identifi ca-tion of children with autism spectrum disorders.Am J Public Health. 2009;99(3): 493–498
12. Montiel-Nava C, Peña JA. Epidemiological
findings of pervasive developmental dis-orders in a Venezuelan study.Autism. 2008; 12(2):191–202
13. Palmer RF, Walker T, Mandell D, Bayles B, Miller CS. Explaining low rates of autism among Hispanic schoolchildren in Texas.
Am J Public Health. 2010;100(2):270–272
14. Rice CE, Baio J, Van Naarden Braun K, Doernberg N, Meaney FJ, Kirby RS; ADDM Network. A public health collaboration for the surveillance of autism spectrum
dis-orders.Paediatr Perinat Epidemiol. 2007;21 (2):179–190
15. Office of Management and Budget. Revi-sions to the standards for the classification of federal data on race and ethnicity.Fed Regist. 1997;62(210):58782–58790
16. Szlko M, Nieto J.Epidemiology: Beyond the Basics. 2nd ed. Gaithersburg, MD: Aspen Publishers; 2006
17. US Census Bureau. American FactFinder. 2011. Available at: http://factfinder.census. gov/home/saff/main.html. Accessed March 14, 2011
18. Boyle CA, Boulet S, Schieve LA, et al. Trends in the prevalence of developmental dis-abilities in US children, 1997-2008. Pediat-rics. 2011;127(6):1034–1042
19. Fombonne E. Epidemiology of autistic dis-order and other pervasive developmental disorders.J Clin Psychiatry. 2005;66(suppl 10):3–8
20. Hasnain-Wynia R, Baker DW, Nerenz D, et al. Disparities in health care are driven by where minority patients seek care: examination of the hospital quality alliance measures.Arch Intern Med. 2007;167(12):1233–1239
21. Flores G, Abreu M, Tomany-Korman SC. Why are Latinos the most uninsured racial/ ethnic group of US children? A community-based study of risk factors for and con-sequences of being an uninsured Latino child.Pediatrics. 2006;118(3). Available at: www.pediatrics.org/cgi/content/full/118/3/ e730
22. Flores G, Tomany-Korman SC. The language spoken at home and disparities in medical and dental health, access to care, and use of services in US children.Pediatrics. 2008; 121(6). Available at: www.pediatrics.org/ cgi/content/full/121/6/e1703
23. Blumberg SJ, Read D, Avila RM, Bethell CD. Hispanic children with special health care needs from Spanish-language households.
Pediatrics. 2010;126(suppl 3):S120––S128
24. Gallo LC, Penedo FJ, Espinosa de los Mon-teros K, Arguelles W. Resiliency in the face of disadvantage: do Hispanic cultural characteristics protect health outcomes?
J Pers. 2009;77(6):1707–1746
25. US Census Bureau. The 2012 Statistical Abstract. 2011. Available at: www.census. gov/compendia/statab/. Accessed Novem-ber 10, 2011
26. Arias E, Anderson RN, Hsiang-Ching K, Murphy SL, Kochanek KD. Deaths: final data for 2001. In:National Vital Statistics Reports. Vol 52, no 3. Hyattsville, MD: National Center for Health Statistics; 2003
27. Palloni A, Arias E. Paradox lost: explaining the Hispanic adult mortality advantage.
Demography. 2004;41(3):385–415
28. Grant BF, Stinson FS, Hasin DS, Dawson DA, Chou SP, Anderson K. Immigration and lifetime prevalence of DSM-IV psychiatric disorders among Mexican Americans and non-Hispanic whites in the United States: results from the National Epidemiologic Survey on Alcohol and Related Conditions.
Arch Gen Psychiatry. 2004;61(12):1226–1233
29. Abraído-Lanza AF, Dohrenwend BP, Ng-Mak DS, Turner JB. The Latino mortality para-dox: a test of the“salmon bias”and healthy migrant hypotheses. Am J Public Health. 1999;89(10):1543–1548
30. Durkin MS, Maenner MJ, Meaney FJ, et al. Socioeconomic inequality in the prevalence of autism spectrum disorder: evidence from a U.S. cross-sectional study.PLoS ONE. 2010;5(7):e11551
31. Croen LA, Grether JK, Selvin S. Descriptive epidemiology of autism in a California population: who is at risk? J Autism Dev Disord. 2002;32(3):217–224
32. Maenner MJ, Arneson CL, Durkin MS. So-cioeconomic disparity in the prevalence of autism spectrum disorder in Wisconsin.
WMJ. 2009;108(5):253–255
33. Hartley SL, Sikora DM. Sex differences in autism spectrum disorders: An examina-tion of developmental funcexamina-tioning, autistic symptoms, and coexisting behavior prob-lems in toddlers.J Autism Dev Disord. 2009; 39(12):1715–1722
34. Matson JL, Dempsey T, Lovullo SV, Wilkins J. The effects of intellectual functioning on the range of core symptoms of autism spectrum disorders.Res Dev Disabil. 2008; 29(4):341–350
35. Matson JL, Wilkins J, Ancona M. Autism in adults with severe intellectual disability: an empirical study of symptom presentation.
J Intellect Dev Disabil. 2008;33(1):36–42
36. McInnes LA, González PJ, Manghi ER, et al. A genetic study of autism in Costa Rica: multiple variables affecting IQ scores ob-served in a preliminary sample of autistic cases.BMC Psychiatry. 2005;5(1):15–26
37. Croen LA, Grether JK, Selvin S. The epidemi-ology of mental retardation of unknown cause. Pediatrics. 2001;107(6). Available at: www.pediatrics.org/cgi/content/full/107/6/e86
38. Nonkin Avchen R, Wiggins LD, Devine O, et al Evaluation of a records-review surveillance system used to determine the prevalence of autism spectrum disorders. J Autism Dev Disord. 2011;41(2):227–236
DOI: 10.1542/peds.2011-1145 originally published online February 20, 2012;
2012;129;e629
Pediatrics
Gotschall, Daniel B. Kessler, Theresa A. Grebe and Christopher Cunniff
Anita Pedersen, Sydney Pettygrove, F. John Meaney, Kristen Mancilla, Kathy
Services
Updated Information &
http://pediatrics.aappublications.org/content/129/3/e629
including high resolution figures, can be found at:
References
http://pediatrics.aappublications.org/content/129/3/e629#BIBL
This article cites 33 articles, 3 of which you can access for free at:
Subspecialty Collections
http://www.aappublications.org/cgi/collection/autism:asd_sub Autism/ASD
al_issues_sub
http://www.aappublications.org/cgi/collection/development:behavior Developmental/Behavioral Pediatrics
following collection(s):
This article, along with others on similar topics, appears in the
Permissions & Licensing
http://www.aappublications.org/site/misc/Permissions.xhtml
in its entirety can be found online at:
Information about reproducing this article in parts (figures, tables) or
Reprints
http://www.aappublications.org/site/misc/reprints.xhtml
DOI: 10.1542/peds.2011-1145 originally published online February 20, 2012;
2012;129;e629
Pediatrics
Gotschall, Daniel B. Kessler, Theresa A. Grebe and Christopher Cunniff
Anita Pedersen, Sydney Pettygrove, F. John Meaney, Kristen Mancilla, Kathy
Children
Prevalence of Autism Spectrum Disorders in Hispanic and Non-Hispanic White
http://pediatrics.aappublications.org/content/129/3/e629
located on the World Wide Web at:
The online version of this article, along with updated information and services, is
by the American Academy of Pediatrics. All rights reserved. Print ISSN: 1073-0397.