2
This reference document contains supporting data to accompany the State of the Industry 2015 and a copy of the SOI online survey.
Contents
CONTENTS... 2
LIST OF FIGURES ... 2
LIST OF TABLES ... 2
SUPPLEMENTARY SOI DATA ... 3
CONVENTION DATA ... 3
SEASONALITY ... 3
LENGTH OF STAY ... 8
SOI SURVEY RESULTS ... 11
SAMPLE DESCRIPTION ... 11
TOURISM BUSINESS CHARACTERISTICS ... 13
CHALLENGES FACING TOURISM INDUSTRY ... 15
OPPORTUNITIES FOR THE TOURISM INDUSTRY ... 19
VISION FOR TOURISM... 21
STATE OF THE INDUSTRY 2015 SURVEY ... 23
List of Figures FIGURE 1 CONVENTION CONFERENCE ARRIVALS (YEAR ENDED MARCH 2005-2015) ... 3
FIGURE 2 SEASONALITY GRAPHS – TOP 6 MARKETS & 6 SELECTED MARKETS (YEAR ENDED MARCH 2005, 2010 & 2015) .. 4
FIGURE 3 SEASONALITY – ALL INTERNATIONAL ARRIVALS (YEAR ENDED MARCH 2005, 2010 & 2015)... 8
FIGURE 4 AVERAGE, MEDIAN AND TOTAL STAY DAYS – AUSTRALIA (YEAR ENDED MARCH 2005-2015) ... 8
FIGURE 5 AVERAGE, MEDIAN AND TOTAL STAY DAYS – CHINA (YEAR ENDED MARCH 2005-2015) ... 9
FIGURE 6 AVERAGE, MEDIAN AND TOTAL STAY DAYS – USA (YEAR ENDED MARCH 2005-2015) ... 9
FIGURE 7 AVERAGE, MEDIAN AND TOTAL STAY DAYS – UK (YEAR ENDED MARCH 2005-2015)... 9
FIGURE 8 AVERAGE, MEDIAN AND TOTAL STAY DAYS – JAPAN (YEAR ENDED MARCH 2005-2015) ... 10
FIGURE 9 AVERAGE, MEDIAN AND TOTAL STAY DAYS – GERMANY (YEAR ENDED MARCH 2005-2015) ... 10
FIGURE 10 SURVEY SAMPLE – INDUSTRY INVOLVEMENT (N=269) ... 11
FIGURE 11 TOURISM BUSINESSES – BUSINESS FOCUS (N=238) ... 12
FIGURE 12 LOCATION OF SURVEY RESPONDENTS (N=269) ... 12
FIGURE 13 GEOGRAPHICAL SCOPE OF RESPONDENT’S BUSINESS OPERATIONS (N=269) ... 13
FIGURE 14 TOURISM BUSINESSES – OPERATING CHARACTERISTICS (N=238) ... 14
FIGURE 15 TOURISM BUSINESSES – NUMBER OF EMPLOYEES (N=236 FULL TIME; N=235 PART TIME) ... 14
FIGURE 16 SELECTED PURPOSE OF VISIT (VFR, STUDENT, CONF-CONVT) BY BUSINESS LOCATION ... 15
FIGURE 17 SELECTED VISITOR PURPOSE (CRUISE, EVENT, CYCLE, GOLF) BY BUSINESS LOCATION ... 15
FIGURE 18 CHALLENGES FACING THE WHOLE TOURISM INDUSTRY ... 16
FIGURE 19 PERCENTAGE REPORTING ITEMS TO BE NOT A CHALLENGE ... 16
FIGURE 20 OPPORTUNITIES FOR THE WHOLE TOURISM INDUSTRY ... 19
FIGURE 21 PERCENTAGE REPORTING ITEMS TO BE NOT AN OPPORTUNITY ... 19
FIGURE 22 AGREEMENT WITH VISION STATEMENT ... 21
List of Tables TABLE 1 LOCATION OF SURVEY RESPONDENT AND TYPE OF INDUSTRY INVOLVEMENT (N=269) ... 13
TABLE 2 OTHER CHALLENGES – SUMMARY DESCRIPTION ... 17
TABLE 3 OTHER OPPORTUNITIES – SUMMARY DESCRIPTION ... 20
3
Supplementary SOI data
This section contains graphs supporting text presented in the State of the Industry 2015 report. These graphs relate to convention arrival data, arrivals data (by month) for the top six and six selected markets, and length of stay data for the top six markets.
Convention data
International arrivals indicating their main purpose of visiting New Zealand to be Convention/conference represented only 1.9% of international arrivals in 2015.
Figure 1 Convention conference arrivals (Year ended March 2005-2015)
Source: Statistics New Zealand
Seasonality
To allow easy comparison of arrivals from different markets, the seasonality graph in the SOI 2015 report (Figure 16) showed the percentage of arrivals by month for only the top four markets and for all arrivals. The graphs presented here show the number of arrivals from 12 markets (the top six and six selected) by month, for the 2005, 2010 and 2015 March end years (Figure 2). Figure 3 shows the total number of arrivals by month in 2005, 2010 and 2015 (Year ended March). These graphs clearly illustrate the changes in arrivals from each market, as well as the seasonal distribution of these arrivals. Over the last decade, seasonality has become more pronounced for the majority of these markets.
0.0% 0.5% 1.0% 1.5% 2.0% 2.5% 3.0%
0 10,000 20,000 30,000 40,000 50,000 60,000 70,000
2005 2006 2007 2008 2009 2010 2011 2012 2013 2014 2015
Pe
rce
n
t
N
u
m
b
er
Convention/Conference arrivals
(Year ended March 2005-2015)
4
Figure 2 Seasonality graphs – top 6 markets & 6 selected markets (Year ended March 2005, 2010 & 2015)
1,273,152 arrivals in 2015
↑45% since 2005
Arrival peak
13% December
40% Dec-Mar
295,552 arrivals in 2015
↑251% since 2005
Arrival peak
19% February
Peak becoming more pronounced
226,960 arrivals in 2015
↑3% since 2005
Arrival peaks
16% February
14% December
0 50,000 100,000 150,000 200,000
Apr May Jun Jul Aug Sep Oct Nov Dec Jan Feb Mar
N
u
m
b
er
Australia
2005 2010 2015
0 10,000 20,000 30,000 40,000 50,000 60,000
Apr May Jun Jul Aug Sep Oct Nov Dec Jan Feb Mar
N
u
m
b
er
China
2005 2010 2015
0 10,000 20,000 30,000 40,000
Apr May Jun Jul Aug Sep Oct Nov Dec Jan Feb Mar
N
u
m
b
er
USA
5 199,760 arrivals in 2015
↓32% since 2005
Arrival peak
49% Dec-Feb
83,392 arrivals in 2015
↓49% since 2005
Arrival peaks
12% December
10% August
81,152 arrivals in 2015
↑42% since 2005
Arrival peak
16% December
16% February
0 10,000 20,000 30,000 40,000 50,000
Apr May Jun Jul Aug Sep Oct Nov Dec Jan Feb Mar
N
u
m
b
er
UK
2005 2010 2015
0 5,000 10,000 15,000 20,000 25,000
Apr May Jun Jul Aug Sep Oct Nov Dec Jan Feb Mar
N
u
m
b
er
Japan
2005 2010 2015
0 2,000 4,000 6,000 8,000 10,000 12,000 14,000
Apr May Jun Jul Aug Sep Oct Nov Dec Jan Feb Mar
N
u
mb
er
Germany
6 47,296arrivals in 2015
↑45% since 2005
Arrival peak
23% December
Peak becoming more pronounced
40,880arrivals in 2015
↑150% since 2005
Arrival peaks
12% December
12% March
11% May
31,824 arrivals in 2015
↑30% since 2005
Arrival peak
18% December
Peak becoming more pronounced
0 2,000 4,000 6,000 8,000 10,000 12,000
Apr May Jun Jul Aug Sep Oct Nov Dec Jan Feb Mar
N
u
m
b
er
Singapore
2005 2010 2015
0 1,000 2,000 3,000 4,000 5,000 6,000
Apr May Jun Jul Aug Sep Oct Nov Dec Jan Feb Mar
N
u
m
b
er
India
2005 2010 2015
0 1,000 2,000 3,000 4,000 5,000 6,000
Apr May Jun Jul Aug Sep Oct Nov Dec Jan Feb Mar
N
u
m
b
er
Malaysia
7 15,456 arrivals in 2015
↑97% since 2005
Arrival peaks
23% July
18% December
12,176 arrivals in 2015
↑115% since 2005
Arrival peaks
13% December
12% April
12,048 arrivals in 2015
↑93% since 2005
Arrival peak
15% January
46% Nov-Feb
Source: Statistics New Zealand 0 1000 2000 3000 4000
Apr May Jun Jul Aug Sep Oct Nov Dec Jan Feb Mar
N
u
m
b
er
Indonesia
2005 2010 2015
0 500 1000 1500 2000
Apr May Jun Jul Aug Sep Oct Nov Dec Jan Feb Mar
N
u
m
b
er
Philippines
2005 2010 2015
0 500 1000 1500 2000 2500
Apr May Jun Jul Aug Sep Oct Nov Dec Jan Feb Mar
N
u
m
b
er
Brazil
8
Figure 3 Seasonality – all international arrivals (Year ended March 2005, 2010 & 2015)
Source: Statistics New Zealand
Length of stay
The SOI 2015 only showed median stay days (Figure 11) and total stay days (Figure 12) for the six main markets in 2015. The graphs presented in Figures 4-9 show average, median and total stay days for the six main markets. Source for all graphs: Statistics New Zealand.
Figure 4 Average, median and total stay days – Australia (Year ended March 2005-2015)
0 50,000 100,000 150,000 200,000 250,000 300,000 350,000 400,000 450,000
Apr May Jun Jul Aug Sep Oct Nov Dec Jan Feb Mar
N
u
m
b
er
All international arrivals
2005 2010 2015
0 2,000,000 4,000,000 6,000,000 8,000,000 10,000,000 12,000,000 14,000,000 16,000,000
0 2 4 6 8 10 12 14
2005 2006 2007 2008 2009 2010 2011 2012 2013 2014 2015
To
ta
l s
ta
y d
ay
s
Day
s
Australia
9
Figure 5 Average, median and total stay days – China (Year ended March 2005-2015)
Figure 6 Average, median and total stay days – USA (Year ended March 2005-2015)
Figure 7 Average, median and total stay days – UK (Year ended March 2005-2015)
0 1,000,000 2,000,000 3,000,000 4,000,000 5,000,000 6,000,000 0 5 10 15 20 25
2005 2006 2007 2008 2009 2010 2011 2012 2013 2014 2015
To ta l s ta y d ay s Day s
China
Average stay days Median stay days Total stay days
0 500,000 1,000,000 1,500,000 2,000,000 2,500,000 3,000,000 3,500,000 4,000,000 4,500,000 0 5 10 15 20
2005 2006 2007 2008 2009 2010 2011 2012 2013 2014 2015
To ta l s ta y d ay s Day s
USA
Average stay days Median stay days Total stay days
0 2,000,000 4,000,000 6,000,000 8,000,000 10,000,000 0 5 10 15 20 25 30 35
2005 2006 2007 2008 2009 2010 2011 2012 2013 2014 2015
To ta l s ta y d ay s Day s
UK
10
Figure 8 Average, median and total stay days – Japan (Year ended March 2005-2015)
Figure 9 Average, median and total stay days – Germany (Year ended March 2005-2015)
0 500,000 1,000,000 1,500,000 2,000,000 2,500,000 3,000,000
0 5 10 15 20
2005 2006 2007 2008 2009 2010 2011 2012 2013 2014 2015
To
ta
l s
ta
y d
ay
s
Day
s
Japan
Average stay days Median stay days Total stay days
0 500,000 1,000,000 1,500,000 2,000,000 2,500,000 3,000,000 3,500,000 4,000,000 4,500,000
0 10 20 30 40 50 60
2005 2006 2007 2008 2009 2010 2011 2012 2013 2014 2015
To
ta
l s
ta
y d
ay
s
Day
s
Germany
11
SOI survey results
An online survey was distributed via the membership databases of TIA, New Zealand Airports Association, Backpacker Youth & Adventure Tourism Association, Cruise New Zealand, Holiday Parks Association of New Zealand, the New Zealand Maori Tourism Council, Motel Association of New Zealand, Regional Tourism Organisations New Zealand, Ski Areas Association of New Zealand, Tourism Export Council and the Youth Hostel Association of New Zealand. The survey was created and distributed using Qualtrics software. Data was transported into an Excel spreadsheet for quality
checking before being analysed using SPSS 22 (Statistical Package for Social Sciences).
The survey was in four parts and collected data on:
The nature of respondents involvement in tourism industry
Challenges facing the tourism industry
Tourism industry opportunities
Vision for tourism in 2025
The survey was accessible online to respondents from early June until the end of July 2015. Altogether, 269 surveys were complete enough to be included in analysis presented in this report.
As a result of overlap in membership, with some potential respondents listed on multiple databases, and having no information on the size of the various databases accessed it was not possible to estimate a response rate for the survey.
Sample description
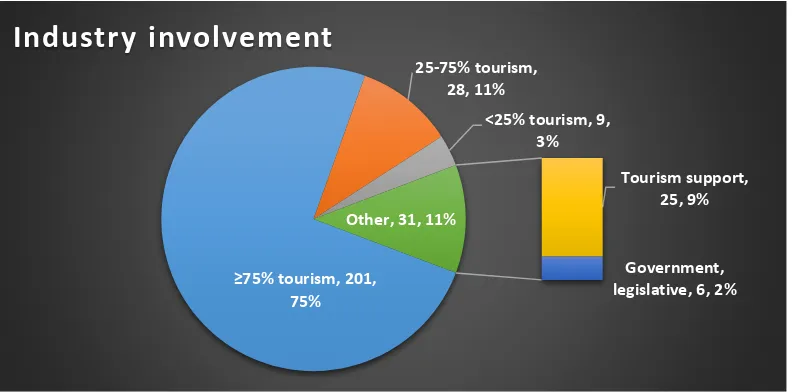
Altogether, 88.4% (n=238) of respondents reported that 25% or more of their sales came from tourism with almost three quarters (74.7%, n=201) reliant on tourism for 75% or more of their annual sales. Just over 10% of respondents (n=31) were involved in tourism support or had a governmental or legislative role associated with tourism (Figure 10).
Figure 10 Survey sample – industry involvement (n=269)
≥75% tourism, 201, 75%
25-75% tourism, 28, 11%
<25% tourism, 9, 3%
Tourism support, 25, 9%
Government, legislative, 6, 2% Other, 31, 11%
12
Of those reporting at least 25% of their sales from tourism (n=238), slightly more than half (52.5%, n=125) were accommodation businesses, a quarter (25.2%, n=60) were attraction and activity businesses and 12.2% (n=29) were tour operators (Figure 11).
Figure 11 Tourism businesses – business focus (n=238)
Altogether, just over half of all respondents (52.4%, n=141) were located in the North Island with the majority of these located in Auckland, followed by Bay of Plenty, Northland and Wellington (Figure 12). While the Central North Island contains all other North Island regions there were no respondents from either Gisborne or Taranaki.
Almost three quarters of the 128 South Island respondents were located in either Canterbury (n=40) or the Lower South Island (i.e., Otago (n=54) and Southland (n=9) combined). The Upper South Island group included respondents from all other regions (i.e., Marlborough, Nelson, Tasman and West Coast).
Table 1 presents a more detailed breakdown of respondents by individual region and industry involvement.
Figure 12 Location of survey respondents (n=269)
52.5% 25.2% 12.2% 5.5%
2.5% 1.3% 0.8%
0% 10% 20% 30% 40% 50% 60% 70% 80% 90% 100%
Business focus
Accommodation Attraction & activities Tour operator Transport Promotion/marketing Retail Food & hospitality services
Northland, 20, 8%
Auckland, 51, 19%
Bay of Plenty, 24, 9%
Central North Island, 26, 10% Wellington, 20,
7% Upper South
Island, 25, 9% Canterbury, 40,
15% Lower South Island, 63, 23%
13
Table 1 Location of survey respondent and type of industry involvement (n=269)
North Island n=141 South Island n=128
Tourism Other Tourism Other
Auckland 43 8 Otago 49 5
Bay of Plenty 23 1 Canterbury 37 3
Northland 17 3 Southland 7 2
Wellington 15 5 West Coast 8 -
Waikato 13 2 Marlborough 6 1
Manawatu-Wanganui 5 1 Nelson 6 -
Hawke’s Bay 5 Tasman 4 -
Total 121 20 Total 117 11
Almost two-thirds of respondents reported that their business or operations were focused/located in a single location. Half of the total sample (n=135) operated only in the region of their primary location, almost a third (n=74) operated in both New Zealand and overseas; of the remainder, 35 operated New Zealand-wide and 25 operated only in the island of their primary location (Figure 13).
Figure 13 Geographical scope of respondent’s business operations (n=269)
Tourism business characteristics
The 238 tourism businesses were asked about their operating characteristics and the types of visitors they catered for.
Although the majority of the 238 tourism businesses surveyed operated year round slightly more than two thirds (68.1%, n=162) reported employing seasonal workers. More than half (54.2%, n=129) reported having difficulty getting skilled staff and almost a third (32.4%), n=77) employ migrant workers (Figure 14).
ONLY in region of primary location,
135, 50%
Own region, elsewhere in that
island, 25, 9% New
Zealand-wide, 35, 13% New Zealand and overseas, 74, 28%
14
Figure 14 Tourism businesses – operating characteristics (n=238)
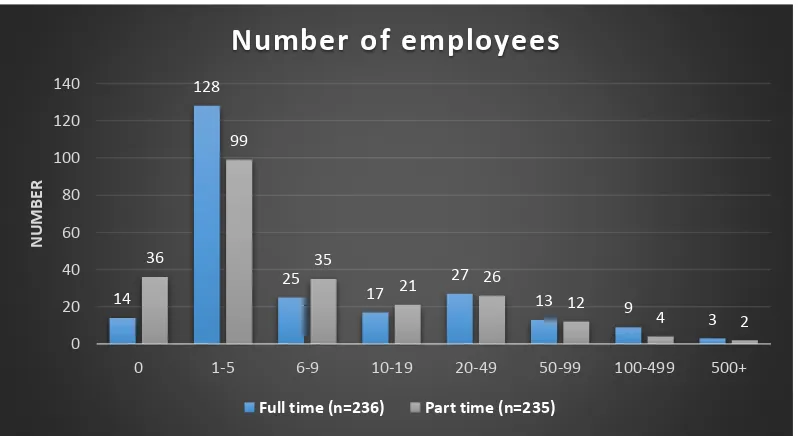
Tourism business respondents were asked how many people (including themselves) they employed on an annual basis. Altogether, 78% of respondents employed 19 or fewer full time employees and 81% employed 19 or fewer part time employees (SME’s are defined as those businesses employing 19 or fewer employees). However, 1-5 employees was the most common number of both full time (54%, n=128) and part time employees (42%, n=99).
Figure 15 Tourism businesses – number of employees (n=236 full time; n=235 part time)
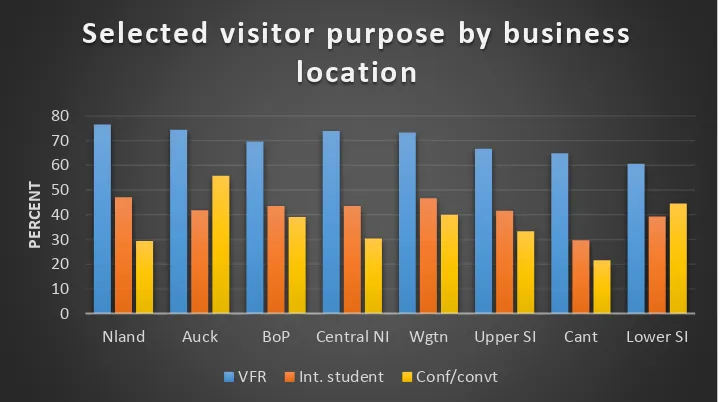
Figures 16 and 17 show the selected visit purpose data by business location. These data are presented in Table format (Table 3) and described in more detail the SOI 2015 report.
94.1 68.1 54.2 32.4
5.9 31.9 45.8 67.6
0 20 40 60 80 100
Operate year-round Employ seasonal workers Difficult to get skilled staff Employ migrant workers
Operating characteristics of business
Yes No
14
128
25
17 27 13
9
3 36
99
35
21 26
12
4 2
0 20 40 60 80 100 120 140
0 1-5 6-9 10-19 20-49 50-99 100-499 500+
N
UM
BE
R
Number of employees
15
Figure 16 Selected purpose of visit (VFR, Student, Conf-convt) by business location
Figure 17 Selected visitor purpose (Cruise, Event, Cycle, Golf) by business location
Challenges facing tourism industry
Figures 18 and 19 show the percent of respondents agreeing with the challenge statements in respect of impact on the whole industry. Table 2 contains a summary of the additional challenges suggested by respondents.
0 10 20 30 40 50 60 70 80
Nland Auck BoP Central NI Wgtn Upper SI Cant Lower SI
PE
R
C
EN
T
Selected visitor purpose by business
location
VFR Int. student Conf/convt
0 10 20 30 40 50 60 70
Nland Auck BoP Central NI Wgtn Upper SI Cant Lower SI
PE
R
C
EN
T
Selected visitor purpose by business
location
16
Figure 18 Challenges facing the WHOLE tourism industry
Figure 19 Percentage reporting items to be NOT a challenge
36.1 36.8 38.3 48 48.3 51.7 52.8 58.7 60.6 61 62.8 63.9 64.3 64.3 65.1 68.4
0 10 20 30 40 50 60 70 Adventure activity safety
Technology services for businesses Limited regional dispersal Challenges growing the domestic market Lack of investment in sector research Fuel prices Visitor demand for technology Changing marketing channels Staff and skill shortages Meeting changing market expectations
Investment in infrastructure Seasonality issues Exchange rates Environmental concerns Increasing regulatory demands & compliance costs Changing markets
Percent
Challenge facing the WHOLE tourism industry
10.4 16.4 17.5 24.2 25.3 25.7 27.1 28.6 30.5 32 34.2 39 43.1 45.4 46.8 56.5
0 10 20 30 40 50 60 Seasonality issues
Investment in infrastructure Increasing regulatory demands and compliance…
Changing markets Meeting changing market expectations Staff and skill shortages Changing marketing channels Exchange rates Challenges growing the domestic market Environmental concerns Visitor demand for technology Fuel prices Technology services for businesses Lack of investment in sector research Limited regional dispersal Adventure activity safety
17
Table 2 Other challenges – summary description
Theme Description of challenges
Employment Skill levels; visa issues; decreased work options due to competition within temporary visa sector; language; service standards; lack of support for training providers; immigration issues, perception of poor career options in hospitality; poor training and standards; lack of professionalism; poor language options in schools; better talent management and promotion of hospitality as a career path; industry not attractive to New Zealanders as a career path; recruiting and retaining skilled staff; poor service levels associated with culture of ‘enthusiastic amateurs’; New Zealanders do not want tourism jobs, reliance on transient populations; lack of
seniority/gravitas in sector; retention of staff; provision of housing for staff; lack of remuneration for staff; need to make tourism a sexy industry; encouraging the next future leaders into our industry; industry standards for service
External challenges
Exchange rates; competition from other destinations; border security; economic instability (both international and national); New Zealand perceived as expensive, difficult to reach destination; lack of airline seats to New Zealand from emerging markets (e.g., India, S. America &
Indonesia); proposed new border tax; reliance on fickle Asian markets; high operating costs cf regional neighbours; earthquake and climate change risks
Capacity & supply
Accommodation limits; capacity for hosting large events; lack of quality accommodation; lack of hotel accommodation in Canterbury; capacity to cope with predicted growth (accommodation, roading, transport, staff); capacity issues in the South Island (transport, accommodation); lack of collaboration exacerbating seasonality issues; lack of quality hotels; infrastructure and facility challenges associated with increased numbers of tourists (especially in Auckland); capacity pressures during summer
Regional dispersal
Lack of support (and funding) to regions for promotion; capacity for hosting events; limited regional flights; regional marketing bias; focus on ‘big boys’, cost & development of transport routes; lack of investment in RTOs; low awareness and promotion of attractions by local councils; more regional events; DOC land could accommodate alternative tourism use; some regions not well-promoted; channelling of visitors through Auckland
Compliance Cost to businesses; poor compliance by some businesses; unregulated accommodation business (e.g. Air B&B); inconsistency in regulator standards; unequal regulatory demands; uneven playing field; should be more enforcement of non-compliance; poorly managed properties; reluctance of local regulatory authorities to enforce their own standards; number of illegal hostels operating
18
Realistic pricing
Competition from non-commercial suppliers (accommodation, transport); ‘giving away’ New Zealand; freedom camping takes visitors away from commercial options; lack of monitoring in DOC campgrounds; freedom camping; getting consistency across entities (e.g., cycle trails) re charges; enforcing charges on DOC land for use (and concessions); expectation by tourists that prices will be cheaper than in the past; freedom camping affecting Holiday Park industry
Support & governance
Lack of support for small operators; lack of recognition for tourism benefits; funding issues; scattered marketing channels; lack of local government support; industry leaders ignoring small business owners; lack of funding for i-SITEs/visitor centres; decisions made by bureaucrats without commercial experience; boosterism for already successful businesses; councils unable to see how their actions affect competition and business profitability; MBIE too big and unwieldy to respond quickly to industry concerns; government should provide incentives for youth
training in tourism; lack of support for South Island tourism
post-Christchurch earthquake; more weight needs to go on research; domestic market deserves more attention; freedom camping regulations; over-governance by DOC
Tourist behaviour & satisfaction
Freedom camping (in both rural and urban areas), driver competence; freeloading; poor environmental responsibility; tourists not paying DOC fees; tourist crime; poor cell phone cover; poor quality (and gravel) roads; market resistance to holiday surcharges; overcrowding in popular tourist areas as a result of RTO promotional/informational laziness; growth has led to overcrowding; overcrowding at icon destinations
Small business challenges
Keeping abreast of technology; technology costs; lack of consultation with smaller operators; too much support for already established/successful operators; ‘mega-famils’ stifle smaller operators; new cost structures with little or no revenue increase; difficult to be noticed; capability limits of SMEs in respect of technology; no incentive for small business to pass on skills
Broad concerns
Poor environmental performance by some in industry; challenge (cost) of market diversification whilst maintaining growth in traditional markets; danger of a mass ’attract ‘em all’ approach; potential for overcrowding; potential to over saturate market with single visitor groups; need a clear vision regarding how open our border should be; destination management that balances growth, financial returns and impacts on community; proliferation of marketing channels; lack of growth in marketing budgets; over saturation of marketing resources on luxury visitors; lack of resources for youth/adventure sector; lack of industry understanding by
19
Opportunities for the tourism industry
Figures 20 and 21 show the percent of respondents agreeing with the opportunity statements in respect of relevance to the whole industry. Table 3 contains a summary of the additional opportunities suggested by respondents.
Figure 20 Opportunities for the WHOLE tourism industry
Figure 21 Percentage reporting items to be NOT an opportunity
61.7 71.4
74 76.6 77
79.9 79.9 81
81.8 81.8 82.2 82.9 83.3 86.6
0 10 20 30 40 50 60 70 80 90 International students
New product development Events (as a means to counteract seasonality) Maximising domestic tourism potential Growth of niche markets Infrastructure improvements Growing the Australia market
Greater industry cohesion Increased air capacity Use of new technologies and social media Development of visitor facilities and amenities Improving the visitor experience to grow value Attracting more visitors to regions
Growth of new markets
Percent
Opportunity for WHOLE industry
3.3 4.1
4.5 4.8
7.4 7.4 7.8
8.2 8.6
8.9 8.9
14.1 14.5
32
0 5 10 15 20 25 30 35 Improving the visitor experience to grow value
Attracting more visitors to regions Growth of new markets Use of new technologies and social media Growing the Australia market Development of visitor facilities and amenities
Growth of niche markets Infrastructure improvements Events (as a means to counteract seasonality) Maximising domestic tourism potential Increased air capacity Greater industry cohesion New product development International students
20
Table 3 Other opportunities – summary description
Theme Description of opportunity
Niche & selected markets
Wedding industry; cruise sector; conference sector; premium market; Australian travallers, particularly long-stay coach tours
Increased & improved promotion
Regions; shoulder and low seasons; focus on domestic tourism; promote to Australia market; farm-based accommodation and B&B – met the locals; specific South Island marketing; promote the unique history of New Zealand; ensure strong New Zealand brand that the visitor experience delivers on
Increase & improve supply
Increase range of accommodation, particularly in regions; offer suitable food to new markets; increase hotel capacity; diversify regional offering
Funding & operational
Bed tax and NP fees to pay for infrastructure; having easy pathways for entrepreneurial people to set up new businesses; lower compliance demands; charge for DOC-based recreation; get all providers on board promoting industry, including paying their share of infrastructure and promotion; funding for building the visitor experience; distribution of funding more equably across industry; stop freedom camping and make tourists pay
Attitudes to tourism
Engaging the public more effectively; raising awareness of the importance of the public as part of the New Zealand tourism experience
Improving the tourist
experience
Improve quality consistency across hospitality sector; clean up crime affecting tourists; expanding experience to untouched areas; improving the visitor experience; improve service standards
21
Vision for tourism
Figure 22 shows the percent agreeing with each vision statement provided. Table 4 is the full list of alternative visions suggested by respondents.
Figure 22 Agreement with vision statement
Table 4 Alternative vision statements
Alternative vision for tourism in 2025
To carry on selling NZ as the pure and inspirational place it needs to be. That every event is utilised where appropriate to market our region/country and
therefore add value to the smaller businesses we often rely on. Offer a village atmosphere and a quality experience of real people not just corporate. I consider that the aspirational goals in Tourism 2025 are hogwash since the industry does not have the tools to alter any party’s behaviour in order to achieve those goals. Over the years I have been involved in several 'industry strategies' involving multiple businesses and they achieve nothing that is better than the individual business would
have achieved without the strategy.
An industry that works cohesively throughout regions and with the local community, utilizing technology and exceptional service while protecting our environment and
providing a personal approach.
A diverse industry that recognises the value of all visitors from budget to 5 star, promoted in an authentic way to an engaged visitor type.
A profitable, sustainable, INNOVATIVE industry that encourages new product development through cross-sector and cross-regional collaboration.
That New Zealand moves to high quality product at reasonable price and eradicates 85.4
86.5 88.4 88.5
91.3 91.4 91.8
92.1 94
95.5 96.6
97 98.6
80 85 90 95 100
Environmentally sustainable Year-round, with all regions benefitting Better understanding of tourism benefits Change in visitor mix to more high value visitors A stronger cultural profile Quality tourism demonstrating New Zealand values High quality premium destination A $41 billion visitor economy by 2025 Well-connected, technology savvy, people focused Dynamic, sustainable, wealth-creating Right people, right places, right skills Providing a world class visitor experience Celebrating the uniqueness of New Zealand
Percent agreeing
22
cut throat and predatory pricing, delivering a quality product that we can all be proud of.
New Zealand is an aspirational destination for all travelers. Driving a profitable and caring visitor industry.
To see NZ as the world’s premium natural/nature destination
Supporting infrastructure, less government (national and local) competition, genuine "PureNZ" instead of slogans, people first.
Tourism is an important sector in the New Zealand economy and an important means through which we drive economic development in the country across all business
sectors.
More professional and higher quality. New Zealand would be a high class tourism industry.
Growth is managed sustainably and not at the expense of existing community infrastructure and well-being.
New Zealand becomes a high value destination which people aspire to visit South Island as a destination, to combat the years of North Island at the cost of the
South Island.
To be cognisant of global trends so that we can future-proof and continue to grow our industry.
Culturally unique, sustainable wealth-creating world leader in community orientated interactions.
My vision in terms of expectation is that we will have a devalued tourism product, focused in chasing volume way ahead of quality. That products that devalue our country (Airbnb, homestay, couch surfing, Woofer, HelpX, hitch hiking etc) will further
promote horrible sense of entitlement where no-one wants to pay for anything. This trend is disincentivising legitimate tourism businesses. They are taking huge market
share and contribute nothing to promoting NZ, and even worse, generally not contributing their share to infrastructure. I would say we are beginning a downward
spiral we may never dig our way out of. Instead, we should be supporting business that have and will continue to promote NZ tourism as a high quality product with
VALUE, not something to give away.
NZ will be a Weekend Getaway for people from the North Hemisphere with more efficient transport.
Promote and provide a fully-rounded authentic Kiwi experience for international visitors.
An industry which all NZ residents, especially families, no matter their economic means can experience – holidays in affordable camping grounds and huts throughout
the country.
An industry that is vibrant, highly skilled, world-leading in all aspects of delivery, safety, fun, experiential, ecology and marketing & social.
Tourism generates employment and economic prosperity for New Zealand through delivering high-value visitor experiences that respect and protect our culture and
23
State of the Industry 2015 Survey
State of the Tourism Industry 2015
Opening page of survey
Thank you for taking part in this survey. The survey should take you approximately 15-20 minutes to complete – the completion bar will show you how far you have
progressed.
After starting the survey, the system will allow you up to two weeks to complete the survey. The final cut-off/expiration date of the survey is 31st July 2015.
The survey has questions relating to: your involvement in the tourism industry and the challenges and opportunities facing the industry. There are also some questions about what your Vision for Tourism in 2025 might look like.
Even if your business/operations/responsibilities are not totally focused on tourism we would still like to know what you think about the State of the Tourism Industry in 2015.
Before starting the survey we need you to acknowledge that you:
Have read the description of the project in the accompanying email and agree to participate
Understand that participation is voluntary
Understand that you may withdraw from the survey at any time up until clicking on the ‘submit survey’ button
Understand that any data collated via incomplete surveys will be excluded from analysis
24
PART 1: ABOUT YOU
The first set of questions are designed to tell us a little about your involvement in and/or engagement with the tourism industry or sector.
Q1
How would you describe your involvement in the tourism industry or sector? Tourism business with at least 75% of annual sales from tourism (1) Part tourism business with between 25% and 75% of annual sales from tourism (2) Tourism-related business (less than 25% of annual sales from tourism) (3)
Tourism support (e.g., infrastructure, service provider), research, advocacy (4) Government, legislative (5)
Nothing I do is related to the tourism industry/sector (THANK YOU - WE DO NOT REQUIRE YOU TO COMPLETE THE SURVEY) (6)
If Tourism support (e.g., infr...) Is Selected, or If Government, legislative Is Selected, Then Skip To Q3 Where is your primary location?
If Nothing I do is related to ... Is Selected, Then Skip To End of Survey
Q2
What is your primary business focus? Accommodation (1) Attractions and activities (2) Transport (3)
Retail (4)
Food and hospitality services (5) Tour operator (6)
Promotion/marketing (7)
Q3
Where is your primary location? If you operate in/across multiple locations you will have the option to tell us this in the next question Northland (1) Auckland (2) Waikato (3) Bay of Plenty (4) Gisborne (5) Hawke's Bay (6) Taranaki (7)
Manawatu-Wanganui (8) Wellington (9)
25 Southland (15)
Marlborough (16)
Q3
Where is your primary location? If you operate in/across multiple locations you will have the option to tell us this in the next question Northland (1) Auckland (2) Waikato (3) Bay of Plenty (4) Gisborne (5) Hawke's Bay (6) Taranaki (7)
Manawatu-Wanganui (8) Wellington (9)
Tasman (10) Nelson (11) Canterbury (12) West Coast (13) Otago (14) Southland (15) Marlborough (16)
Q4
Is your business, or are your operations, located/focused on? A single location (1) Across multiple locations (2)
Q5
What is the geographical scope of your business/operations? ONLY in the region of my primary location (1) In my own region, as well as locations in the rest of the island in which I am located (2)
New Zealand-wide (3)
New Zealand and overseas (4)
Answer Q6 – Q12 ONLY if the following answers were selected in Q1 (How would you describe your involvement in the tourism industry/sector?):
Tourism business (at least 75% of annual sales from tourism)
26
Q6
The next two questions are about the operating characteristics of your business…Yes (1) No (2)
Do you operate year-round? (1)
Do you employ seasonal workers?
(2)
Do you employ migrant workers? (3)
Do you find it difficult to get skilled
staff? (4)
Q7
Including yourself, how many people do you employ on an annual basis? Please enter the number of part time and full time employees in the boxes below… (space given for number to be entered)Full time (enter '0' if none) (1) ________________ Part time (enter '0' if none) (2) ________________
We now have some questions about the type of visitors your business caters for.
These may be international or domestic visitors – by domestic visitors we mean people who might be visiting or purchasing your product who are not members of the local population. Having a permanent residence at a distance of more than 40kms is the common definition of when a visitor/customer becomes a domestic tourist, rather than a member of the local population.
Q8
I would estimate that my customers are.... MAINLY INTERNATIONAL visitors (1) A mix of both, but MORE INTERNATIONAL visitors (2) An EQUAL MIX of international and domestic visitors (3) A mix of both, but MORE DOMESTIC visitors (4)
MAINLY DOMESTIC visitors (5)
Q9
My domestic customers are MAINLY visiting from.... My own region (1) Neighbouring regions (2)
Elsewhere in the island in which I am located (3) From the other island (4)
27
Q10
My international customers are MAINLY from.... Australia (1) China (2)
Traditional markets (e.g., UK. Europe, North America, Japan, Korea) (3) Emerging markets (e.g., India, Indonesia, Latin America) (4)
Other markets - please tell us which ones? (5) ____________________ I don't have many international customers (6)
Q11
The list below includes a selection of countries from which New Zealand receives visitors. Some of these are traditional markets, from which we have a lot of visitors, while others are small, but have been showing significant growth over the last few years.For each of the countries listed please select the option which most accurately describes your experienceof that market over thelast 3 years....
Growing (1) Static (2) Declining (3) Not one of my markets (4)
Australia (1)
China (2)
USA (3)
UK (4)
Japan (5)
Germany (6)
Indonesia (7)
Philippines (8)
India (9)
Malaysia (10)
Singapore (11)
28
Q12
International tourists visiting New Zealand travel in different ways and for different purposes.A selection of these visitor types and interests are listed below - which of these are customers for your business? (MULTIPLE ANSWERS ARE POSSIBLE)
Visiting friends and relatives (VFR) (1) International students (2)
Cruise ship visitors (3)
Conference/convention visitors (4)
Special event visitors (e.g., sporting, cultural, festivals) (5) Cycle tourists (6)
Golf tourists (7) None of these (8)
THE REST OF THE SURVEY IS ANSWERED BY EVERYONE
PART 2: CHALLENGES
This section asks about the current challenges facing the tourism industry.
Q13
The following list of tourism industry challenges is compiled from interview data collected for the 2011 and 2012 State of the Sector reports and TIA's Strategic Plan.For each challenge listed, please indicate whether it is a challenge for YOUR business (or in respect of your operations or engagement in the tourism sector) and/or a challenge for the WHOLE tourism industry - you can pick both of these options if you wish.
29 This is a challenge facing MY business
(1)
This is a challenge facing the WHOLE tourism industry (2)
I do NOT perceive this to be a challenge (3)
Changing markets (1)
Exchange rates (2)
Environmental concerns (3)
Fuel prices (4)
Investment in infrastructure
(5)
Seasonality issues (6)
Increasing regulatory demands and compliance
costs (7)
Visitor demand for technology (e.g., free WIFI)
(8)
Technology services for businesses (e.g., booking
systems) (9)
Staff and skill shortages (10)
Challenges growing the
domestic market (11)
Limited regional dispersal
(12)
Adventure activity safety
(13)
Lack of investment in sector
research (14)
Changing marketing
channels (15)
Meeting changing market
expectations (16)
Q14
These are the items you selected as challenges for YOUR business. Which one presents the most significant challenge for you?Answer If This is a challenge facing MY business Is Selected for any items given as challenges in the previous question. If respondents did not select anything as a challenge for their business they will be taken straight to Q15
30
Q15
Are there any other challenges facing the tourism industry that were not included in the list we gave you? No (1)
Yes - please tell us what they are? (2) ____________________
Q16
One of the challenges in the list we gave you was staff and skill shortages. These have also attracted considerable media attention of late. A selection of issues associated with staff and skills are listed below - please indicate the extent to which you either agree or disagree that each of these represents a significant challenge for the tourism industry.Strongly disagree (1)
Disagree (2) Somewhat disagree (3)
Somewhat agree (4)
Agree (5) Strongly agree (6)
Workforce
capacity (1) Service levels
(2)
Poor promotion of
tourism as a career (3)
Reliance on migrant labour
(4)
Migrant labour exploitation
(5)
Visa issues (6)
Staff retention
(7)
Staff shortages
(8)
Workforce
flexibility (9) Staff
remuneration as a barrier to recruitment
(10)
31
PART 3: OPPORTUNITIES
We now have some questions about tourism industry opportunities. These follow the same format as the questions you have just answered relating to challenges.
Q17 The following list of tourism industry/sector opportunities is compiled from interview data collected from the 2011 and 2012 State of the Sector reports and TIA's Strategic Plan.
For each opportunity listed, please indicate whether it is an opportunity for YOUR business (or in respect of your operations or engagement in the tourism sector) and/or an opportunity for the WHOLE tourism industry - you can pick both of these options if you wish. If you don't think the item listed is an opportunity, please pick the option in the right hand column.
This is an opportunity for MY business (1)
This is an opportunity for the WHOLE tourism
industry (2)
I do NOT perceive this to be an opportunity (3)
Increased air capacity (1)
Growth of new markets (2)
Growth of niche markets
(3)
New product development
(4)
Improving the visitor experience to grow value
(5)
Use of new technologies
and social media (6) Growing the Australia
market (7)
Maximising domestic
tourism potential (8) Events (as a means to
counteract seasonality) (9) Greater industry cohesion
(10)
Development of visitor facilities and amenities
(11)
Infrastructure
improvements (12) International students (13)
Attracting more visitors to
32
Q18
These are the items you selected as opportunities for YOUR business. Which one presents the most important opportunity for you?Only Answer If - This is an opportunity for MY business Is Selected in previous question - If respondents did not select any of the listed items as opportunities for their business they will be taken to straight to Q19
Respondents will be given a list of those items they selected as opportunities for their business to choose from
Q19
Are there any opportunities facing the tourism industry that were not included in the list we gave you?
No (1)
Yes - please tell us what they are? (2) ____________________
Q20
Motivations for domestic travellers are typically very different to those of international visitors. In this question we are interested in your perception of the challenges and opportunities associated with the domestic visitor market.33
DOMESTIC TOURISM……..
Strongly disagree (1)
Disagree (2) Somewhat disagree (3)
Somewhat agree (4)
Agree (5) Strongly agree (6)
Supports commercial
accommodation (1) Significantly
contributes to regional economies (2)
Supports business success and develops
capability (3)
Mitigates seasonality and drives visitation through the off-peak
season (4)
Provides opportunities through domestic market segmentation
to target niche markets (5)
Is seen by consumers as expensive compared
to international destinations (6)
Is not seen as an aspirational proposition compared
to international destinations (7)
Lacks cohesive marketing through a
gap in funding and capability (8)
Lacks the right infrastructure and transport links (9)
Is not supported by regular and robust insight to improve destination planning
strategies (10)
PART 4: VISION FOR TOURISM
This final set of questions asks about your 'Vision for tourism in 2025'
34
Strongly disagree
(1)
Disagree (2)
Somewhat disagree
(3)
Somewhat agree (4)
Agree (5) Strongly agree (6)
A dynamic, sustainable,
wealth-creating industry (1) Everyone conducts their
business in an environmentally sustainable
way (2)
That NZ is a high quality,
premium destination (3) Celebrating the uniqueness
of New Zealand (4) A stronger cultural profile (5)
Providing a world class visitor
experience (6) A well-connected industry
that is smart, technology savvy, but that doesn't lose its soul, which is really good
people (7)
A year-round destination, where all regions are significantly benefiting from
the visitor dollar (8)
A better understanding of tourism from everyone in the
community - of what percentage of their income
comes from tourism (9)
That we have quality tourism, we have preserved our
community and our environment, and people understand that we are a
country that values conservation, community
and people (10)
To see a change in the visitor mix and a higher proportion of higher value visitors (11)
A $41 billion visitor economy
by 2025 (12) The right people in the right
places with the right skills (13)
35
Q22
If you had to pick just ONE of these vision statements which one is closest to your OWN VISION for tourism in 2025? A dynamic, sustainable, wealth-creating industry (1)
Everyone conducts their business in an environmentally sustainable way (2) That NZ is a high quality, premium destination (3)
Celebrating the uniqueness of New Zealand (4) A stronger cultural profile (5)
Providing a world class visitor experience (6)
A well-connected industry that is smart, technology savvy, but that doesn't lose its soul, which is really good people (7)
A year-round destination, where all regions are significantly benefiting from the visitor dollar (8)
A better understanding of tourism from everyone in the community - of what percentage of their income comes from tourism (9)
That we have quality tourism, we have preserved our community and our environment, and people understand that we are a country that values conservation, community and people (10)
To see a change in the visitor mix and a higher proportion of higher value visitors (11)
A $41 billion visitor economy by 2025 (12)
The right people in the right places with the right skills (13)
Q23
Do you have an alternative vision for tourism in 2025? Yes (1) No (2)
If No Is Selected, Then Skip To End of Survey
Q24
What is your vision?Space given for own vision to be typed in