Does Revenue-Expense Matching Relate To
Going-Concern Audit Opinion Conditional
On Firm’s Financial Distress?
Hak Woon Kim, Ph.D., Sungkyunkwan University, South KoreaSooro Lee, Ph.D., HyupSung University, South Korea
ABSTRACT
This paper investigates how firms manage the revenue-expense relationship in the presence of a going-concern audit opinion (GCO). Using Korean data, we find that firms with GCOs both delay and accelerate recognition of current expenses for current revenues. We also find that firms in severe financial distress that receive GCOs exhibit conservative accounting, whereas GCO firms in relatively less financial trouble adopt aggressive accounting. Overall, our results imply that firms’ matching extent and behavior provide useful information regarding financial reporting and can explain the earnings management behavior of firms with GCOs.
Keywords: Matching; Going-Concern Opinion; Discretionary Accruals; Earnings Management
1. INTRODUCTION
rior studies have examined whether there are associations between low financial reporting quality and a going-concern audit opinion (GCO)1. Several studies (Bartov, Gul, and Tsui 2000; Bradshaw, Richardson, and Sloan 2001; Amedo, Lizarraga, and Sanchez 2008) find that a significant relationship between GCOs and accounting accruals implies aggressive accounting, whereas Butler, Leone, and Willenborg (2004) suggest that this association is driven by firms that have large negative accruals and is due mainly to financial distress rather than earnings management. Butler, Leone, and Willenborg (2004) argue that firms with GCOs during periods of severe financial distress2 display extreme negative discretionary accruals due to transactions conducted to meet liquidity needs through delays in accounts payable and factor accounting receivables. Our research question in this paper is thus: how do firms manage the revenue-expense relationship in the presence of GCOs? We investigate the association between revenue-expense matching and earnings management by firms that receive GCOs, depending on their financial characteristic variables. More specifically, this study examines whether firms that receive GCOs accelerate recognition of current expenses in the prior period or delay recognition to the following period to manage earnings.
Accelerating or delaying recognition of current expenses on current revenues may appear through the manager’s opportunistic accounting choices, under which the manager calculates earnings by artificially adjusting them between accounting periods. Based on prior studies (Dichev and Tang 2008; Paek 2011b), types of matching can be classified into the following three categories: neutral accounting, where current revenue recognizes current expenses in the current period; conservative accounting, whereby current revenues are recognized in the current period, but current expenses are recognized in the prior period by accelerating recognition of current expenses on current revenues; and aggressive accounting, whereby current revenues are recognized in the current period, but current expenses are recognized in the following period by delaying recognition of current expenses. Equivalent to neutral accounting, the more properly current revenues and current expenses are matched, the higher the quality of earnings
1 In this paper, a going-concern audit opinion (GCO) is defined as an auditor’s issuance of a going-concern audit opinion for the current fiscal year’s financial statements of an audit client that received a clean opinion for the previous fiscal year. Audit firms issue a going-concern opinion to reflect substantial doubt regarding a client’s ability to continue as a going concern for one year beyond the financial statement date.
2 Firms in severe financial distress are defined as those with negative equity, losses, and higher leverage, as in the third tertile of portfolios partitioned by the total liability to equity ratio. This represents the top 30 percent of portfolios.
(Paek 2011b). In addition, when a portion of current expenses is identified early in the prior period under conservative accounting, earnings persistence increases (Paek 2012). Paek (2012) found that net income, cash flow from operations, and market value are higher for a large group with accelerated recognition of current expenses. Moreover, a group with a higher delayed recognition of expenses shows significant differences in the earnings range of loss avoidance (0.00 – 0.01), which indicates that loss avoidance incentives increase strongly in a large group with a higher delayed recognition of expenses. Application of aggressive accounting is suggested when managers are provided with opportunistic financial reporting incentives through delayed recognition of current expenses (Basu 1997; Bhattacharaya, Daouk, and Welker 2003).
In the United States, the overall subsequent bankruptcy rate within 12 months after receiving a GCO is 12.3 percent (Geiger and Rama 2006). If a firm experiences the critical uncertainty of a going-concern, the firm may have an incentive to consider different types of earnings management, depending on the firm’s financial condition. This situation may occur if firms are in severely distressed positions and demonstrate negative equity, losses, and higher leverage, or if firms are insolvent, on the edge of bankruptcy, or without sufficient flexibility in earnings management (Kim, Sin, and Lee 2014). These firms have extremely negative (-) discretionary accruals, which can be interpreted as a firm engaging in downward earnings management (Mutchler, Hoopwood, and McKeown 1997). Moreover, financially troubled firms often deliberately reduce reported earnings because managers attempt to improve short-term cash flow by disposing of inventory or accounts receivable (DeAngelo, DeAngelo, and Skinner 1994). Regarding downward earnings incentives, Holthausen, Larcker, and Sloan (1995) indicate that managers manipulate earnings downwards when earnings reach either the lower bound or the upper bound and when managers’ bonuses are at a maximum. This downward earnings management is derived from conservative accounting. When recognizing the phenomenon of extremely negative (-) discretionary accruals as a result of serious financial stress, an auditor tends to adopt a conservative attitude/manner based on high litigation risks related to the business failure of these firms (Lu and Sapra 2009). The auditor’s conservative approach leads to a reversal of excessive accruals that occurred in the prior period (Kim, Son, and Lee 2013), and auditors may force managers to make noncash write-offs (DeAngelo, DeAngelo, and Skinner 1994). Consequently, financial reporting by management may appear to exhibit conservative accounting, with current expenses recognized earlier.
However, managers of firms with GCOs and in relatively less severe financial distress3, such as lower firm performance and leverage, may engage in upward earnings management to disguise their weak performance in prior periods, to bolster investor and stakeholder confidence, or to avoid receiving consecutive GCOs from an auditor (Kim 2013). These firms have positive (+) discretionary accruals. If positive (+) discretionary accruals occur because of a manager’s opportunistic behavior, the firm’s financial reporting may appear to exhibit aggressive accounting, based on the delayed recognition of current expenses for current revenues. In addition, if a firm’s financial stress is not severe, managers may have strong incentives to inflate earnings to bind debt covenants and to rule out interruption of a board meeting (DeAngelo, DeAngelo, and Skinner 1994). This study examines the mutual incompatibility of discretionary accruals by using types of matching revenues and expenses, such as the accelerated or delayed recognition of expenses, depending on the financial characteristic variables of firms that receive GCOs.
Consequently, we first find that the extent of neutral accounting in firms that receive a GCO is extremely low, whereas the level of both accelerated and delayed recognition of current expenses is high, indicating that the manager’s intention is primarily to intervene in accounting choices. Second, we find that GCO firms in less financial distress are more likely to inflate earnings through delayed recognition of current expenses related to current revenues. This finding explains why positive (+) discretionary accruals occur in GCO firms facing less financial distress. We conclude that the significant relationship between expense recognition and GCOs is conditional on a firm’s financial distress. Third, for GCO firms with higher leverage, losses, or negative equity, conservative accounting occurs through accelerated recognition of current expenses. These firms are more likely to trigger a default of debt repayments, debt restructuring, delisting, the designation of investment consideration, and a market warning by way of a GCO in the audit report. Finally, we find that GCO firms with conservative accounting practices show extremely negative (-) discretionary accruals.
This study provides two main contributions to the accounting literature. First, GCO firms in less financial distress use aggressive accounting to manage their earnings upward (i.e., income-increasing). This result indicates that firms with GCOs employ different financial reporting depending on the firm’s characteristic variables. Second, the financial reporting of GCO firms can be explained more specifically when using the matching extent as a proxy for existing earnings management. This result implies that revenue-expense matching plays a complementary role regarding discretionary accruals as a proxy for earnings management for firms with GCOs.
This study is organized as follows. The research background and hypotheses are developed in reference to prior studies in section II, and the model design for testing the hypotheses and the sample selection procedure are established in section III. Section IV provides the results of the empirical research, and conclusions are stated in section V.
2. RESEARCH BACKGROUND AND HYPOTHESIS DEVELOPMENT
2.1 Research Background
The matching principle, the basis of accrual accounting, has been a major subject of research related to earnings management, the most widely studied subject area in accounting (Donelson, Jennings, and McInnis 2011). Matching can be categorized into neutral, aggressive, and conservative accounting according to recognition of expenses related to current revenues (Paek 2011a). Neutral accounting refers to the manner in which current revenues and current expenses are most appropriately matched, whereas aggressive or conservative accounting represents delayed or accelerated recognition of current expenses, respectively. For the past 40 years, an increase in earnings volatility and a decrease in earnings persistence have been observed owing to the deteriorating neutrality of accounting (Dichev and Tang 2008); conversely, trends in conservative and aggressive accounting have strengthened (Paek 2011a). Increase neutrality in accounting results in higher quality of earnings in terms of higher earnings persistence, earnings predictability, income smoothing, and earnings response coefficients (Paek 2011b). Additionally, if the portion of current matching is recognized in an accelerated manner in the prior period, earnings persistence will be significantly higher than when the portion of current matching is recognized in a delayed manner (Paek 2012). If there are no managerial opportunistic incentives, current expenses will be recognized in an accelerated manner, or current revenues will be recognized in a delayed manner. Furthermore, if aggressive financial reporting characteristics exist, current expenses will be recognized in a delayed manner, or there will be an accelerated recognition of future revenues in the current year (Basu 1997; Bhattacharaya, Daouk, and Welker 2003). This finding implies a possible method of earnings management in relation to the matching principle if managerial opportunistic incentives exist.
2.2 Hypothesis Development
Factors that affect the matching principle include inevitable business environments, uncertainties in economic circumstances, managerial discretion, and changes in the accounting regulation system (Donelson, Jennings, and McInnis 2011). Moreover, prior studies of accounting information and its usefulness indicate that firm characteristic variables, such as losses, nonrecurring items, and firm size, affect matching extent and behavior (Collins, Maydew, and Weiss 1997; Francis and Shipper 1999). In a study of firm characteristic variables that affect matching amid changes in accounting environments, Paek (2011a) indicates that losses and discretionary accruals are significantly associated with inappropriate matching. This means that higher loss reporting, depreciation of tangible and intangible assets, and discretionary accruals lead to an increased probability of inappropriate matching. Whereas prior studies focus on understanding the reasons for changes in matching, this study provides an additional contribution by further analyzing the possibility that financial distress and managerial discretion affect matching. On the other hand, many studies find that auditors are more likely to issue GCOs when firms are less profitable, have higher leverage, have lower liquidity, have had a prior GCO and have defaulted on debt (Carson et al. 2013).
management. We expect that if a GCO firm changes its business strategy depending on the level of financial distress and if the results of its financial reporting are affected by the manager’s interruption of accounting choices and estimates, those firms may use recognition of current expenses related to current revenues to either aggressively or conservatively account for the firm’s level of financial distress; this behavior occurs pursuant to financial characteristic variables such as firm performance, debt to equity ratio, and negative equity. Based on this logic, we hypothesize the following:
H1: Firms with GCOs will both delay and accelerate recognition of current expenses for current revenues.
In general firms that receive GCOs are financially distressed. In a study of the financial reporting characteristics of GCO firms listed in Korea, Kim (2013) finds that these firms demonstrate income-increasing earnings management through positive (+) discretionary accruals and downward earnings management through extremely negative (-) discretionary accruals. Hyun et al. (2014), who examine the fundamental reasons for worsening scenarios under the matching principle, find that change in interest costs is the main reason for mismatching because of changes in the debt-equity ratio. Recognition of revenues and expenses by firms with GCOs can be delayed or accelerated, depending on firm characteristic variables such as the debt-equity ratio, the return on assets, and impaired capital. Delayed or accelerated recognition of revenues and expenses can affect the financial reporting characteristics of firms that follow this business strategy (Paek 2013). Therefore, firms that receive GCOs are expected, in their entirety, to demonstrate both positive (+) and negative (-) discretionary accruals simultaneously. As such, firms that receive GCOs may exhibit matching with attenuated neutrality owing to recognition of delayed and accelerated current expenses. If firms with GCOs have positive discretionary accruals, this scenario reflects the manipulation of accounting numbers, or aggressive accounting, through recognition of current expenses later. Conversely, if firms that receive GCOs have negative discretionary accruals, this scenario indicates downward earnings, or conservative accounting, through recognition of current expenses earlier. Therefore, we hypothesize the following:
H2: Firms with highly positive (+) discretionary accruals that receive GCOs are associated with aggressive accounting, i.e., recognition of current expenses later, whereas firms with extremely negative (-) discretionary accruals that receive GCOs are associated with conservative accounting, i.e., recognition of current expenses earlier.
For GCO firms that are in relatively less severe financial distress or are characterized by lower firm performance and leverage, incentives may exist to increase earnings, although the increased earnings may raise significant questions amid going-concern uncertainties; these incentives include aggressive accounting to reduce the cost of interest for debt financing, to disguise the prior period’s weak firm performance, or to avoid receipt of the same GCO from auditors by recognizing current expenses in a delayed manner. Conversely, if severe financial distress reaches a serious condition, such as impaired capital (i.e., negative equity), loss in earnings or high leverage, a firm has a high probability of becoming insolvent and is on the edge of bankruptcy. Such firms also have a high audit risk of business failure, according to auditors. If the audit risk is high, the prior period’s accruals often reverse because of auditors’ conservatism (Lu and Sapra 2009), resulting in extremely negative (-) discretionary accruals. An auditor’s conservatism may increase asset write-offs and decrease earnings through recognition of current expenses earlier, a scenario that reflects conservative accounting. Based on the above logic, we hypothesize the following:
H3: Firms in more severe financial distress that receive GCOs are more likely to adopt conservative accounting, i.e., recognize current expenses earlier, whereas firms with less financial distress that receive GCOs are more likely to adopt aggressive accounting, i.e., recognize current expenses later.
3. RESEARCH DESIGN AND SAMPLE SELECTION
3.1 Research Design
3.1.1 Controlling for Potential Sample-Selection Bias and Endogeneity of GCO Firms
of possible endogeneity between discretionary accruals and GCOs, which may lead to simultaneous equation and omitted variables bias, this issue must be controlled. To address the sample-selection bias and endogeneity issues, we use the Heckman (1979) two-stage regression model. We estimate the probability that a firm receives a GCO, using the first-stage model, where firms that receive GCOs are the dependent variable. We estimate the inverse mills ratio (Lambda) via the probit model, using firm characteristics as explanatory variables.
In the probit model (1), we include the prior period’s absolute discretionary accruals as a control variable because a firm with low earnings quality is likely to have a GCO (Mutchler, Hoopwood, and McKeown 1997). The higher the level of financial distress is, the greater the probability of receiving a GCO is. We also include leverage (LEV), long-term debt (LTDT), and the change in long-term debt (CLTDT) (Mutchler, Hoopwood, and McKeown 1997); in addition, we use firms with a loss (LOSS) as control variables because such firms have a high risk of business failure. Altman’s (1968) Z-score is included as a proxy for the risk of bankruptcy (Mutchler 1985); in addition, cash flow from operations (CFO), cash and cash equivalents (CASH), and return on assets (ROA) are used as proxies for operational performance and liquidity (Mutchler, Hoopwood, and McKeown 1997; DeFond, Ragunandan, and Subramanyam 2002; Fargher and Jiang 2008). Big 4 is included as a control variable because firms audited by a Big 4 accounting firm have a high probability of receiving a GCO based on a Big 4 audit firm’s high auditing quality (DeAngelo 1981). The inverse mills ratio, estimated in the first stage, is included as a control variable in the two-stage model used to test the hypotheses.
1st stage:
Probit (GCOit) = α0 +α1ABS_DAit-1 +α2LnSALEit +α3LEVit +α4ROAit +α5CASHit
+α6 Zit +α7CZit +α8CFOit +α9LTDTit +α10CLTDTit +α11BIG4it
+α12LOSSit+εit (1)
See the Appendix for definitions of the variables.
This study uses Kothari, Leone, and Wasley’s (2005) model to estimate discretionary accruals based on the modified Jones (1991) model with reflected firm performance (ROA). Discretionary accruals are measured using the coefficients of model (2), estimated for non-GCO firms by year and industry. The estimated discretionary accruals are then used in model (3) for GCO firms.
TAit= c1 + c2 (ΔSALEit-ΔARit) + c3PPEit + c4ROAit +εit (2)
DAit = TAit-〔č1+ č2 (ΔSALEit-ΔARit) + č3PPEit + č4ROAit〕 (3)
DA (PO_ or NE_DA)it = b10 + b11 GCOit + b12 Lambda +b13 SIZEit + b14 BTMit + b15 LEVit
+ b16 CFOit + b17 GRWit + b18 ABS_TAit + b19Zit + b20BIG4it
+ b21LOSSit + b22ROAit-1 + b 23ROAit-12 +∑ID + ∑YR+ εit (4)
See the Appendix for definitions of the variables.
To analyze the relationship between GCOs and discretionary accruals, we formulate model (4) in which the dependent variable is discretionary accruals, and the independent variables are firms that receive GCOs for the current fiscal year’s financial statements. We expect that the coefficient (b11) is significant and positive.
signifies higher operating risk. Lagged ROA and ROA squared are included to control for a non-linear relationship between firm performance and discretionary accruals (Butler, Leone, and Willenborg 2004; Kothari, Leone, and Wasley 2005).
3.1.2 Hypothesis Testing Model
Dichev and Tang (2008) estimate the degree of matching by regressing prior, current, and next year’s expenses on current revenues. The regression coefficients, a1, a2, and a3, represent the respective degrees of early, neutral, and delayed recognition of expenses in regression model (5). A larger positive a2 denotes a higher degree of matching, which means that the firm exhibits proper matching between current expenses and current revenues. A larger positive a1 indicates earlier recognition of current expenses, which is consistent with conservative accounting; and a larger positive a3 indicates delayed recognition of current expenses, which is consistent with aggressive accounting.
REVit = a0 + a1 EXPit-1 + a2 EXPit + a3 EXPit+1 + eit (5)
REVit = a10 + a11GCOit + a12EXPit-1 + a13GCOit*EXPit-1 + a14EXPit (6)
+ a15GCOit*EXPit+ a16EXPit+1 + a17GCOt*EXPit+1 + eit
See the Appendix for definitions of the variables.
Equation (6) is used to examine the degree of matching of firms that receive GCOs. In equation (6), variables of interest include the interactions between firms with GCOs and expenses in prior, current, and subsequent years (for which the coefficients are a13, a15, and a17, respectively). We expect that the coefficient a15 for neutral accounting will be significant and negative (-), whereas the coefficients a13 and a17 will be significant and positive (+).
To test hypothesis 2, we divide firms with GCOs into three portfolios by discretionary accruals and determine matching types for firms with the highest and lowest discretionary accruals. We expect that the group with the highest discretionary accruals uses aggressive accounting, i.e., recognizes current expenses in a delayed manner, whereas the group with the lowest accruals uses conservative accounting, i.e., recognizes current expenses earlier, leading to downward earnings management. To determine the types of matching exhibited by firms with GCOs, as indicated by discretionary accruals, we employ regression model (7). We expect that the coefficient (b35) for the interaction between the lowest discretionary group and prior period expenses (LDA*EXPt-1) and the coefficient (b40) for the interaction between the highest discretionary group and subsequent period expenses (HDA*EXPt+1) will both be significant and positive (+).
REVt = b30 + b31HDAit + b32LDAit + b33EXPit-1 + b34HDAit*EXPit-1 (7)
+ b35LDAit*EXPit-1 + b36EXPit+ b37HDAit*EXPit + b38LDAit*EXPit
+ b39EXPit+1 + b40HDAit*EXPit+1 + b41LDAit*EXPit+1 + et
See the Appendix for definitions of the variables.
Although firms with GCOs are characterized by the same uncertainty, they may have different financial reporting characteristics owing to differing levels of financial distress. Therefore, we test ways in which the matching of firms that receive GCOs changes, using the debt-equity ratio, firm performance, and negative equity as firms’ characteristic variables. To test hypothesis 3, firms with GCOs are divided into three portfolios according to debt-to-equity ratio (LEV). Firms with negative equity that receive GCOs are found in the highest debt-to-equity ratio portfolio, which is more severely financially distressed. We use only the highest and lowest portfolios in regression model (8). For GCO firms with the highest debt-to-equity ratios and negative equity, we test the hypothesis that they use conservative accounting. To support hypothesis 3, coefficients a34 and a53 would be significant and positive (+).
the highest and lowest firm performance, we test the hypothesis that firms with the lowest ROAs use aggressive accounting. To support hypothesis 3, the coefficient a81 would be significant and positive (+).
REVit = a30 + a31HLEVit + a32LLEVit + a33EXPit-1 + a34HLEVt*EXPit-1 (8)
+ a35LLEV*EXPit-1 + a36EXPit + a37HLEV*EXPit + a38LLEVit*EXPit
+ a39EXPit+1 + a40HLEVit*EXPit+1 + a41LLEVit*EXPit+1 + eit
REVit = a50 + a51NEGEQit+ a52EXPit-1 + a53NEGEQit*EXPit-1 + a54EXPit (9)
+ a55NEGEQit*EXPit + a56EXPit+1+ a57NEGEQit*EXPit+1 + eit
REVit = a70 + a71HROAit + a72 LROA it+ a73EXP it-1+ a74 HROAit*EXPit-1 (10)
+ a75 LROA*EXP it-1+ a76EXPit-1+ a77 HROAit*EXP it+ a78 LROAit*EXPit
+ a79 EXP it+1+ a80HROAit*EXP it+1+ a81 LROAit*EXPit+1 + eit
See the Appendix for definitions of the variables.
3.2 Sample Selection
The sample is selected from firms listed on the Korea Stock Exchange (KSE) and the Korea Dealers Automated Quotation (KOSDAQ) during the years 2000 to 2010. Firms that receive GCOs are manually collected from audit reports in the Data Analysis, Retrieval and Transfer (DART) System (http://dart.fss.or.kr). We extract the firms that receive unqualified opinions but have separately identified a GCO in the explanatory paragraph of the external audit reports; these we designate as firms that receive GCOs. Because of differences in the information contents of the other audit opinions, we exclude firms with qualified, adverse, or disclaimer opinions in the audit reports. We also exclude financial firms because they have a different financial data composition than non-financial firms. More specifically, the sample is limited to firms that satisfy the following conditions:
(1) Companies listed on KSE and KOSDAQ of the Korean capital markets, (2) Non-financial firms, and
(3) Firms for which financial data can be retrieved from KIS-VALUE and the TS-2000 database.
The sample from KSE and KOSDAQ listed firms, excluding financial companies, includes 20,413 firm-year observations. Among these, firms that receive GCOs generate 1,232 firm-year observations during the sample period after excluding years from 1999, the year that auditing standards for GCOs changed. In addition, 2,089 firm-year observations were eliminated because of missing financial data. Because firms that receive GCOs experience extreme financial stress, the distribution of such firms is skewed to one side. To minimize the loss of firms that received audit opinions, we separate firms into two groups: those that received GCOs and those that did not receive GCOs. In addition, we truncate the sample by eliminating outliers that lie beyond the top and bottom 0.5% of each variable. As a result, 149 firm-year observations of firms with GCOs and 3,860 firm-year observations of firms without GCOs are removed. The final sample includes 1,083 firm-year observations of firms with GCOs and 13,232 firm-year observations of firms without GCOs for a total of 14,315 firm-year observations.
Table 1. Firms with GCOs by year
Year No. of Obs. Non-GCO firms GCO firms
2000 945 881 64
2001 1,113 1,067 66
2002 1,230 1,142 98
2003 1,327 1,210 117
2004 1,317 1,199 118
2005 1,334 1,254 80
2006 1,377 1,283 94
2007 1,425 1,310 115
2008 1,471 1,277 194
2009 1,394 1,296 98
2010 1,352 1,313 39
Total 14,315 13,232 1,083
4. EMPIRICAL RESULTS
4.1 Descriptive Statistics
Panel A of Table 2 provides descriptive statistics for the total sample. Panel B provides descriptive statistics for firms that received GCOs and firms that did not receive GCOs along with the p-values used in t-tests and non-parametric tests of equality between the two groups (t-test and Wilcoxon signed rank test). There are significant differences with respect to most variables for firms that received GCOs and firms that did not. The means of prior and current expenses are both below 1.0, whereas the mean of next-year expenses is above 1.0, showing low neutrality accounting and delayed recognition of current expenses. Firms with GCOs appear to have higher prior, current, and next-year expenses compared with firms without GCOs. The size (SIZE) of firms with GCOs is smaller, and the growth rates (GRW) and market-to-book value ratios (BTM) are lower for such firms than for firms without GCOs. Whereas cash flow from operations (CFO) of firms with GCOs is significantly low, firm losses (LOSS) and long-term debt (LTDT) are substantially higher than those for firms without GCOs. However, the change in LTDT, which is the difference between long-term debt in the prior period and current period, is significantly low, meaning that the long-term debts of firms with GCOs are reduced. This condition aggravates operating cash flow. Moreover, the debt-to-equity ratios of firms with GCOs appear to be high, whereas the Altman Z-scores (Z) of firms with GCOs are significantly low, implying that the risk of bankruptcy is high. In other words, the financial stress of firms with GCOs is significantly higher than that of firms without GCOs.
Table 2. Descriptive statistics
Panel A. Total Sample (n=14,315)
Variable Mean Median Std Min Q1 Q3 Max
REVt 1.001 0.937 0.713 0.000 0.607 1.313 24.490
EXPt+1 1.071 0.968 0.585 0.006 0.695 1.307 23.915
EXPt 0.985 0.920 0.705 0.000 0.614 1.278 30.326
EXPt-1 0.985 0.921 0.786 0.000 0.606 1.287 38.972
DA -0.001 0.005 0.108 -4.215 -0.055 0.060 3.954
SIZE 18.274 18.069 1.338 13.350 17.344 18.986 23.728
CFO 0.036 0.045 0.135 -1.994 -0.018 0.107 0.689
ROA 0.040 0.047 0.120 -1.491 0.006 0.097 0.496
BIG4 0.476 0.000 0.499 0.000 0.000 1.000 1.000
LEV 1.151 0.746 3.641 -55.430 0.373 1.335 45.192
Z 2.648 2.388 3.104 -45.990 1.528 3.490 69.183
GRW 0.171 0.064 8.046 -4.580 -0.055 0.192 91.396
CASH 0.074 0.045 0.087 0.000 0.016 0.099 1.201
LTDT 0.051 0.014 0.127 0.000 0.000 0.064 8.220
LOSS 0.265 0.000 0.441 0.000 0.000 1.000 1.000
(Table 2 continued)
Panel B. Sample by GCO (n=1,083) and non-GCO (n=13,232)
Variable Group Mean Median Std Min Q1 Q3 Max t-stat. Wilcoxon z-stat.
REVt GCO Non-GCO 0.802 1.019 0.965 0.625 1.499 0.651 0.000 0.000 0.332 0.641 0.959 1.336 12.758 30.065 -9.17*** -17.80***
EXPt+1 GCO Non-GCO 1.258 1.056 0.960 1.070 0.532 1.010 0.006 0.015 0.741 0.692 1.292 1.523 23.915 4.811 -11.03*** -7.80***
EXPt GCO Non-GCO 1.118 0.974 0.917 0.949 1.359 0.621 0.000 0.000 0.650 0.612 1.330 1.273 12.675 30.326 -6.48*** -2.65***
EXPt-1 GCO Non-GCO 1.109 0.974 0.927 0.921 0.653 1.692 0.000 0.000 0.610 0.605 1.337 1.283 12.675 38.972 -5.31*** -1.54
DA GCO -0.014 0.048 0.571 -4.215 -0.161 0.215 3.954 2.36** 7.15***
Non-GCO -0.001 0.004 0.108 -1.062 -0.052 0.055 0.774
SIZE GCO 17.351 17.265 1.201 13.350 16.627 17.860 22.705 24.07*** 25.15***
Non-GCO 18.410 18.184 1.298 15.447 17.497 19.080 23.728
CFO GCO -0.160 -0.101 0.249 -1.994 -0.243 -0.008 0.689 54.61*** 36.29***
Non-GCO 0.052 0.051 0.103 -0.487 -0.005 0.111 0.496
ROA GCO -0.179 -0.143 0.202 -1.491 -0.261 -0.045 0.263 72.93*** 44.90***
Non-GCO 0.054 0.049 0.088 -0.405 0.013 0.098 0.496
BIG4 GCO 0.321 0.000 0.467 0.000 0.000 1.000 1.000 10.62*** 10.57***
Non-GCO 0.498 0.000 0.500 0.000 0.000 1.000 1.000
LEV GCO Non-GCO 3.168 0.962 0.712 1.377 12.002 1.013 -55.430 -7.875 0.338 0.366 3.499 1.248 26.957 45.192 -19.74*** -12.81***
Z GCO -1.841 -1.008 5.085 -45.990 -3.523 0.448 69.183 54.35*** 47.85***
Non-GCO 3.050 2.526 2.583 -4.063 1.737 3.657 36.800
GRW GCO Non-GCO -0.042 0.186 -0.160 0.070 1.749 8.458 -4.580 -2.654 -0.532 -0.038 0.105 0.192 91.396 39.531 10.87*** 20.53***
CASH GCO 0.055 0.017 0.109 0.000 0.004 0.054 1.201 7.41*** 17.31***
Non-GCO 0.074 0.048 0.082 0.000 0.018 0.100 0.635
LTDT GCO 0.101 0.003 0.379 0.000 0.000 0.063 8.220 -13.67*** 3.91***
Non-GCO 0.044 0.013 0.069 0.000 0.000 0.061 0.997
LOSS GCO 0.917 1.000 0.276 0.000 1.000 1.000 1.000 -55.79*** -50.56***
Non-GCO 0.221 0.000 0.415 0.000 0.000 0.000 1.000 1) ***, ** and * denote statistical significance at the 1, 5 and 10 percent levels in a two-tailed test, respectively. 2) Mean difference is t-test, and median difference is non-parametric (Wilcoxon two-sample test, two-sided). 3) See the Appendix for definitions of the variables.
4.2 Correlation Analysis
Table 3. Correlation analysis (Pearson/Spearman)
DA GCO REV EXPt-1 EXPt EXPt+1 SIZE BTM LEV Z GRW LTDT LOSS
DA 1 (0.018) -0.019 (<.0001) 0.203 (<.0001) -0.099 (<.0001) 0.153 (<.0001) 0.180 (<.0001) 0.057 (0.000) 0.033 (0.171)) 0.011 (<.0001) 0.211 (0.049) -0.017 (<.0001) -0.037 (<.0001) -0.137
GCO (<.0001) 0.059 1 (<.0001) -0.076 (<.0.001) 0.091 (<.0001) 0.054 (<.0001) 0.046 (<.0001) -0.197 (<.0001) -0.078 (<.0001) 0.162 (<.0001) -0.413 (0.381) -0.007 (<.0001) 0.113 (<.0001) 0.422
REV (0.200) -0.010 (<.0001) -0.148 1 (<.0.001) 0.618 <.0001) 0.914 (<.0001) 0.667 (0.000) 0.030 (0.277) -0.010 (0.106) -0.013 (<.0001) 0.149 (0.027) -0.019 (<.0001) -0.063 (<.0001) -0.103
EXPt-1 (<.0001) -0.083 (<.0001) 0.065 (<.0001) 0.617 11 (<.0001) 0.667 (<.0001) 0.603 (<.0001) -0.096 (0.234) -0.011 (0.000) 0.028 (<.0001) -0.01 (0.857) -0.001 (0.085) -0.014 (0.160) -0.011
EXPt (0.179) -0.011 (0.008) 0.022 (<.0001) 0.931 (<.0001) 0.671 1 (<.0001) 0.725 (0.018) -0.019 (0.181) -0.012 (0.668) 0.003 (0.000) 0.030 (0.014) -0.021 (<.0001) -0.056 (0.461) 0.006
EXPt+1 (0.007) 0.023 (0.124) 0.013 (<.0001) 0.599 (<.0001) 0.583 (<.0001) 0.643 1 (0.221) 0.010 (0.449) -0.007 (0.307) 0.008 (<.0001) 0.041 (0.236) -0.010 (<.0001) -0.057 (0.406) 0.007
SIZE (0.007) 0.022 (<.0001) -0.210 (<.0001) 0.053 (<.0001) -0.099 (0.005) -0.023 (0.269) 0.009 1 (0.029) 0.020 (<.0001) 0.058 (<.0001) 0.057 (0.852) 0.001 (0.459) 0.006 (<.0001) -0.197
BTM 0.057 (<.0001) -0.068 (<.0001) -0.087 (<.0001) -0.026 (0.004) -0.084 (<.0001) -0.075 (<.0001) 0.163 (<.0001) 1
0.046 (<.0001) -0.016 (0.090) -0.006 (0.428) -0.184 (<.0001) -0.035 (0.000)
LEV (0.116) 0.013 (<.0001) 0.107 (<.0001) 0.096 (<.0001) 0.254 (<.0001) 0.160 (<.0001) 0.141 (<.0001) 0.189 (<.0001) 0.076 1 (<.0001) -0.105 (0.992) 0.000 (<.0001) 0.079 (<.0001) 0.098
Z (<.0001) 0.063 (<.0001) -0.399 (<.0001) 0.312 (<.0001) 0.162 (<.0001) 0.158 (<.0001) 0.137 (0.593) 0.004 (<.0001) -0.427 (<.0001) -0.468 1 (0.980) -0.000 (<.0001) -0.210 (<.0001) -0.384
GRW -0.008 (0.341) -0.180 (<.0001) -0.042 (<.0001) 0.180 (<.0001) -0.086 (<.0001) -0.046 (<.0001) 0.064 (<.0001) -0.115 (<.001) 0.038 (<.0001) 0.240 (<.0001) 1
-0.003 (0.671) -0.013 (0.114) LTDT 0.032 (0.001) -0.032 (<.0001) -0.035 (<.0001) -0.000 (0.976) -0.047 (<.0001) -0.048 (<.0001) 0.102 (<.0001) 0.092 (<.0001) 0.426 (<.0001) -0.227 (<.0001) 0.081 (<.0001) 1
0.048 (<.0001)
LOSS (<.0001) -0.136 (<.0001) 0.422 (<.0001) -0.164 (0.000) -0.029 (0.032) -0.079 (0.101) -0.014 (<.0001) -0.208 (<.0001) -0.045 (<.0001) 0.151 (<.0001) -0.532 (<.0001) -0.287 (<.0001) -0.041 1
1) The numbers above (below) the diagonal are Pearson (Spearman) correlation coefficients. p-value are in parentheses. 2) See the Appendix for definitions of the variables.
4.3 Multivariate Regression Model
4.3.1 Type of Matching of Revenues and Expenses for GCO Firms
Table 4. Revenue-expense matching and GCO firms
REVit = a0 + a1GCOit + a2EXPit-1 + a3GCOit*EXPit-1 + a4EXPit + a5GCOit*EXPit (6)
+ a6EXPit+1 + a7GCOit*EXPit+1 + eit
Variable Coefficient (t-stat.)
Intercept 0.050*** (7.97)
GCOit -0.454*** (-19.34)
EXPit-1 -0.000 (-0.02)
GCOit*EXPt-1 0.277*** (21.59)
EXPit 0.998 (91.03)
GCOit *EXPit -0.463*** (-26.60)
EXPit+1 0.013 (1.23)
GCOit*EXPit+1 0.087*** (5.06)
No. of Obs. 14,315
F statistics 6,299
Adj. R2 0.803
1) ***, ** and * denote statistical significance at the 1, 5 and 10 percent levels in a two-tailed test, respectively. 2) See the Appendix for definitions of the variables.
4.3.2 Type of Matching of Firms that Receive GCOS Depending on the Level of Discretionary Accruals
Table 5 depicts the results of matching GCO firms within the highest and lowest portfolios. As expected, the coefficient for the group with the lowest discretionary accruals (LDA*EXPt-1) is significant and positive (+), with a value of 0.231; this result indicates that this group may use early recognition of current expenses on current revenues (i.e., conservative accounting) or downward earnings management. Conversely, the coefficient for the group with the highest discretionary accruals is 0.039, which is positive (+) and marginally significant at the 10% level, implying that this group may choose aggressive accounting. This result is consistent with hypothesis 2, which suggests that GCO firms with the highest positive (+) discretionary accruals are associated with aggressive accounting through recognition of current expenses later; however, firms with the lowest negative (-) discretionary accruals are associated with conservative accounting through recognition of current expenses.
Table 5. Matching of firms with GCOs with the highest and lowest discretionary accruals
REVt = b30 + b31HDAit + b32LDAit + b33EXPit-1 + b34HDAit*EXPit-1 (7)
+ b35LDAit*EXPit-1 + b36EXPit+ b37HDAit*EXPit + b38LDAit*EXPit
+ b39EXPit+1 + b40HDAit*EXPit+1 + b41LDAit*EXPit+1 + et
Variable Coefficient REV (t-stat.)
Intercept -0.173** (-2.54)
HDAit 0.018 (0.15)
LDAit 0.362** (2.44)
EXPit-1 0.362** (2.57)
HDAit*EXPit-1 -0.058 (-0.69)
LDAit*EXPit-1 0.231** (2.32)
EXPit 0.755*** (9.85)
HDAit *EXPit -0.068 (-0.52)
LDAit *EXPit -0.652*** (-6.26)
EXPit+1 0.027 (0.40)
HDAit*EXPit+1 0.039* (1.61)
LDAit*EXPit+1 0.050 (0.48)
No. of Obs. 1,083
F statistics 185.07
Adj. R2 0.667
4.3.3 Conservative Accounting of GCO Firms Through the Matching Principle
Table 4 shows that conservative or aggressive accounting is applied to the same firms with GCOs. This result indicates that firms with the same uncertainty of continuing as a going-concern may report their financial performances differently according to the level of firms’ financial distress. Therefore, it is necessary to analyze how the matching principle differs depending on the debt-to-equity ratio (LEV), negative equity (NEGEQ), and firm performance (ROA) as financial characteristics variables. This study partitions the full sample by debt-to-equity ratio and firm performance into three portfolios and then uses the highest and lowest portfolios as dummy variables in the regression.
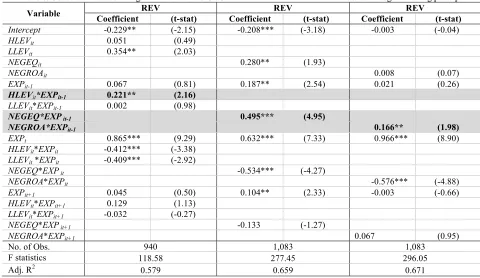
Table 6 indicates the results of the matching principle for firms with GCOs in the highest and lowest portfolios partitioned by debt-to-equity ratio. In addition, the table depicts the relationship between current revenues and prior-, current- and following-period recognition of expenses for GCO firms with negative equity (i.e.prior-, impaired capital) and losses (i.e., negative ROA). Both the highest and lowest groups exhibit low neutrality in accounting, which is similar to the results presented in Table 4. However, the coefficient for early recognition of current expenses for the highest debt-to-equity portfolio is significant and positive (+), whereas the coefficient for neutral recognition is significantly negative (-), which indicates low neutral accounting. This result supports hypothesis 3, suggesting the existence of income-decreasing earnings management via conservative accounting that recognizes current expenses in an accelerated manner. Conversely, the coefficient for the interaction between delayed recognition of current expenses and a high debt-to-equity ratio is insignificantly related to current revenues. These firms are in serious financial trouble with regard to negative equity and loss, which may increase the risk of firm failure and result in a conservative audit (Lu and Sapra 2009). An auditor’s conservative approach may prevent a manager’s intended intervention in accounting choices. Consequently, these firms exhibit conservative accounting that recognizes current expenses early. The coefficient for the interaction between prior-period expenses and negative equity (NEGEQ*EXPt-1) of firms with GCOs is 0.495 (t=4.95), which is positive (+) and significant at the 1% level. The coefficient for the interaction between prior period expenses and negative equity (NEGROA*EXPt-1) of GCO firms is 0.166 (t=1.98), which is positive (+) and significant at the 5% level. This result is also consistent with hypothesis 3, implying that conservative accounting that recognizes current expenses early is applied to GCO firms with impaired capital or losses. Conversely, firms with negative equity that receive GCOs may attempt mass asset disposal (Kim, Sin, and Lee 2014); in addition, such firms are more likely to be involved in default on the redemption of debt, delisting, and designation of investment consideration.4
Table 6. Conservative accounting of firms received GCOs with financial characteristic variables through matching principle
Variable Coefficient REV (t-stat) Coefficient REV (t-stat) Coefficient REV (t-stat)
Intercept -0.229** (-2.15) -0.208*** (-3.18) -0.003 (-0.04)
HLEVit 0.051 (0.49)
LLEVit 0.354** (2.03)
NEGEQit 0.280** (1.93)
NEGROAit 0.008 (0.07)
EXPit-1 0.067 (0.81) 0.187** (2.54) 0.021 (0.26)
HLEVit*EXPit-1 0.221** (2.16) LLEVit*EXPit-1 0.002 (0.98)
NEGEQ*EXP it-1 0.495*** (4.95)
NEGROA*EXPit-1 0.166** (1.98)
EXPt 0.865*** (9.29) 0.632*** (7.33) 0.966*** (8.90)
HLEVit*EXPit -0.412*** (-3.38)
LLEVit *EXPit -0.409*** (-2.92)
NEGEQ*EXP it -0.534*** (-4.27)
NEGROA*EXPit -0.576*** (-4.88)
EXPit+1 0.045 (0.50) 0.104** (2.33) -0.003 (-0.66)
HLEVit*EXPit+1 0.129 (1.13)
LLEVit*EXPit+1 -0.032 (-0.27)
NEGEQ*EXP it+1 -0.133 (-1.27)
NEGROA*EXPit+1 0.067 (0.95)
No. of Obs. 940 1,083 1,083
F statistics 118.58 277.45 296.05
Adj. R2 0.579 0.659 0.671
1) ***, ** and * denote statistical significance at the 1, 5 and 10 percent levels in a two-tailed test, respectively. 2) See the Appendix for definitions of the variables.
4.3.4 Aggressive Accounting of GCO Firms Within the Lowest ROA Portfolio
Table 7. Aggressive accounting of firms with GCOs within the lowest ROA portfolio
REVit + a75LROAit*EXPit-1 + a76EXPit+ a77HROAit*EXPit + a78LROAit*EXPit (10)
+ a75LROAit*EXPit-1 + a76EXPit+ a77HROAit*EXPit + a78LROAit*EXPit
+ a79EXPit+1 + a80HROAit*EXPit+1 + a81LROAit*EXPit+1 + eit
Variable Coefficient REV (t-stat.)
Intercept -0.112*** (-3.15)
HROAit 0.125** (2.41)
LROAit 0.082** (2.15)
EXPit-1 0.176*** (2.91)
HROAit*EXPit-1 -0.126 (-1.64)
LROAit*EXPit-1 0.064 (0.43)
EXPit 0.759*** (7.26)
HROAit *EXPit 0.166 (1.52)
LROAit *EXPit -0.523*** (-4.23)
EXPit+1 -0.034 (-0.70)
HROAit*EXPit+1 0.073* (1.68)
LROAit*EXPit+1 0.164*** (2.79)
No. of Obs. 1,083
F statistics 242.75
Adj. R2 0.682
1) ***, ** and * denote statistical significance at the 1, 5 and 10 percent levels in a two-tailed test, respectively. 2) See the Appendix for definitions of the variables.
4.3.5 Financial Reporting Quality and GCO Firms
Table 8. Discretionary accruals of firms with GCOs, using Heckman (1979)'s 2 SLS
1st stage: Probit (GCOit) = α0 +α1ABS_DAit-1 +α2LnSALEit +α3LEVit +α4ROAit +α5CASHit
+α6 Zit +α7CZit +α8CFOit +α9LTDTit +α10CLTDTit +α11BIG4it +α12LOSSit+εit
(1)
2nd- stage: DAit (PO_ or NE_DA)it = b10 + b11 GCOit + b12 Lambda +b13 SIZEit + b14 BTMit + b15 LEVit
+ b16 CFOit + b17 GRWit + b18 ABS_TAit + b19Zit + b20BIG4it
+ b21LOSSit + b22ROAit-1 + b 23ROAit-12 +∑ID + ∑YR+ εit
(4)
Variable Coefficient (p-value)1st stage Coefficient (t-stat.)DA Coefficient (t-stat.)PO_DA Coefficient (t-stat.)NE_DA Intercept -0.149 0.728 0.018 (1.01) -0.064** (-2.37) -0.187 (-7.20)
ABS_DAit-1 1.947*** <.0001
LnSALEit -0.117*** <.0001
LEVit 0.071*** <.0001
ROAit -4.099*** <.0001
CASHit -1.233*** 0.000
Zit -0.103*** <.0001 0.006*** (14.77) 0.003*** (5.16) -0.002*** (-18.17)
CZit 0.000 0.845
CFOit -1.649 <.0001 -0.857*** (-72.32) -0.445*** (16.58) -0.732*** (-32.95)
LTDTit 2.514*** <.0001
CLTDTit -2.032*** <.0001
BIG4it -0.106* 0.052 0.001 (0.60) -0.004 (-1.45) -0.002 (-0.66)
LOSSit 0.640*** <.0001 -0.079*** (-26.38) -0.045*** (-8.99) -0.076*** (-18.16)
GCOit 0.193*** (16.80) 0.191*** (11.85) -0.414*** (-23.10)
Lambda -0.038*** (-6.11) -0.065*** (-7.26) 0.144*** (14.63)
SIZEit 0.003*** (3.00) 0.005*** (3.47) 0.009*** (6.91)
BTMit 0.000 (0.96) 0.000 (0.58) -0.000*** (-3.22)
LEVit 0.002*** (3.07) 0.004*** (3.86) 0.006*** (7.24)
GRWit 0.003** (2.22) 0.000 (0.70) -0.006 (-1.49)
ABS_TAit -0.619*** (-61.05) 0.516*** (17.40)
ROAit-1 0.066*** (5.06) 0.000 (0.02) 0.085*** (3.99)
ROA2
it-1 0.052 (1.41) 0.003 (0.07) -0.309*** (-4.29)
No. of Obs. 14,315 14,315 7,452 6,773
F statistics 771.51 162.52 193.99
Max-rescaled/Adj. R2 0.637 0.537 0.313 0.368
1) ***, ** and * denote statistical significance at the 1, 5 and 10 percent levels in a two-tailed test, respectively. 2) See the Appendix for definitions of the variables.
5. CONCLUSION
This study examines whether firms that receive GCOs use accelerated or delayed recognition of current expenses as a method of earnings management depending on firm characteristic variables. We expect that these firms will make different accounting choices according to their financial distress levels and will exhibit low neutrality of matching owing to various incentives in making accounting choices. Low neutrality in accounting will cause early or delayed recognition of current expenses on current revenues.
This study found that firms with GCOs either delay or accelerate recognition of current expenses for current revenues according to their financial conditions. We also found that firms in more severe financial distress, such as higher leverage, loss, and impaired capital, exhibit conservative accounting, which accelerates the recognition of current expenses for current revenues. Conversely, GCO firms in relatively less financial trouble exhibit aggressive accounting, which delays recognition of current expenses. Consistent with the fact that upward (downward) earnings management usually involves positive (negative) discretionary accruals, by estimating the regression of positive (+) and negative (-) discretionary accruals on current revenues, we also found that only GCO firms with negative (-) discretionary accruals adopt conservative accounting.
providing empirical evidence that for these firms, earnings management can be better explained by the matching extent or behavior related to discretionary accruals as a proxy for the earnings management approach of firms with GCOs. One key implication of this study is that investors and other stakeholders can use the information obtained on the relationship between revenue-expense matching and financial reporting characteristics of GCO firms to assist them in investment decisions and policies. Because this study uses only Korean data, the results may be limited in terms of generalization and comparability. However, this paper broadly demonstrates that firms with GCOs exhibit different financial reporting behaviors depending on their financial characteristic variables. Future research is needed to verify the financial reporting characteristics of firms that do not receive subsequent GCOs in the following year.
ACKNOWLEDGEMENTS
This manuscript has not been published previously and is not under consideration by another publisher or journal.
AUTHOR BIOGRAPHIES
Hakwoon Kim (First Author)is a visiting professor at Business School, SungKyunKwan University, South Korea. He received his Ph.D. from SungKyunKwan University. His research areas include going-concern audit report, financial reporting, earnings management, earnings quality, conservatism, and value relevance. Email:
hankkim@skku.edu.
Sooro Lee (Corresponding Author) is a professor at Business School, Hyupsung University, South Korea. He received his Ph.D. from SungKyunKwan University. His research areas include financial reporting, earnings management, earnings quality, conservatism, and value relevance. Email: srlee1008@uhs.ac.kr
REFERENCES
Altman, E. I. 1968. “Financial Ratios, Discriminant Analysis and the Prediction of Corporate Bankruptcy” Journal of Finance 23 (4): 589-609.
Amedo, L., F. Lizarraga, and S. Sanchez. 2008. “Going-Concern Uncertainties in Pre-Bankrupt Audit Reports: New Evidence Regarding Discretionary Accruals and Wording Ambiguity” International Journal of Auditing 12 (10): 25-44. Bartov, E., F. A. Gul, and J. S. L. Tsui. 2000. “Discretionary-Accruals Models and Audit Qualifications.” Journal of Accounting
and Economics 30 (3): 421-451.
Basu, S. 1997. “The Conservatism Principle and the Asymmetric Timeliness of Earnings” Journal of Accounting and Economics 24 (1): 3-37.
Becker, C. L., M. L. DeFond, J. Jiambalvo, and K. R. Subramanyam. 1998. “The Effect of Audit Quality on Earnings Management.” Contemporary Accounting Research 15 (1): 1-24.
Bhattacharya, U., H. Daouk, and M. Welker. 2003. “The World Price of Earnings Opacity.” The Accounting Review 78 (3): 641-678.
Bradshaw, M. T., S. A. Richardson, and R. G. Sloan. 2001. “Do Analysts and Auditors Use Information in Accruals?” Journal of
Accounting Research 39 (1): 45-74.
Butler, M., A. J. Leone, and M. Willenborg. 2004. “An Empirical Analysis of Auditor Reporting and Its Association with Abnormal Accruals.” Journal of Accounting and Economics 37 (2): 139-165.
Carson, E., N. L. Fargher, M. A. Geiger, C. S. Lennox, K. Raghunandan, and M. Willekens. 2013. “Audit Reporting for Going-Concern Uncertainty: A Research Synthesis.” Auditing: a Journal of Practice and Theory 32 (Suppl. 1): 353-384. Collins, D. W., E. L. Maydew, and I. S. Weiss. 1997. “Change in the Value-Relevance of Earnings and Book Values over the
Past Forty Year.” Journal of Accounting and Economics 24 (1): 39-67.
DeAngelo, H., L. DeAngelo, and D. J. Skinner. 1994. “Accounting Choice in Troubled Companies.” Journal of Accounting and
Economics 17 (1–2): 113-143.
DeAngelo, L. E. 1981. “Auditor Independence, ‘Low Balling’, and Disclosure Regulation” Journal of Accounting and
Economics 3 (2): 113-127.
Dechow, P. M. 1994. “Accounting Earnings and Cash Flows as Measures of Firm Performance: The Role of Accounting Accruals.” Journal of Accounting and Economics 18 (1): 3-42.
DeFond, M. L., and J. Jiambalvo. 1994. “Debt Covenant Violation and Manipulation of Accruals.” Journal of Accounting and
Economics 17 (1–2): 145-176.
DeFond, M. L., and K. R. Subramanyam. 1998. “Auditor Changes and Discretionary Accruals.” Journal of Accounting and
DeFond, M. L., K. Ragunandan, and K. R. Subramanyam. 2002. “Do Non-audit Service Fees Impair Auditor Independence? Evidence from Going-Concern Audit Opinion” Journal of Accounting Research 40: 1247-1274.
Dichev, I. D., and V. W. Tang. 2008. “Matching and the Changing Properties of Accounting Earnings over the Last 40 Years.”
The Accounting Review 83 (6): 1425-1460.
Donelson, D. C., R. Jennings, and J. McInnis. 2011. “Changes over Time in the Revenue-Expense Relation: Accounting or Economics?” The Accounting Review 86 (3) : 945-974.
Fargher, N. L., and L. Jiang. 2008. “Changes in the Audit Environment and Auditors’ Propensity to Issue Going-Concern Opinions” Auditing: A Journal of Practice & Theory 27 (2): 55-77.
Francis, J., and K. Schipper. 1999. “Have Financial Statements Lost Their Relevance?” Journal of Accounting Research 37 (2): 319-352.
Geiger, M. A., and D. V. Rama. 2006. “Audit Firm Size and Going-Concern Reporting Accuracy.” Accounting Horizons 20 (1): 1-17.
Gramling, A. A., J. Krishnan, and Y. Zhang. 2011. “Are PCAOB-Identified Audit Deficiencies Associated with a Change in Reporting Decisions of Triennially Inspected Audit Firms?” Auditing: a Journal of Practice and Theory 30 (3): 59-79. Heckman, J. J. 1979. “Sample Selection Bias as a Specification Error” Econometrica 47 (1): 153-161.
Holthausen, R. W., D. F. Larcker, and R. G. Sloan. 1995. “Annual Bonus Schemes and the Manipulation of Earnings.” Journal of
Accounting and Economics 19 (1): 29-74.
Hyun, J. H., T. S. Ahn, S. Oh, and H. Cho. 2014. “The Changes in Matching between Revenue and Expense: The Effect of Financial Structures.” [in Korean] KoreanAccounting Review 39 (1): 43-76.
Jones, J. J. 1991. “Earnings Management During Import Relief Investigations.” Journal of Accounting Research 29 (2): 193-228. Kaplan, S. E., and D. D. Williams. 2013. “Do Going Concern Audit Reports Protect Auditors from Litigation? A Simultaneous
Equations Approach” The Accounting Review 88 (1): 199-232.
Kim, H. W. 2013. “Financial Reporting Characteristics of Going-Concern Opinion Firms” [in Korean] KoreanAccounting
Journal 22 (6): 143-178.
Kim, H. W., H. Son, and H. I. Lee. 2013. “Unqualified Opinion with Going-Concern and Conservatism.” [in Korean] Korean
Accounting Journal 22 (1): 77-105.
Kim, H. W., Y. Sin, and H. I. Lee. 2014. “Earnings Management by Turnaround Strategy Reported in the Going-Concern Audit Report” KoreanAccounting Review 39 (5): 91-136.
Kothari, S. P., A. J. Leone, and C. E. Wasley. 2005. “Performance Matched Discretionary Accrual Measures.” Journal of
Accounting and Economics 39 (1): 163-197.
Lu, T., H. Sapra. 2009. “Auditor Conservatism and Investment Efficiency.” The Accounting Review 84 (6): 1933-1958. Mutchler, J. F. 1985. “A Multivariate Analysis of the Auditor’s Going-Concern Opinion Decision.” Journal of Accounting
Research 23 (2): 668-682.
Mutchler, J. F., W. Hopwood, and J. M. McKeown. 1997. “The Influence of Contrary Information and Mitigating Factors on Audit Opinion Decisions on Bankrupt Companies.” Journal of Accounting Research 35 (2): 295-310.
Nah, C. K., and J. H. Choi. 2000. “Earnings Management of Insolvent Firms and Market Reactions.” [in Korean] Korean
Accounting Review 25 (4): 55-86.
Paek, W. S. 2011a. “The Changes in Accounting Environment and the Matching Principle” [in Korean] KoreanManagement
Review 40 (1): 29-49.
Paek, W. S. 2011b. “The Matching Principle and Earnings Quality” [in Korean] KoreanAccounting Review 36 (2): 101-126. Paek, W. S. 2012. “Accelerated or Delayed Recognition of Expenses: Earnings Volatility and Persistence.” [in Korean] Korean
Accounting Review 37 (2): 99-127.
Paek, W. S. 2013. “Firm Life-Cycle Stages, Revenue-Expense Matching, and the Differential Patterns of Expense Recognition” [in Korean] KoreanAccounting Review 38 (2): 215-245.
Xu, Y., A. L. Jiang, N. Fargher, and E. Carson. 2011. “Audit Reports in Australia during the Global Financial Crisis.” Australian
APPENDIX
GCOit dummy variable (equal to 1 for the firms that received going-concern modified opinions for the current fiscal
year’s financial statements and 0 otherwise);
ABSDAit-1 lagged absolute discretionary accruals at firm i and year t-1;
LnSALEit natural logarithm of total sales;
LEVit total liabilities divided by total book value;
ROAit earnings before tax and interests divided by lagged total assets;
CASHit cash and cash equivalent;
Zitit Altman (1968) Z-score;
CZit change of Altman (1968) Z-score;
CFOit operating cash flow deflated by lagged total assets;
LTDTit long-term debt divided by lagged total assets;
CLTDTit change of long-term debt divided by lagged total assets;
BIG4it dummy variable (equal to 1 if firms are audited by one of Big 4 auditors (Samil, SamJung, AhnJin, HanYoung)
and 0 otherwise;
LOSSit dummy variable (1 if net earnings are less than 0 and 0 otherwise);
TAit total accruals (net earnings minus operating cash flow) deflated by lagged total assets;
ΔSALEit change of sales deflated by lagged total assets;
ΔARit change of accounts receivable deflated by lagged total assets;
PPEit Property, plant and equipment deflated by lagged total assets;
DAit discretionary accruals (Kothari, Leone, and Wasley 2005);
PO_DAit positive discretionary accruals (Kothari, Leone, and Wasley 2005);
NE_DAit negative discretionary accruals (Kothari, Leone, and Wasley 2005);
Lambda inverse Mills ratio of Heckman (1979) estimated going-concern probability by probit model;
SIZEit natural logarithm of total assets;
BTMit total book value divided by market value;
GRWit change of sales deflated by lagged total sales;
ABS_TAit absolute total accruals;
Zit Altman’s (1968) Z-score;
ROAit-1 lagged earnings before taxes and interest divided by lagged total assets;
ROAit-12 ROA it-1’s square;
∑ID industrial dummy; ∑YR year dummy;
REVit total sales and non-operating income divided by lagged total assets at year t-1;
EXPit-1 total expenses (cost of goods, sales & administration expenses, and non-operating expenses) divided by lagged
total assets at year t-1;
EXPit total expenses (cost of goods, sales & administration expenses, non-operating expenses) divided by lagged total
assets at year t;
EXPit+1 total expenses (cost of goods, sales & administration expenses, non-operating expenses) divided by lagged total
assets at year t+1;
NEGEQit dummy variable (1 if firms have negative equity, otherwise 0);
HLEVit dummy variable (1 if one for the third tertile of portfolio (highest) partitioned by total liability to equity ratio,
otherwise 0);
LLEVit dummy variable (1 if three for the third tertile of portfolio (lowest) partitioned by total liability to equity ratio,
HROAit dummy variable (1 if one for the third tertile of portfolio (highest) partitioned by earnings before taxes and interest deflated by lagged total assets, otherwise 0);
LROAit dummy variable (1 if three for the third tertile of portfolio(lowest) partitioned by earnings before taxes and
interest deflated by lagged total assets, otherwise 0).
HDAit dummy variable (1 if one for the third tertile of portfolio (highest) partitioned by discretionary accruals,
otherwise 0);
LDAit dummy variable (1 if three for the third tertile of portfolio (lowest) partitioned by discretionary accruals,