Role Of Perceived Value,
Customer Expectation, Corporate
Image And Perceived Service Quality
On The Customer Satisfaction
Rizwan Ali, Liaoning Technical University P.R chinaGao Leifu, Liaoning Technical University, P.R China
Muhammad YasirRafiq, Govt. Islamia College of Commerce, Lahore, Pakistan Mudassar Hassan, The University of Lahore, Pakistan
ABSTRACT
This study sets out to investigate the influence of perceived value, customer expectation, corporate image and perceived service quality on the customer satisfaction particularly in Pakistan telecommunication industry. To test the conceptual framework, multiple regression has been used to analyze the data collected from 450 respondents of Pakistan telecommunication companies operating in the Pakistan. This study reveals number of notable findings including the empirical verification that value, customer expectation and corporate image significantly enhancing the customer satisfaction. We also observed that perceived service quality is negatively related to customer satisfaction but insignificant. Furthermore results shows that gender provides no basis for differentiation among variables in determining the customer satisfaction.
Keywords: Customer Satisfaction; Perceived Value; Corporate Image; Perceived Service Quality
1. INTRODUCTION
ustomer satisfaction with product or service presumably leads to repurchases, adoption of other products/services from the same firm and favorable word of mouth publicity. If this theory is true then the understanding of factors influencing the customer satisfaction is essential to marketers. Customer satisfaction is pointed out as the ultimate goal of all firms (Morgan, Anderson, & Mittal, 2005). Normally we categorized firms into two types as one is service based firms and other is product based firms. These two types are different from each other because of their own unique characteristics for example, we can store the product but we could not store the service. No doubt customer satisfaction in products and services based firms carries the equal importance but for service based firms it becomes quite complex because of the unique characteristics of service.
As world is becoming competitive day by day, to survive in today’s high competitive world companies should pay more and more attention to the customer satisfaction. Customer satisfaction is the contentment of the customer with respect to his or her prior purchasing experience with a given service firm as explained by (R. E. Anderson & Srinivasan, 2003). Customer satisfaction defined as “the consumer’s fulfillment response, the degree to which the level of fulfillment is pleasant or unpleasant” by (Oliver Richard, 1997). It seems customer satisfaction is all about the judgment of the service provider (McDougall & Levesque, 2000).
value is directly related to the customer willingness to buy argued by (Dodds & Monroe, 1985). The purpose of providing value to customers consistently and more effectively than competitors is to retain and make customer more satisfied documented by (Schiffman & Kanuk, 2004). Perceived Service quality has been extensively studied but still has room for more discussion.
SERVQUAL model introduced by (A Parasuraman, Zeithaml, & Berry, 1988) that has been widely used across industries to determine perceived service quality and later on criticized by (Brown, Churchill Jr, & Peter, 1993). This criticism resulted many other models to measure the perceived service quality as one of the famous model is (Oliver, 1981) expectancy-disconfirmation model. This debate spurred the researcher and practitioners to study perceived service quality. The reason for the interest in perceived service quality by practitioners results from the conviction that this has beneficial effect on the bottom-line performance for the firm. Adapting the framework to a services context suggests that service quality have direct influence on customer satisfaction. There are many studies showing the relationship between perceived service quality and customer satisfaction as (Cronin Jr & Taylor, 1992). As service is intangible in nature, due to this characteristic the association between customer satisfaction and perceived service quality has proved difficult to pin point described by (Cameran, Moizer, & Pettinicchio, 2010). Customer service is an important driver of customer equity and should be a high priority while attracting and retaining the right customers (E. W. Anderson & Sullivan, 1993). When customer purchase the products/service from the company they are not only buy the products/services but also receive set of values from the company highlighted (Ind, 1997). The sum of those values is known as the corporate image. Corporate image is related to the physical and behavioral attributes of the firm like name of firm, variety of products/services and the impression of quality communicated by each person interacting with the firm’s clients explained by (Nguyen & LeBlanc, 1998). These studies highlighted the importance of corporate image towards the customer satisfaction. No doubt perceived service quality, perceived value, customer expectations are the key determinants of customer satisfaction but the importance of corporate image could not be ignored.
The study is presented in four additional sections. Firstly, in the introductory section of Pakistan telecommunication, a discussion of overall market analysis, competition, growth and potential challenges is presented. Second section reviews on the studied variables and outlines the expected relationships in a research model. In the third section appropriate measures are indentified and research is carried out among telecommunication users to test the hypothesized relationships. These results are then discussed in the fourth, and the conclusions are presented in the fifth section.
1.1 Pakistan Telecommunication Industry
Pakistan has one of the liberal foreign investment regimes in South Asia. 100% foreign equity is permitted in various sectors of the economy. Pakistan has very fruitful market with large consumer base of more than 180 million people. South Asia is the home to fastest growth of telecom, but Pakistan is quite exceptional in this industry. Pakistani telecommunication growth beat the neighbor country’s sectors as in 2007 Pakistan telecommunication growth was 46.9% as compared with India, Bangladesh and Sri Lanka was 15% and 37% respectably. This great potential attracted a respectable amount of foreign direct investment of USD 2.8 over few years. This sector contributing significantly in the country Exchequer as in 2012 PKR 133billion has been collected as taxes, regulatory fess and others fees.
Figure 1. Cellular Subscribers Share
*Pakistan telecommunication Authority Report 2012-2013
It is assumed new players in the market kept the momentum of the competition in the market. This is alarming time for the players to put more concentration on the customer satisfaction. If we critically do the comparison between 2012 and 2013, Mobilink share decreased by 1% while Ufone market share decreased by 1.3%. There are more than one reasons for this critical situation, one of them is the dissatisfaction of the customers also. The current successful lunching of 3G and 4G technologies on one hand created the room for potential growth meanwhile it also accelerated the more competition in the market. The most interesting fact in the Pakistan telecommunication is that for subscribers there is no switching cost. This factor facilitates the users to switch easily from one network to another network. To survive in such kind of industry, customer retention is very critical and without satisfying the customer the retention is not possible (Pitt & Jeantrout, 1994); (Bagozzi, 1992).
1.2 Study Objective
The overall objective of this study is the understanding of the factors influencing the customer satisfaction in telecommunication industry. For this first thing is to identifying the potential factors influencing the customer satisfaction by following the existing studies in the field of marketing, satisfaction, corporate image and customer satisfaction. Finally the empirically testing of the proposed relation to verify whether the proposed relationship holds true.
2. LITERATURE
2.1 Perceived Value
customer do their repurchasing decisions upon the feelings that generated by the service. Finally the social value means that all about the service feeling ability to enhance the self concept. In the light of above literature we are expecting that perceived value will contribute positively in customer satisfaction in Pakistan telecommunication industry.
H1: Perceived value has a significant influence on customer satisfaction.
2.2 Customer Expectations
Expectations can be defined as “perceived potential of alternative suppliers and brands to satisfy a number of explicit and implicit objectives in any particular buying decision” (Sheth, 1973). Information of customer expectation is important because this factor influences the customer behavior and management within the limited resources can manage the expectations of the customers. Normally expectations a customer have about a product or service depend upon the information gathered from the available resources. Customer expectations could be influenced by the advertising, promotions and positive word of mouth. A huge body of literature explains the importance of customer expectations and customer satisfaction. There are many quotations expressing the customer expectations in different ways like “It is necessary to exceed customer expectations”. It is very important that if the product or service fulfills the expectation of the customer they will give more preference of that product or service next time. There is one famous statement regarding this as “If a customer expects a bad level of quality and receives it, he/she will reduce his/her level of preference for the brand”. This is why customer expectation could not be ignored while studying the customer satisfaction because it plays vital role in customer behavior regarding future repurchases decision. There are many studies that showed the importance of customer expectation in customer satisfaction and suggested how to manage and meet their expectations as (Boulding, Kalra, Staelin, & Zeithaml, 1993); (Anantharanthan Parasuraman, Zeithaml, & Berry, 1985). Customer expectation is the key to customer satisfaction, delight and loyalty stated by (Kotler, 2000). Service providers must identify the needs and expectations of the customer to achieve higher customer expectations (Arun Parasuraman, Berry, & Zeithaml, 1991). Managing and fulfilling the customer expectations is a good tool to enable the customers satisfied (Pitt & Jeantrout, 1994). After carefully reviewing the existing literature regarding the customer expectations and customer satisfaction we hypothesized.
H2: The ability of the firm to meet the expectations of its customers has a direct effect on customer satisfaction.
2.3 Corporate Image
Corporate image is all about the physical and emotional behavioral with the firm such as products and strong word of mouth concluded by (Nguyen & LeBlanc, 1998) and (Nguyen & Leblanc, 2001). Many conceptualizations of corporate image have been advanced in the past. It was argued that customer satisfaction leads to corporate image (E. W. Anderson & Sullivan, 1993). Service quality causes superior reputation in Chinese banking industry (Wang, Lo, & Hui, 2003). The link between corporate image and customer satisfaction deserves more attention. Later it was found that corporate image is the deriver of customer satisfaction (Andreassen, 1994); (Ryan, Rayner, & Morrison, 1999). Similarly product name and company’s sales history are significantly contributing to the consumer familiarity and confidence documented (Haque, Sadegzadeh, Khatibi, & Al Mahmud, 2006). Corporate image, service quality and switching cost are the main factors of customer loyalty examined by (Aydin & Özer, 2005). The influence of corporate image has been studied in telecommunication, retailing and education sector and results showed that corporate image has significant positive effect on customer satisfaction that resulted in customer loyalty (Nguyen & Leblanc, 2001). Corporate image facilitate customer for the valuation of the service quality and satisfaction (Andreassen & Lindestad, 1998); (Zins, 2001). The consumers have positive mental schema of a product/service will lead to higher satisfaction and loyalty studied by (Brodie, Whittome, & Brush, 2009).
2.4 Perceived Service Quality
Today the quality of products and services is of great importance. It is widely acknowledged that surviving in complex and competitive world requires quality production. To understand and access the outcomes of efforts realized for good quality production, quality should be measurable. The quality of goods can easily be considered by taking into account the certain physical properties. The measurement of service quality is rather complex because quality in this case depends on many factors.
While there have been efforts to study perceived service quality, there has been no general agreement on the measurement and relationship with customer satisfaction. At the time of purchase it is not necessary that perceived service quality is same as in the mind of customers stated by (Crosby, Evans, & Cowles, 1990). Many of the definitions of the Perceived service quality revolve around the identification and satisfaction of customer wants and requirements. Service quality can be defined as “the difference between predicted, or expected, service (customer expectations) and perceived service (customer perceptions)” documented by (Anantharanthan Parasuraman, et al., 1985).
Although there is conflicting evidence of perceived service quality (Lehtinen & Lehtinen, 1982) gives three dimensional view that are interaction, physical and corporate quality. perceived Service quality is the determinant of the customer satisfaction concluded by (Cronin Jr & Taylor, 1992). The bulk of literature tends to support satisfaction as the outcome of perceived service quality (Brady & Robertson, 2001); (Anantharanthan Parasuraman, et al., 1985); (Taylor & Baker, 1994); (Teas, 1994). Above said arguments suggest the following hypothesis. H4: Customer satisfaction is positively influenced by the perceived service quality.
3. METHODOLOGY AND ANALYSIS
This section develops the research framework that can be used to measure the customer satisfaction. In addition this section also briefly discussed the sample, data and research methodology.
3.1 Research Framework
Figure 2. Conceptual Frame Work
CustomerSatisfaction=
a
=b
1PercievedValue=b
2SustomeExpecations+b
3Corporate Image +b
PercievedServiceQuality+e
3.2 Sample and Data Collection
Data was collected through distributing the structured questionnaire by following random sampling technique to the users of telecom operators in various part of the Punjab the prime province of Pakistan. The Punjab was selected because significant numbers of consumer of telecom operators are available in Punjab as compared to other provinces of Pakistan. In this study respondents targeted were males and females. Before collecting the data a pilot study was conducted to verify the validity of the questionnaire. The results produced favorable outcomes and gave us green signal to go ahead. Section one of the questionnaire designed to collect demographic and socio economic background of the respondents while section two designed to measure the participant’s satisfaction of the operator’s service through perceived value, customer expectations, corporate image and perceived service quality. The responses of this measurement were scored using a five-point rating scale. It is to be noted that the participants were clearly briefed about the objective and purpose of this study before distribution of the questionnaire and ensured them that information given by them will be confidential and will never disclose. 550 questionnaires were distributed, in total survey yielded 500 responses. Of the 500 responses 50 were considered unusable due to relatively high amount of missing values, while 450 were complete and used for data analysis.
Customer Satisfaction Perceived
Value
Customer Expectations
Corporate Image
3.3 Analysis Approach
Data analysis is accomplished by following the inferential statistics techniques. To measure the validity of this research validity analysis was carried out by following Cronbach's α coefficient. Correlation analysis is used to measure the relationship among the suggested variables. As the proposed model to be tested, multiple regression was used to determine the influence of perceived value, customer expectations, corporate image and perceived service quality on customer satisfaction. The software package was used SPSS. Multiple regression analysis has been extensively used in the existing literature to measure model Figure 2 as (A Parasuraman, et al., 1988); (Aydin & Özer, 2005); (Brady & Robertson, 2001).
4. RESULTS
4.1 Reliability of Data
Reliability analysis was conducted using the procedures outlined by (Cronbach, 1951) alpha that ranged from 0.85 to 0.70 which exceeded the cut point of 0.70 shows in Table 1 (Leech, Barrett, & Morgan, 2005).
Table 1. Reliability Analysis
Name of Variable Nature of Variable Number of Items included Cronbach’s Alpha
Customer Satisfaction Dependent Variable 10 0.80
Perceived Value Independent Variable 4 0.70
Customer expectations Independent Variable 6 085
Corporate Image Independent Variable 3 0.78
Perceived Service Quality Independent Variable 4 0.82
4.2 Descriptive Statistics
Table 2 shows the socio-demographic profile of respondents characterized by majority of males (55.6% of the sample). Thirty four percent of the subjects were married (58 males and 98 females) and another 294(66%) were unmarried. An average qualification for male respondents is master with (53.4%). Almost twenty five percent of respondents were using post-paid connection while rest 75% per using the pre-paid mobile connection. Based on the overall customer data it was concluded that this was a fully reprehensive sample.
Table 2. Socio-Demographic Profile of Overall Sample
Gender Marital Status Service Used Qualification
Married Unmarried Post Paid Pre-Paid Matric Intermediate Bachelor Master
Male 58
(23.2%) 192 (76.8%) 70 (27.3%) 186 (72.7%) 28 (11.4%) 12 (4.9%) 75 (30.4%) 132 (53.4%)
Female 98
(49.0%) 102 (51.0%) 45 (23.2%) 149 (76.8%) 35 (17.2%) 48 (23.7%) 65 (32.0%) 55 (27.1%)
To investigate either the gender makes any differentiation in factors of customer satisfaction we applied t-test in
Table 3. The results of t-test indicated that gender not significant difference among the factors indentified for the customer satisfaction.
Table 3. Customer Satisfaction with respect to gender
Gender N Mean Standard
Deviation
Standard Error Mean
T-test for Equality of Means
t-value d.f. Sig. (2-tailed)
Customer Satisfaction
Male 250 28.32 4.50 0.22 -0.732 448 0.325
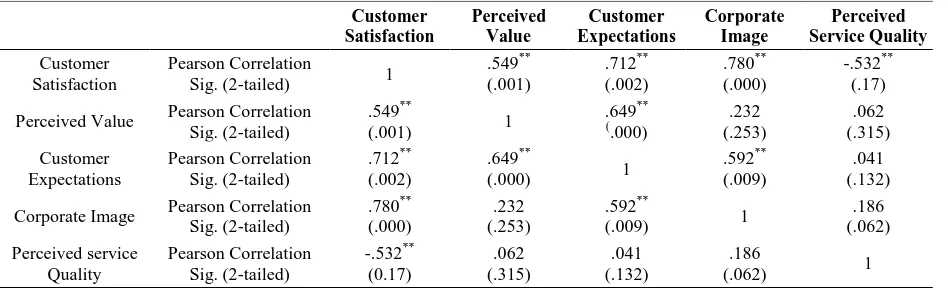
4.3 Correlation Analysis
The construct correlations are described in Table 4. The coefficients were significant (p<0.05). The results are consistent with the prior study of (A Parasuraman, et al., 1988) that indicated that perceived value have positive influence on customer satisfaction. Meanwhile coefficient of Customer expectations indicated that customer expectations and customer satisfaction are positively correlated as (Pitt & Jeantrout, 1994). This study and (Andreassen & Lindestad, 1998) study showed the same results that corporate image has significant influence on customer satisfaction. However this study did find a marginally significant influence of corporate image which could be explained by overall more involvement of customers and firm. Interestingly we found that perceived service quality have insignificant negative influence on customer satisfaction. It could be justified as the perception of the perceived service quality in the minds of customer changes over the period of time.
Table 4. Correlation Analysis
**Correlation is significant at the 0.05 level (2-tailed)
4.4 Empirical Analysis Evaluation of Proposed Model:
Figure 3 and Table 5 shows the results from the proposed model with R-square of 0.599. All except of one of the variables coefficients are significant at p =0.03.Overall model is highly significant. This result reveals that attention must be fastened on key factors perceived value, customer expectations in order to enhance the customer satisfaction.
In terms of construction of customer satisfaction, perceived value (β=1.214, 0.005) is most important and significant factor that affects the customer satisfaction followed by customer expectations (β=0.394, 0.035) and corporate image (β=0.462, 0.020). The results suggested that attention must be paid to customer expectations and corporate image to improve the customer satisfaction. Surprisingly Perceived service quality (β=-0.012) showed the insignificant negative influence on customer satisfaction. This interesting fact indicates that attention must be paid to perceived service quality to convert its contribution positively in the customer satisfaction. As the perception of perceived service quality in the minds of customers, changing over time so there is strong need to respond that variation timely and properly to enhance satisfaction.
Customer Satisfaction Perceived Value Customer Expectations Corporate Image Perceived Service Quality Customer Satisfaction Pearson Correlation
Sig. (2-tailed) 1
.549** (.001) .712** (.002) .780** (.000) -.532** (.17)
Perceived Value Pearson Correlation Sig. (2-tailed)
.549**
(.001) 1
.649** ( .000) .232 (.253) .062 (.315) Customer Expectations Pearson Correlation Sig. (2-tailed) .712** (.002) .649**
(.000) 1
.592** (.009)
.041 (.132)
Corporate Image Pearson Correlation Sig. (2-tailed) .780** (.000) .232 (.253) .592**
(.009) 1
.186 (.062) Perceived service Quality Pearson Correlation Sig. (2-tailed) -.532** (0.17) .062 (.315) .041 (.132) .186
Figure 3. The Estimated Model
Table 5. Analysis of Evaluation of Proposed Model
Model R R Square Adjusted R Square Std. Error of the Estimate
1 .774 .599 .584 3.826
Table 6. ANOVA
Sum of Squares df Mean Square F Sig.
Regression 3242.055 5 648.411 36.9292 0.000**
Residual 6584.326 375 17.5582
Total 9826.381 380
Table 7. Coefficients
Factors Unstandardized Co-efficient Standardized
Co-efficient t Sig.
B Standard Error
(Constant) 12.364 1.2354 10.0074 0.000**
Perceived Value 1.214 0.1951 0.5633 6.2234 0.005**
Customer Expectations 0.394 0.0752 0.1135 5.2394 0.035**
Corporate Image 0.462 0.0958 0.1725 4.8233 0.020**
Perceived Service Quality -0.012 0.1046 -0.0083 -0.1146 0.729
**Significant at 0.5 level (2-tailed)
The four main concepts of the research framework (Perceived value, customer expectations, corporate image and perceived service quality) are all hypothesized positive. The findings support all hypotheses except one ‘perceived Service quality insignificantly has negative impact on the customer satisfaction’. The other three are
Customer Satisfaction Perceived
Value
Customer Expectations
Corporate Image
Perceived Service Quality
H1
1.214
H2
0.394
H3
0.462
H4
highly significant. The positive affect of perceived value on customer satisfaction confirmed the existing studies by (Bolton & Drew, 1991); (A Parasuraman, et al., 1988). The significant positive influence of customer expectations on satisfaction is in the same line as (Arun Parasuraman, et al., 1991). The positive contribution of corporate image in the customer satisfaction is consistent with the existing literature (Andreassen & Lindestad, 1998); (Zins, 2001). Sometimes customer are confused regarding the perceived service quality that resulted in dissatisfaction studied by (Crosby, et al., 1990). This is the reason we found that interesting phenomena in our findings. Thus these results suggest that customer satisfaction can be improved by focusing on perceived value, customer expectations, corporate image and perceived service quality.
5. CONCLUSION
The overall purpose of this study was to build up an understanding of the effect of perceived value; customer expectations, corporate image and perceived service quality on customer satisfaction in the telecommunication industry. The results prove the hypothesized relationship in the research framework. The results also show that while gender provides no basis for differentiation among variables in determining the customer satisfaction.
The research contribute in our knowledge by providing support for the construct that perceived value, customer expectations, corporate image and perceived service quality have direct influence on customer satisfaction. Perceived value has been found to be most important factor for the customer satisfaction. However the main focus of the management should be on all factors but perceived value is an important factor. It is critical for service firms to establish benchmark and needs to monitor its performance among its customers in the same way that the firm monitors its management accounts. Different benchmarks may be needed for different segments that firm targets.
Every study has its limitation and this study is no exception. Firstly the results pertain only to the respondents and generalization to the wider population should be done with caution. The sample size is not large but sufficient for the type of analysis undertaken.
This study provides a number of directions for the future research. Work can focus on identifying and possibly developing a unique measure of customer satisfaction for the telecommunication industry. It is also possible to look at developing stronger model by adding more variables beyond the four studied in this study. Similarly the same model may be applied to measure the corporate user’s satisfaction within the same industry.
AUTHOR INFORMATION
Rizwan Ali is currently doing PhD in Management Science and Engineering in Liaoning Technical University. His research interests focus on customer satisfaction and human resource particularly in service industry and can be contacted at: ali143zhaogu@gmail.com (corresponding author)
Gao Leifu is the Dean of College of Science, Liaoning Technical University, Fuxin P.R China. He has more than fifteen years of rich experience in the academics. His research interests include optimization, management science, and applied mathematics. He is holding two Funds of National Natural Science. He has published more than twenty papers in well reputed international journals. His contact information as follows
Email: gaoleifu@163.com.
Muhammad Yasir Rafiq is Lecturer at Govt. Islamia College of Commerce, Lahore, Pakistan. He has more than five years of academic experience. His contact Information is as follows Email: yasir.stats@gmail.com.
REFERENCES
Anderson, E. W., & Sullivan, M. W. (1993). The antecedents and consequences of customer satisfaction for firms. Marketing science, 12(2), 125-143.
Anderson, R. E., & Srinivasan, S. S. (2003). E‐satisfaction and e‐loyalty: A contingency framework. Psychology & marketing, 20(2), 123-138.
Andreassen, T. W. (1994). Satisfaction, loyalty and reputation as indicators of customer orientation in the public sector. International Journal of Public Sector Management, 7(2), 16-34.
Andreassen, T. W., & Lindestad, B. (1998). Customer loyalty and complex services: the impact of corporate image on quality, customer satisfaction and loyalty for customers with varying degrees of service expertise. International Journal of service Industry management, 9(1), 7-23.
Aydin, S., & Özer, G. (2005). The analysis of antecedents of customer loyalty in the Turkish mobile telecommunication market. European Journal of Marketing, 39(7/8), 910-925.
Bagozzi, R. P. (1992). The self-regulation of attitudes, intentions, and behavior. Social psychology quarterly, 178-204.
Birgelen, M., Wetzels, M., & de Ruyter, K. (1997). Commitment in service relationships: an empirical test of its antecedents and consequences. Paper presented at the EMAC Conference Proceedings.
Bolton, R. N., & Drew, J. H. (1991). A multistage model of customers' assessments of service quality and value. Journal of consumer research, 375-384.
Boulding, W., Kalra, A., Staelin, R., & Zeithaml, V. A. (1993). A dynamic process model of service quality: from expectations to behavioral intentions. Journal of marketing research, 30(1), 7-27.
Brady, M. K., & Robertson, C. J. (2001). Searching for a consensus on the antecedent role of service quality and satisfaction: an exploratory cross-national study. Journal of Business Research, 51(1), 53-60.
Brodie, R. J., Whittome, J. R., & Brush, G. J. (2009). Investigating the service brand: a customer value perspective. Journal of Business Research, 62(3), 345-355.
Brown, T. J., Churchill Jr, G. A., & Peter, J. P. (1993). Improving the measurement of service quality. Journal of retailing, 69(1), 127-139.
Cameran, M., Moizer, P., & Pettinicchio, A. (2010). Customer satisfaction, corporate image, and service quality in professional services. The Service Industries Journal, 30(3), 421-435.
Cronbach, L. J. (1951). Coefficient alpha and the internal structure of tests. psychometrika, 16(3), 297-334. Cronin Jr, J. J., & Taylor, S. A. (1992). Measuring service quality: a reexamination and extension. The Journal of
Marketing, 55-68.
Crosby, L. A., Evans, K. R., & Cowles, D. (1990). Relationship quality in services selling: an interpersonal influence perspective. The Journal of Marketing, 68-81.
Dodds, W. B., & Monroe, K. B. (1985). The effect of brand and price information on subjective product evaluations. Advances in consumer research, 12(1), 85-90.
Haque, A., Sadegzadeh, J., Khatibi, A., & Al Mahmud, S. (2006). Investigating potentially affective factors of online sales: a study on Malaysian business online. International Journal of Information Systems and Change Management, 1(4), 374-395.
Heskett, J. L., & Sasser, W. E. (2010). The service profit chain: from satisfaction to ownership. Handbook of Service Science, Part 1, 19-29.
Ind, N. (1997). The corporate brand: Macmillan Houndmills.
Kotler, P. (2000). Marketing Management: Analysis, Planning, Implementation and Control.(Millennium edition): New Jersey: Prentice-Hall, Inc.
Leech, N. L., Barrett, K. C., & Morgan, G. A. (2005). SPSS for intermediate statistics: Use and interpretation: Psychology Press.
Lehtinen, U., & Lehtinen, J. R. (1982). Service quality: a study of quality dimensions: Service Management Institute.
McDougall, G. H., & Levesque, T. (2000). Customer satisfaction with services: putting perceived value into the equation. Journal of services marketing, 14(5), 392-410.
Morgan, N. A., Anderson, E. W., & Mittal, V. (2005). Understanding firms' customer satisfaction information usage. Journal of marketing, 69(3), 131-151.
Nguyen, N., & Leblanc, G. (2001). Corporate image and corporate reputation in customers’ retention decisions in services. Journal of retailing and Consumer Services, 8(4), 227-236.
Oliver Richard, L. (1997). Satisfaction: A behavioral perspective on the consumer. New York ˈ NY: Irwin-McGraw-Hill.
Oliver, R. L. (1980). A cognitive model of the antecedents and consequences of satisfaction decisions. Journal of marketing research, 460-469.
Oliver, R. L. (1981). Measurement and evaluation of satisfaction processes in retail settings. Journal of retailing. Parasuraman, A., Berry, L. L., & Zeithaml, V. A. (1991). Understanding customer expectations of service. Sloan
Management Review, 32(3), 39-48.
Parasuraman, A., Zeithaml, V. A., & Berry, L. L. (1985). A conceptual model of service quality and its implications for future research. The Journal of Marketing, 41-50.
Parasuraman, A., Zeithaml, V. A., & Berry, L. L. (1988). Servqual. Journal of retailing, 64(1), 12-40. Patterson, P. G., & Spreng, R. A. (1997). Modelling the relationship between perceived value, satisfaction and
repurchase intentions in a business-to-business, services context: an empirical examination. International Journal of service Industry management, 8(5), 414-434.
Pitt, L. F., & Jeantrout, B. (1994). Management of customer expectations in service firms: a study and a checklist. Service Industries Journal, 14(2), 170-189.
Ryan, M. J., Rayner, R., & Morrison, A. (1999). Diagnosing customer loyalty drivers: partial least squares vs. regression. Marketing Research, 11, 19-28.
Schiffman, L. G., & Kanuk, L. L. (2004). Customer behavior. New Jersey: Prestice Hall. Sheth, J. N. (1973). A model of industrial buyer behavior. The Journal of Marketing, 50-56.
Sweeney, J. C., & Soutar, G. N. (2001). Consumer perceived value: the development of a multiple item scale. Journal of retailing, 77(2), 203-220.
Taylor, S. A., & Baker, T. L. (1994). An assessment of the relationship between service quality and customer satisfaction in the formation of consumers' purchase intentions. Journal of retailing, 70(2), 163-178. Teas, R. K. (1994). Expectations as a comparison standard in measuring service quality: an assessment of a
reassessment. The Journal of Marketing, 132-139.
Wang, Y., Lo, H.-P., & Hui, Y. V. (2003). The antecedents of service quality and product quality and their influences on bank reputation: evidence from the banking industry in China. Managing Service Quality, 13(1), 72-83.