The Nonlinear Dynamics
of Flashover
in Compartment Fires
Paul Holborn
C entre for N onlinear D ynam ics
U niversity College London
April 1994
ProQuest Number: 10046128
All rights reserved
INFORMATION TO ALL USERS
The quality of this reproduction is dependent upon the quality of the copy submitted.
In the unlikely event that the author did not send a complete manuscript and there are missing pages, these will be noted. Also, if material had to be removed,
a note will indicate the deletion.
uest.
ProQuest 10046128
Published by ProQuest LLC(2016). Copyright of the Dissertation is held by the Author.
All rights reserved.
This work is protected against unauthorized copying under Title 17, United States Code. Microform Edition © ProQuest LLC.
ProQuest LLC
789 East Eisenhower Parkway P.O. Box 1346
Acknowledgements
Firstly, thanks to my parents, who deserve most o f the credit and none o f the blame.
Secondly, thanks to all the members o f the Centre for Nonlinear Dynamics for their
support. Special mentions must go to Steve Bishop, for keeping me busy, Jesse, for
teaching me some Portuguese, and Steve and Mike for providing a constant source o f
entertaining background noise to work to for the past three years.
Finally, I would like to thank Dougal Drysdale, and the other members o f the Fire
Safety Unit at Edinburgh University, particularly in relation to the scale compartment
fire growth experiments, which so graphically demonstrate the awesome nature o f the
Abstract
The developm ent o f a fire within a compartment represents an event o f both theoretical
and practical interest, displaying a variety o f nonlinear behaviour. O f particular
importance is the flashover transition, whereby a small fire undergoes a rapid
intensification to engulf the whole compartment. In this thesis we examine the influence
o f the controlling param eters, on the qualitative nonlinear behaviour o f three different
simplified com partm ent fire models, by applying some o f the techniques o f nonlinear
dynamics.
The variation in response o f a nonlinear model, indicated by some representative
quantity (e.g. temperature) as a particular distinguished param eter varies, can be traced
out to produce a bifurcation diagram. The effect o f the remaining auxiliary control
parameters can then be mapped out by locating the boundaries or varieties which
separate the different qualitative types o f bifurcation diagram exhibited by the model.
Such varieties are defined in terms o f the singularities o f the function(s) defining the
model, and its derivatives. We show that these definitions can be extended to include
the transition points between fuel and ventilation controlled burning exhibited by
compartment fire models. Path following techniques are also presented as a means of
obtaining bifurcation diagrams and varieties numerically.
These techniques are applied to construct parameter maps and classify the possible
bifurcation diagram types for three different simplified compartment fire models,
incorporating the effect of; radiation feedback from the compartment, vitiation o f the
compartments oxygen atmosphere and varying combustion efficiency. Based upon this
analysis, an index is derived as a means of evaluating the flashover potential o f a given
compartment.
Finally a comparison o f experimental data obtained for two thermoplastic fuels is made,
confirming the occurrence o f the qualitative nonlinear features predicted theoretically,
Contents
Page
Title page
1
Acknowledgements
3
Abstract
4
Contents
5
List of figures and tables
8
1.
Introduction
12
2.
Fire dynamics and compartment fire
15
2.1 Combustion phenomena and fire dynamics 15
2.1.1 W hat is fire? 15
2.1 .2 Heat transfer processes 17
2.1.3 Chemical kinetics and flames 20
2.1 .4 Steady burning o f liquid and solid fuels 24
2.2 Elements o f compartment fire modelling 25
2.2.1 Stages o f a compartment fire 25
2.2 .2 Approaches to modelling fire in a compartment 27
2.2.3 Flow induced by fire in a compartment 29
2.3 Flashover and jum p phenomena 35
2.3.1 Definitions of flashover 35
2.3.2 Examples o f flashover 36
2.3.3 A qualitative model of flashover and instabilities 38
2.4 Mathematical models o f fire growth in a compartment 47
2.4.1 A simplified radiation feedback model 47
2.4 .2 The Thomas vitiation model 52
2.4.3 The Takeda combustion efficiency model 54
Page
3.
Concepts and techniques of nonlinear dynamics
60
3.1 Phase space, attractors and basins 60
3.2 Bifurcation theory 62
3.2.1 Basics 62
3.2.2 Extensions 72
3.3 Path following methods 76
3.3.1 The Newton-Raphson root finding method 76
3.3.2 Predictor corrector methods 77
3.3.3 Local parameterisation and pseudo-arclength continuation 81
3.3.4 Singular value decomposition and the pseudo-inverse method 84
3.4 The Jepson and Spence method 89
3.5 Numerical integration o f ordinary differential equations 91
4.
Analysis of fire growth models
93
4.1 Bifurcation analysis of the simplified radiation feedback model 93
4.1.1 Non-dimensional area a, as the distinguished parameter 93
4.1.2 Boundary bifurcations 97
4.1.3 Non-dimensionalised air mass flow rate
as the distinguished parameter 105
4.1.4 Transient behaviour 109
4.2 Thomas vitiation model 113
4.3 Takeda combustion efficiency model 118
4.3.1 Non-dimensional area a, as the distinguished parameter 118
4.3.2 Non-dimensionalised air mass flow rate
as the distinguished parameter 121
5. P red ictin g flashover
Page
127
5.1 The method o f McCaffrey et al. 127
5.1.1 Example calculation 128
5.2 Theoretically based flashover index 130
5.2.1 Example calculation 131
5.3 Discussion 133
6. E xp erim en tal a n d theoretical com parisons 134
6.1 Scale model experiments and results 134
6.1.1 Experimental arrangement 134
6.1.2 Experimental results 137
6 .2 Experimental and theoretical comparisons for polyethylene fuel 147 6.2.1 Mass flow rate vs fuel tray area 147
6.2.2 Fuel tray area vs ventilation width 147
6.3 Experimental and theoretical comparisons for PM M A fuel 152
6.3.1 Mass flow rate vs fuel area 152
6.3.2 Mass flow rate vs ventilation width 155
6.3.3 Fuel area vs ventilation width 155
6.4 Flashover index predictions 159
7. C onclusions 162
L ist of symbols 167
List of figures
Page
2.1 The fire triangle. 16
2.2 Thermal feedback mechanisms. 16
2.3 Elements o f a burning candle flame. 23
2.4 Potential stages o f a compartment fire. 26
2.5 The flow induced by a fire in a compartment. 30
2.6 The plume height. 33
2 .7 Energy balance for the hot layer 39
2.8 Gain and loss rate curves. 42
2.9 Intersections and evolution o f the gain and loss rate curves. 44
2.10 Bifurcation diagram. 46
3.1 Example o f a bifurcation diagram. 63
3.2 A typical fold bifurcation. 66
3.3 The hysteresis singularity. 68
3.4 The isola singularity. 69
3.5 The transcritical singularity. 70
3.6 Varieties for the pitchfork. 71
3.7 Unfoldings o f the transition hysteresis singularity. 73
3.8 Unfoldings o f the transition isola singularity. 73
3.9 Unfoldings o f the transition transcritical singularity. 73
3.10 A geometrical representation o f the Newton-Raphson method. 78
3.11 The predictor-corrector method. 80
3.12 Failure o f the Euler-Newton method at a fold. 82
3.13 Local parameterization 83
3.14 Comparison o f path following methods. 85
3.15 A schematic outline o f the SVD pseudo-inverse Newton method. 87
Page 4.1 A typical bifurcation diagram for the simplified radiation
feedback model. 94
4.2 The two qualitative types o f (%, a) bifurcation diagrams. 94
4.3 The (by parameter map. 96
4.4 The bifurcation diagram with additional boundary box. 98
4.5 Boundary bifurcation types. 99
4.6 The (7, r) parameter map. 101
4.7 The {b, parameter maps. 103
4.8 The bifurcation diagrams corresponding to the regions shown
in figure 4.7. 104
4.9 Varieties dividing the (û, b) parameter plane. 107
4.10 The X vs bifurcation types corresponding to the regions
shown in figure 4.9. 108
4.11 Temperature time histories for varying ventilation parameter. 110
4.12 Temperature time histories for varying radiation feedback parameter. 110
4.13 Temperature time histories for varying free bum parameter. 110
4.14 Comparison o f steady state and transient curves. 112
4.15 Temperature time histories indicating the effect o f fuel consumption. 112
4.16 Varieties for the Thomas vitiation model. 115
4.17 The X vs bifurcation types corresponding to the regions
shown in figure 4.16. 116
4.18 Varieties for the Takeda combustion efficiency model dividing
the (m^, b) plane. 119
4.19 The x \ s a bifurcation types corresponding to the regions
shown in figure 4.18. 120
4.20 Varieties for the Takeda combustion efficiency model dividing
the (fl, b) plane. 122
4.21 The X vs bifurcation types corresponding to the regions
Page 4.22 Transient temperature time histories for the Takeda combustion
efficiency model. 125
4.23 Temperature x, as a function o f fuel mass fraction u. 125
5.1 Rate o f heat release necessary for flashover predicted by the
M cCaffrey method. 129
6.1 The scale compartment used in the experiments. 135
6.2 Photographs o f the scale compartment. 136
6.3 Upper layer temperature and fuel mass loss rate time histories. 139
6.4 Photograph sequence for the (small) 75 mm side fuel tray. 141-142
6.5 Photograph sequence for the (large) 185 mm side fuel tray. 143-146
6 .6 Theoretical and experimental comparison for polyethylene showing
mass loss rate vs fuel tray area. 149
6.7 Theoretical fold and fuel/vent transition lines as a function o f fuel
area and vent width, together with experimental data for polyethylene. 151
6 .8 Theoretical and experimental comparison for PMMA showing mass
loss rate vs fuel tray area. 154
6.9 Theoretical and experimental comparison for PMMA showing mass
loss rate vs vent width. 156
6.10 Theoretical fold and fuel/vent transition lines as a function o f fuel
Tables
Page 5.1 Data for PMMA, polyethylene and wood fuels. 132
5.2 Results o f the flashover index calculation. 132
6.1 Steady state results from scale compartment fire experiments. 138
6.2 List o f parameter values used in model simulations for
polyethylene fuel. 148
6.3 List o f parameter values used in model simulations for PMMA fuel. 153
6.4 Comparison o f flashover predictions with experimental results for
polyethylene fuel. 160
6.5 Comparison o f flashover predictions with experimental results for
1. Introduction
In the modem world, economic factors and new construction methods for modem
buildings change rapidly and the potential consequences o f poor design and organization
are disastrous, as all too poignantly illustrated by fires in the Bradford City Football
Stadium o f 1985 and on the King’s Cross Underground o f November 1987 which killed
56 and 31 people respectively.
The King’s Cross fire starkly illustrated the need for theoretical based fire studies to
complement empirically based methods. Further, in the aftermath o f that particular
tragedy, deterministic models played a valuable, if not cm cial, role in determining the
events which might have lead to such a fire. The last decade has seen a substantial
increase in the mathematical modelling o f fire development within buildings. In
particular, a number o f deterministic models have been developed to characterise the
dynamical behaviour o f compartment fires within buildings and their usage will almost
certainly increase as fire safety engineers attempt to evaluate fire hazard and risk.
Models o f this kind have a two-fold importance; (a) in direct practical terms such as
assessment o f a specific design, and (b) to aid the understanding o f the fundamental
processes o f fire growth.
A key concept in understanding the disastrous spread o f fire in an enclosed space is the
flashover phenomenon, whereby a relatively small, localised, fire can suddenly undergo
a rapid increase in its rate o f growth and intensity, to engulf the entire compartment.
Such an effect may have played a key role in both the Bradford City football stadium
fire and the King’s Cross Underground fire. In a compartment, flashover is
characterised by a sharp increase in both the burning rate o f the fire itself and the
temperature o f the hot gas layer which forms above it. The sudden, critical nature o f
the flashover transition suggests that a nonlinear process is at work.
The primary aim o f this thesis is to explore some o f the variety o f nonlinear behaviour
on the flashover phenomena, by applying the techniques o f nonlinear dynamics.
It should be noted from the outset that the analysis is, for the most part, limited to
examining the steady state (and multiplicity) behaviour o f the compartment fire models
considered. Nevertheless, this is an important first step, since a complete understanding
o f the equilibria o f a given system is often a prerequisite for the understanding o f its
dynamic behaviour. Furthermore, this limitation is not as restrictive as it might at first
sight seem, since by assuming quasi-static variation o f control parameters it is possible
to infer dynamic behaviour from the underlying steady state response, thus allowing,
for example, dynamic jum p phenomena to be associated with the corresponding
bifurcations o f the steady state system.
Turning to a closer examination o f the contents o f the thesis. Chapter 2 introduces some
basic concepts o f combustion and fire dynamics such as heat transfer, chemical kinetics,
flames and free burning o f liquid and solid fuels. It then moves on to discuss the
elements o f compartment fire modelling and the critical flashover transition, mentioning
some major disasters involving flashover and presenting the treatment o f flashover as
a thermal criticality. Finally four mathematical models o f fire growth in a compartment
are formulated; the simplified radiation feedback model, which considers the influence
o f radiation feedback from the hot gas layer which forms in the upper part o f the
compartment, the Thomas vitiation model, which incorporates the effect o f the
compartment atmosphere becoming vitiated and its oxygen concentration being reduced,
the Takeda combustion efficiency model, which attempts to take into account the
variation o f the efficiency o f the combustion process in terms o f the mixing time and
residence time o f gases present in the compartment and finally an extended feedback
model, incorporating an improved treatment o f the energy balance within the
compartment, suitable for the more quantitative comparisons with experimental data
presented in Chapter 6
Chapter 3 introduces the basic tools for exploring the steady state behaviour of
these techniques allow the dependence o f steady state solutions on the control
parameters and the boundaries or varieties separating regions o f parameter space with
different qualitative behaviour to be traced out.
In Chapter 4, the techniques o f nonlinear dynamics are applied to exploring the
behaviour o f the compartment fire models previously defined in Chapter 2. They are
used to obtain parameter maps and corresponding bifurcation diagrams showing the
effect o f control parameters on the models qualitative behaviour
Chapter 5 examines two methods for predicting the occurrence o f flashover and thus
estimating the likelihood o f flashover occurring in a given compartment.
In Chapter 6, a comparison o f both the qualitative and quantitative behaviour predicted by the improved feedback model, defined in Chapter 2 is made, with data obtained from
scale model experiments for two thermoplastic fuels. The experiments for polyethylene
fuel, were conducted on a 0.4 m box, as part o f a collaborative research project
between the Centre for Nonlinear Dynamics at UCL and the Fire Safety U nit at
Edinburgh University. The photograph sequence o f fire development in the scale
compartment, shown in chapter 6, gives an indication o f the dramatic nature o f the flashover transition and the intensity o f the external flaming generated as a result.
Indeed, the intense heat generated by the flames sweeping out o f the vent, is sufficient
to force a spectator to make a hasty retreat!
Finally, chapter 7 concludes by summarising the findings o f the thesis and briefly looks
2. Fire dynamics and compartment fîre
2.1 Combustion phenomena and fire dynamics
2.1.1 What is fire?
The term fire covers a wide range o f highly complex phenomena combining aspects o f
chemistry, heat transfer and fluid dynamics. To make this slightly more precise we
adopt the following definition taken from W illiams [1982]:
A fire is a chemical reaction o f fu el with oxygen to produce heat, involving heat transfer
and fluid flow.
Synonymous with the expression of fire we have the terms combustion and burning
which are defined as being in the state of activity characteristic o f fires.
The inter-dependence o f the three key elements heat, oxygen and fuel, contained in the
above definition is traditionally summarised in the fire triangle, shown in figure 2.1 [see Thomas 1980]. All three elements must be present for combustion to take place. Thus
fire suppression strategies usually aim to remove one o f the elements at the triangle’s
com ers. However, in order to obtain a more complete picture the fire triangle concept
needs to be supplemented with details of both the way in which the fuel bum s and the
action o f thermal feedback mechanisms.
In most fires the fuel source starts off as either a liquid or a solid. In order for flaming
combustion to occur such a solid or liquid fuel must first usually be heated to produce
a flow of flammable gas. It is this gas (secondary fuel) which actually undergoes
combustion, provided that sufficient heat and oxygen is present to allow the reaction to
take place. The conversion of a liquid fuel into gas is usually achieved by direct
H C 3 . t Necessary for the reaction to proceed produced by the reaction
Combustion reaction occurs when oxygen fuel mixture is hot enough
Oxygen
Mixed in from the surrouding environment
Fuel
Heat on solid/liquid fuel produces gaseous fuels
F igure 2.1. The fire triangle.
Thermal feedback preheats virgin fuel causing it to pyrolyse and encouraging fire spread
Thermal feedback maintains the existing combustion within the fire area.
Fuel bed
required to produce volatile vapours which then mix with the available oxygen. This
process is known as pyrolysis.
The thermal feedback mechanisms from the fire operate in two different ways (see
figure 2.2). Firstly thermal radiation and convected energy is fed back to the original
fuel bed to maintain the flow o f volatiles to combust. Energy released by combustion
heats up the fuel to pyrolyse more gas, which mixes with oxygen and then combusts to
complete the feedback loop. Thus once ignited the fire can become self sustaining. The
second role o f thermal feedback is to preheat the surrounding virgin fuel causing it to
pyrolyse (or evaporate) and thereby encourage fire spread.
Before examining compartment fires in detail we will first briefly review basic heat
transfer and chemical reaction kinetics, which (by definition) both play an important
role in combustion.
2.1.2 Heat transfer
The three basic modes o f heat transfer are conduction, convection and radiation,
(i) Conduction
Conduction is the mechanism o f heat transfer through a solid. It is driven by
temperature differences, with heat flowing from high to low temperature regions. This
process is encapsulated in Fourier’s law o f heat conduction, which (in one dimension)
states that the heat flux q ” (W/m^) over a distance Ax (m), with temperature difference
AT is given by
f = - k — (2.1)
Ax
or in differential form
(2.2)
where the constant k is the thermal conductivity o f the medium (W /m ^K ). Note that
" means per unit area; see the list o f symbols after chapter 7. Under steady state
conditions, integration o f equation 2.2 for a wall o f thickness L and with boundaries at
temperatures Tj and gives
q"
= I (r, - r,)
(2.3)
For transient conditions application o f equation 2.2 to a differential volume element,
together with T aylor’s theorem results in
E Æ (2.4)
Bx
dx^
where a = kipc (mVs), is the thermal diffusivity o f the medium.
(ii) Convection
Convection is defined as the exchange o f heat between a fluid (gas or liquid) and a solid
involving movement o f the fluid medium. If the fluid flow is associated with externally
imposed velocities, such as wind, then the heat transfer is termed to be forced
convection. If however the fluid flow is generated by buoyancy forces, then the
transport of thermal energy is termed free or natural convection. The convective heat
flux relation is
q" = h A T (2.5)
where h is the convective heat transfer coefficient (W/mVK). It is a function of
properties o f the fluid and the fluid flow, geometry o f the solid and temperature. For
free convection typical values range from 5-25 W/m^/K, while for forced convection
the range is usually 10-500 W/m^/K.
The convective heat transfer process occurs close to the surface o f the solid in a region
known as the boundary layer. The value o f the convective heat transfer coefficient is
determined by the characteristics o f this boundary layer. For example, in the case of
from the free stream value to zero due to the presence o f the plate surface, thus forming
a layer. The thickness o f the layer will depend on the Reynolds number (Re) o f the
flow, which can be regarded as the ratio o f inertia forces to viscous forces. Similarly
if the plate and the fluid are at different temperatures a thermal boundary layer will
form with a thickness which can be determined using Fourier’s law o f conduction. The
ratio of the thickness o f these two boundary layer itself depends on the Prandtl number
(Pr) which relates the fluid’s momentum diffusivity to thermal diffusivity and provides
a measure o f the ease with which heat and momentum may be transferred to the fluid.
The convective heat transfer coefficient is traditionally expressed in terms o f the Nusselt
number (Nu) which provides a measure o f the ratio o f temperature gradients
N u = A i (2.6)
k
where k (W/mVK) is now the thermal conductivity o f the fluid and I (m) is a
characteristic dimension o f the surface. Using the above relationships for the two
boundary layers in conjunction with the convective heat flux equation (2.5), the Nusselt
number (and thus h) for forced convection can be expressed as a function o f the
Reynolds and Prandtl numbers:
= / ( R e , P r ) (2.7)
In the case o f free convection the Reynolds number is replaced by the G rashof number
(Gr), which gives a measure of the ratio of upward buoyancy forces to viscous drag:
= / ( G r , P r ) (2.8)
A table o f such relations for different flow regimes and geometries can be found in
Kanury [1975]. In many fire problems the Prandtl number can be assumed to be unity
[Williams 1982].
(Ü1) Radiation
Radiation is the mechanism o f heat transfer by electromagnetic waves, occupying a
play a major role in fire problems and is often the dominant mode o f heat transfer.
Unlike conduction and convection, the radiation heat flux has a highly nonlinear
temperature dependence given by the Stefan-Boltzmann equation:
il" = <i>eaT'^ (2.9)
where a is the Stefan-Boltzmann constant (5.67 x 10** W/mVK'^), e is a coefficient
providing a measure o f the surfaces effectiveness as a radiator and is a configuration
or view factor which determines how much radiation will be received at a remote
surface found by considering the geometrical relationship between em itter and receiver.
Surface emissivities for most materials o f interest in fires usually lie in the range 0.5
< € < 1 [Williams 1982]. For luminous flames and hot smoky gases the emissivity
depends on the thickness or mean beam length o f the radiation in the flame or gas, L
(m), and concentration o f soot particles (usually written in terms o f an effective
emission coefficient K (m*‘)), which can be expressed by the relation:
e = 1 - e x p ( - K l ) (2-10)
The configuration factor is determined by the inverse square law o f flux intensity,
together with the spatial extent of, and the relative angles between em itter and receiver.
2.1.3 Chemical kinetics and flames
Chemical conversion is the process where by chemicals in one form are transformed
into other forms. The types o f chemical conversion possible are determined by
molecular structure which in turn are dictated by chemical bonding. Energy can be
liberated during the formation o f such chemical bonds.
Many o f the solid fuels involved in fires are polymers, such as polyethylene,
polystyrene and polymethylmethacrylate which are constructed from large molecules
formed by chaining identical molecular units together. When they burn they first soften
and then form a liquid-like melt. A simplification for polymer pyrolysis is the concept
enhance the reaction rate. Chain carriers are formed in initiation steps, cause the
reaction to proceed in chain-carrying or propagation steps and are consumed in
termination steps. The self-accelerating nature o f chain branching reactions is highly
nonlinear and can lead to an explosion in the reaction rate.
Rates o f polymer pyrolysis may be described by an expression for dm/dt the time rate
change o f concentration m (kg/m^) of the polymer, according to a simplified first-order
reaction scheme,
m = = - k 'm (2.11)
d r
The rate constant, k! (s'^ has a strongly nonlinear dependence on the temperature T (K)
o f the Arrhenius form:
k ' = X e x p ( - E ^ /7^T ) (2.12)
where is the activation energy (J/mol), R is the gas constant (J/K/mol) and A is the
pre-exponential factor (s'*).
The combustion reaction which occurs in the flames o f fires is a chemical combination
o f fuel with air to produce products and heat:
Fuel + Oxygen -» Products + Heat (2.13)
The chemistry o f such combustion reactions generally consist o f complex chain
reactions composed o f many elementary steps. To simplify the analysis an overall
single-step, second order, chemical reaction can be introduced:
^
=- c ^ c „ A t \ ^ { - E J R T )
(2
.14
)where Cp and Cq are the concentrations o f fuel and oxygen respectively, and the Arrhenius form for the rate constant has once again been employed.
rate at which the chemical reaction proceeds (the rate o f consumption) and by the rate
at which oxygen from the surrounding air can diffuse and mix with the gas vapour in
the flame (the rate o f supply). In general the slowest o f these two characteristic rates
will determine the speed with which the overall combustion reaction occurs. On this
basis combustion reactions can be divided into those which are prim arily controlled by
chemical kinetics and those which are primarily governed by diffusion, flow and other
physical mixing processes. Combustion reactions which are kinetically controlled tend
to be spatially homogeneous with uniform temperature and species distributions, while
diffusion control tends to lead to strong spatial localization, with both temperature and
species gradients.
A flame is defined as a burning gas. Flames are generally classified into two types;
premixed and diffusion. In premixed flames the fuel vapour and oxygen are mixed prior
to combustion. The reaction rate is therefore chiefly determined by reaction kinetics.
In diffusion flames the fuel and oxygen are separated until mixing in the combustion
zone. In this case it is the (slower) physical mixing and diffusion processes which
determine the rate at which the reaction proceeds.
A typical example o f a diffusion flame occurs in the burning candle (figure 2.3). Heat
from the flame vaporizes fuel (wax) from the wick. The flame formed by the reaction
o f this vapour can be sub-divided into several distinct regions. Firstly there is a dark
region close to the base which is fuel rich having an inadequate supply o f oxygen for
complete oxidation. Outside this there lies a blue, burning zone, where the external
oxygen supply diffuses into the flame and meets the fuel vapour. Finally above these
two zones is the yellow region produced by radiation from the hot soot particles formed
Luminous zone of incandescent soot (yellow)
Main reaction zone
Soot formed (dark)
Burning zone where oxygen diffuses into the flame (blue)
Fuel vaporized
Fuel (wax) liquefied
2.1.4 Steady burning of liquid and solid fuels.
In a typical fire the burning o f liquid or solid fuels results in diffusion flames. In order
for these flames to be self sustaining, heat must be transferred to the fuel to maintain
a supply o f gas volatiles ready for combustion. The rate at which the fuel is volatilised
Mp is a function o f the net heat flux incident on the fuel, (W/m^), the fuel surface
area, (m^) and the heat required for vaporisation o f the fuel, (J/kg) and can be
expressed as:
M,= " ^
(
2
-
15
)
For a free burning fire with an unrestricted air supply, it is the supply rate o f fuel
volatiles which determines the rate o f burning and controls the rate o f heat release o f
the fire, Qj (W) given by
(2 16)
where x is the combustion efficiency, giving a measure (0< x : ^ 1) o f the completeness of the combustion reaction and (J/kg) is the heat of combustion o f the volatiles.
The combustion efficiency is typically assigned a constant value, although more detailed
2.2 Elements of compartment fire modelling
2.2.1 Stages o f a co m p artm en t fire
Compartment fires are defined as fires occurring in rooms or similar enclosed spaces
within a building. In an idealised form a compartment fire’s development in time can
be divided into several potential stages:
1. Ignition: The fuel begins to bum .
2. G ro w th : Growth in fire size occurs as a result o f flame spread over and heating
o f the fuel source. While the fire is still small in relation to the compartment it
>Vill effectively develop as if it were burning in the open, until a point is reached
where the interaction with the compartment becomes important.
3. Flash over: The transition from the localised burning to full compartment
involvement, representing a critical change in nature o f the fire via a rapid jum p
in both size and intensity. Survival o f any occupants is highly unlikely once
flashover has occurred.
4. Fully developed fire: The rate o f heat release reaches a maximum (as does the
compartment temperature), with all combustible items within the compartment
burning and flames emerging from any ventilation openings.
5. Decay: Once the fuel supply becomes exhausted, the fire burns out and the
compartment cools down.
These stages are visualised in figure 2.4, though not all stages will necessarily occur.
Thus for example a small fire might reach the growth stage, but then exhaust its fuel
supply and go into decay before flashover can be achieved. Alternatively a fire may
TEMPERATURE RISE
FULLY DEVELOPED FIRE FLASHOVER
DECAY
IGNITION
GROWTH
TIME
occunng.
2.2.2 Approaches to modelling fire In a compartment
In recent years there have been a number o f deterministic models developed for fire
growth within compartments. These have tended to fall within the two categories o f (a)
zone models, and (b) field models.
In zone models the compartment is divided up into a small number o f control volumes
or zones over which conditions are assumed to be uniform forming a lumped parameter
system. During the course o f a typical room fire, hot products released by the fire form
a plume, which due to buoyancy rises towards the ceiling. As this plume rises it
entrains cool air from within the compartment. When the plume reaches the ceiling it
spreads out and forms a hot gas layer, which descends with time as the plume gases
continue to flow into it. A relatively sharp interface forms between the hot upper layer
and the air in the lower part o f the compartment. As the hot gas layer descends and
reaches openings in the compartment walls, hot gas flows out from the upper layer and
fresh air form outside flows into the lower layer. This description o f a compartment fire
is known as a two layer zone model. Note that in such models the fire plume is usually
regarded as part o f the upper layer.
A common simplifying assumption applied to two zone models, is that the lower layer
remains at approximately the ambient air temperature. In this case only the energy and
mass balance o f the upper layer hot gases (i.e. only a single zone) need be considered.
Simplifying still further, the entire compartment can be treated as a single zone ‘well
stirred combustion chamber’ by assuming that the compartments gas temperature
distribution can be treated as uniform, giving an overall, average compartment
temperature. Moving in the opposite direction more zones can be introduced to
encompass other components o f the compartment fire such as the fire plume or fuel
The main advantage o f the zonal approach is the reduction o f the system to a small
number o f ordinary differential and algebraic equations which can be handled relatively
comfortably, even by fairly modest personal computers. The disadvantages o f zone
models are that they only provide a ‘broad brush’ overall picture o f events, with no fine
detail and that they are restricted to regular geometries, using semi-empirical
expressions where the necessary apriori modelling assumption (e.g. formation o f hot
upper and cool lower zones or just one uniform temperature distribution) are likely to
apply.
Two o f the most renowned zone models are Harvard 5 [Emmons 1979, 1983, Mitler
1985] and FAST [Jones 1985] which may both be used to predict a range o f variables
such as temperature, hot gas layer depth, heat output, and gas concentration. Examples
o f simplified one zone models of compartment fire are given by Takeda and Akita
[1982], Takeda [1983, 1987] and Takeda and Yung [1992].
In the case o f a field model the compartment is divided up into a (relatively) large grid
or mesh and field variables, such as temperature and gas concentration, are defined at
each grid point (forming a distributed parameter system). In order to model the fire and
trace the development o f the field variables, the solution to the governing partial
differential equations for conservation o f heat, mass, momentum and species a large
number (typically thousands or tens o f thousands) o f grid points must be found
numerically, taking into account the relevant source terms and boundary conditions and
introducing an appropriate turbulence model. Such an approach, based on computational
fluid dynamics (CED) codes, yields a far more detailed picture o f the development o f
the fire and smokes within the compartment, and can (in principle) be applied to
configurations for which no apriori experience exists. However, the application o f such
models requires very intensive numerical computation, together with the processing of
a large amount o f data input (and output). A prom inent field model is JASMINE
2.2.3 Flow induced by fire in a compartment
The prim ary elements governing the flow induced by a fire in a compartment are the
flow o f gas through the ventilation opening (e.g. door or window) and the entrainment
of air by the fire into its plume. The plume acts like a pump, transferring air to the
upper regions o f the compartment, while the vent behaves like a throttle, restricting the
flow rate [Rockett 1976]. In line with the two zone formulation described in section
2.2 .2 the gas is assumed to be divided into fire heated, hot gases in the upper volume o f the compartment and cool ambient air below, separated by a thermal discontinuity
plane. The distance o f this plane above the compartment floor is the discontinuity height
(m). Tracing the flow around the compartment, fresh air first enters through the
lower portion o f a ventilation opening in one o f the compartments walls. This incoming
air then approaches the fire where it is entrained into the fire plume, heated and
pumped into the hot gas layer. Once in the upper layer a large proportion o f the gas is
once again entrained by the plume, forming a circulating eddy which has a mixing
effect. The remainder o f the hot gas flows out o f the upper part o f the vent (see figure
2.5).
The vent flow is generated by the temperature variations between the room and its
surroundings which in turn creates pressure differences. The pressure differences across
the vent are calculated around the neutral plane, below which cold air enters and above
which hot gas leaves (the distance o f this plane from the compartment floor is the
neutral height Z„ (m)). From Bernoulli’s equation for hydrostatic pressure flow and
energy conservation the kinetic energy o f air accelerated from rest is equal to change
in static pressure A/? (Pa),
B . u ^ = A p (2.17)
2
'
Plum e Hot gas
Recirculating gas
Thermal discontinuity
H
Am bient air
Entrained air
y
FlameV
Fuelp u = yj2p A p (2-18)
where p is the gas density (kg/m^) and u is the gas velocity (m/s). Calculating the
pressure differences, integrating over the height o f the vent above the neutral plane and
applying the density relation for the hot gas derived from ideal gas equation,
p = f ÿ s
(2.19)
(where the subscripts g and 0 refer respectively to hot layer and ambient gas properties)
produces an expression for the mass flow rate o f gas out o f the vent [Rockett 1976,
Drysdale 1985]:
2 g 1 - ^ ) ( 1 - N ) ^ (2.20)
where is a vent discharge coefficient introduced to take into account the constriction
o f the gas flow when passing through the vent, g is the gravitational constant (m/s^),
N=ZfJH^ is the non-dimensionalised neutral plane height (see below) and and are
respectively the width and height o f the vent (m). This analysis can be repeated below
the neutral plane to give the mass flow o f air into the compartment:
(2 2 1)
where D=ZJH^ is the non-dimensionalised discontinuity plane height. Using continuity
of mass flow, Rockett shows that these two terms can be equated to obtain an
expression for the neutral plane height as a function o f the discontinuity plane height
z ,.
Z, = /( Z ,)
(2.22)
For a fully developed fire the discontinuity height is zero and the neutral plane height
will be approximately half way up the vent. In addition, the temperature dependent part
temperatures typically encountered in fully developed compartment fires and can
therefore be replaced by a fixed value. Applying these results to the case o f a fully
developed compartment fire, the expression for the mass flow rate o f air reduces to the
form originally suggested by Kawagoe 1958:
This formula illustrates the importance o f the ventilation factor, as a controlling
param eter o f the mass air flow rate into a compartment.
The other important element controlling compartment gas flows is the plume. A plume
is a convective column rising above a source o f heat, formed by buoyancy forces
produced by density differences in adjacent masses o f fluid. The process o f drawing the
surrounding air into a fire is known as entrainment. In turbulent plumes entrainment is
due to turbulent eddies. Relationships for the mass flow rate o f air entrained into a
buoyant plume can be obtained by performing dimensional analysis on the appropriate
conservation equations for mass, momentum and energy. The mass o f air entrained into
the plume can then be shown to be a function o f plume height, (m) and the
convective energy driving the plume, which can be expressed as some fraction o f the
total heat release rate o f the fire, Qj (kW):
K = / ( C / . Z , ) (2.24)
Note that the plume height measures the height above a virtual point source (beneath
the floor o f the compartment, see figure 2.6). A particular example o f such a
relationship is the model for plume entrainment developed by Zukoski et al. 1981:
1 1 5
(2.25)
Hot layer
Entrainment
Virtual source
At steady state, the total entrainment into the plume below the discontinuity height
equals the flow into the enclosure while the total plume upward flow at the discontinuity
height equals the flow leaving the enclosure. Equations (2.20) and (2.25) together with
(2.2 2) give relationships for both the flow leaving the enclosure and flow entrained into the plum e as a function o f the discontinuity plane height. The point where these two
2.3 Flashover and jump phenomena
2.3.1 Definitions of flashover
Flashover is a critical stage in the growth o f a fire within an enclosure, representing the
rapid transition from localised burning to full room involvement. As such it qualifies
as one o f the most terrifying physical phenomena associated with fire growth. In a
compartment flashover is characterised by a sharp increase in both the temperature o f
the upper gas layer and the burning rate o f the fire itself. As might be expected a room
fire is much more difficult to extinguish after flashover has occurred. There is no one
universal definition o f the term ‘flashover’, although it is generally accepted that it is
a dynamic phenomena characterised by a sudden and dramatic increase in the burning
rate o f a developing fire. Possible flashover mechanisms and corresponding flashover
criteria, may include one or more o f the following [Thomas 1983]:
1. U nbum t gases collecting in the upper layer o f a compartment may ignite either
spontaneously or as the base o f layer descends to the top o f flames. Since the
flame tip temperature is o f the order o f 400-500'C , it is reasonable to expect
that the hot gas layer will be in this temperature range at the onset o f flashover.
Flashover via this mechanism may also be distinguished by flames emerging
from out o f the ventilation openings (i.e. ignited gases flowing out o f the vent).
A rapid increases in fire size occurring due to spontaneous ignition o f all the
remote fuel sources present in the compartment. Combustible material, remote
from fire, but seen by it may be heated by the thermal radiation processes to
ignition point or to the temperature at which it pyrolyses. The typical threshold
for such an ignition process has been estimated by W aterman [1968] to be
around 20 kW/m^ radiation flux incident on the floor o f the compartment. Such
a heat flux is capable of supporting effectively instantaneous flame spread rates
3. A fire progressively increasing in area in a quasi-steady fashion produces
thermal feedback which can eventually leads to the occurrence o f a thermal
instability, resulting in a rapid increase in both burning rate and compartment
temperature. This and similar mechanisms, first suggested by Thomas et al.
[1980] are discussed in greater detail in section 2.3 .3 .
4. A fire increasing progressively in area to involve all the fuel, reaching its
maximum size, whilst remaining fuel-controlled (that is the burning rate is
limited by the rate o f fuel supply - see section 2.3.3) but being a fully developed
fire, it might still be described as having reached flashover
5. If the initial fire is large enough the transition to ventilation control could occur
without thermal instability. This transition, whereby the fire gradually grows to
involve the whole space, may also be perceived as a form o f flashover
A criteria for flashover that may be applicable to mechanisms 4 and 5 (and also
mechanism 1) is that suggested by Hagglund et al. [1974] who proposed that a
temperature rise in the upper gas layer of between 500-600 *C can demarcate between
those fires judged to have reached flashover and those which do not.
2.3.2 Examples of flashover
Three examples o f major fire disasters involving flashover have occurred at the
Summerland Leisure Centre in the Isle o f Man in 1973, the Stardust Disco, Artane,
Dublin in 1981 and most recently at King’s Cross Underground Station, London in
1987 [Rashbash 1992]. In all three cases many fatalities were caused by a sudden
extensive development of fire following a period in which the fire was much smaller.
At the Summerland Leisure Centre a very rapid fire spread took place in the amusement
arcade which occupied the lower part o f the leisure complex. The fire developed unseen
arcade. This cavity shared a common wall with the arcade made from decalin fibre
board, while the opposite face was an outside wall constructed from sheet steel. The
cavity was ignited by heat transferred through the external wall from a plastic booth
outside which was set on fire by children. The confines o f the cavity meant that air had
limited access and so a ventilation controlled, fuel rich fire developed. Once the fibre
board burned through a large volume o f fuel rich gas was ejected into the arcade, acting
as a powerful ignition source to the combustible wall surfaces present there. The
emerging flame was approximately 1 m long and was capable o f delivering 100 kW /nf
to neighbouring surfaces. Such a source enabled flame spread to occur along the length
o f the arcade within a very short space o f time.
In the case o f the Stardust club the initial fire involved an alcove having a stepped floor
with a row o f seats on each step. An ignition source on back row o f seats led to the
development o f a line fire along the seating. Flames then ignited the carpet tile lined
back wall, which quickly became fully involved to give an estimated source o f 100
kW/m^. Rapidly all the seats in the alcove began to bum with flames and smoke then
spreading to the main body o f the ballroom. The array o f seats thus acted as an
extensive surface which could respond to very high heat transfer rates that were
produced by the burning back wall.
The King’s Cross Underground station fire involved a wooden escalator leading to the
ticket hall. It started in the middle o f the escalator as a relatively small fire and
remained in that state for approximately 15 minutes before suddenly accelerating up the
escalator and exploding into the ticket hall as a wall o f flame and thick black smoke.
Analysis o f the incident using the field model at Harwell indicated that fire was
confined to the escalator trench for a significant time focusing the energy released and
promoting an exponential rate o f flame spread up the escalator once the fire became
sufficiently established (the so called ‘Trench Effect’). The board o f inquiry decided
that this was the mechanism o f rapid fire spread responsible for the incident. However,
Rashbash has proposed an alternative mechanism which he believes may have also
advertising hoardings (also observed by surviving eyewitnesses) could have produced
a line source giving heat transfer to the ceiling o f approximately 100 kW/m^, igniting
the ceiling paint and engulfing the ticket hall in approximately 2 0 seconds.
The common factors in all three cases are a local fire producing high rates o f heat
transfer which is incident on an extensive fuel surface area which can respond rapidly.
This mechanism is different from the classical model associated with flashover in a
small room where smoke and hot gas build up under ceiling, irradiating downwards on
to the combustible surfaces at about 20 kW/m^. However within the framework of
nonlinear dynamics these mechanisms are both examples o f rapid jum p phenomena.
Thus even though the analysis presented here is restricted to the more simple
mechanism o f flashover in a compartment we may hope to also gain qualitative insights
into the more complex jum p phenomena leading to the major fire disasters described
above.
2.3.3 A qualitative model for flashover and instabilities
To gain a qualitative insight into the occurrence o f flashover via a thermal instability
we follow the approach o f Thomas et al. [1980] and consider an idealised energy
balance o f the fire plume and hot gas layer forming below the ceiling in a compartment
fire (neglecting fuel consumption). The energy balance for the hot gas layer and fire
plume is o f the form:
. G ( T , f ) - L ( T , f ) (2.26)
at
Here G{T,t) and L(7,r) are respectively the rate o f gain and loss o f energy o f the layer
and E includes both internal energy and work terms. The energy o f the smoke layer and
hence its temperature is therefore governed by the forms o f gain and loss which are
functions o f gas layer temperature, T, and time, t. The energy balance is shown
schematically in figure 2.7. Here the total loss of energy from the hot gas layer is
Loss
Hot Layer
Air Inflow
by conduction through and into the walls while L0SS2 represents energy lost via convective flow o f hot gas through the vent (which can be either a door or a window).
Air also flows into the compartment through the lower part o f the vent. The gain rate
o f energy o f the hot layer is chiefly determined by the burning rate o f the fire, which
itself is governed by two factors:
(a) Whether the fire is fuel or ventilation controlled.
As outlined in section 2.1.3 a combustion reaction requires the presence o f both air
(oxygen) and fuel (vapour). The burning rate o f a compartment fire is therefore a
function o f both the rate at which air flows into the compartment and the rate at which
fuel is volatilized, with the overall burning rate being limited by whichever o f the two
quantities is in shortest supply. Note that we are assuming here that the rate of
consumption, controlled by chemical kinetics (as described in section 2.1.3) is much
faster than the rate o f supply (also known as the ‘mixed is b u m f assumption). Thus,
two distinct regimes o f burning are observed in compartment fires. F or the reaction
(equation 2.13) a fire with a perfect ratio (balance) o f air to fuel is termed
stoichiometric, r. In the case of excess air, the ratio o f air to fuel mass flow is greater
than stoichiometric and the fire is fu el controlled (i.e. limited by the amount o f fuel
flow). In this case the burning rate is effectively that of a fire burning in the open and
the energy release rate is identical to that described in section 2.1.4:
M
G = = i f ^ > r (2.27)
Mf
Conversely, in the case o f an insufficient air flow rate, the ratio o f air to fuel flow is
less than stoichiometric and the fire is limited by the rate o f <dr flow into the
compartment. This regime o f burning is termed ventilation controlled and has an energy
G = à = x — H , i f ’^ < r (2.28)
The switch-over between these two burning regimes, constitutes the first key nonlinear
behaviour o f the model.
(b) The radiation feedback mechanism from the hot layer.
An increase in temperature of the layer will result in it emitting more radiation to the
base o f the fire. This will increase the burning rate o f the fire and hence the amount o f
energy released into the layer. The energy increase of the layer will in tiim increase its
temperature and a positive feedback loop is created. Assuming that (for qualitative
analysis) the emissivity o f the fire base can be taken to be unity, the total heat flux to
the fire base is given by,
+ /c<r(7‘ - r / ) (2-29)
where 7], is the temperature o f the fire base, T is the temperature o f the hot layer, a is
the Stefan Boltzmann constant and is the free-bum term. The first term represents
the heat flux that would be generated by a fire burning in the open (i.e. radiated from
the flame itself to its own base). The second term represents the radiation feedback
from the hot layer and thus the influence o f the compartment on the fire. The
coefficient x incorporates the effects o f room geometry, emissivity o f the layer etc on
the amount o f feedback generated. If we assume the temperature o f the fire base, 7],,
to be approximately constant, then G will share the T dependence displayed by
Thus the fourth power temperature dependence o f radiation feedback is the source of
the second major nonlinear behaviour o f the model.
Having outlined the form o f the governing factors we can now sketch the gain rate as
a function o f temperature as shown in figure 2.8(a). At T^, the gain is at a constant
value corresponding to the energy that would be generated by the free standing fire. As
temperature increases, the radiation feedback mechanism exerts its influence resulting
Ventillation controlled (constant air flow) Energy
gain rate of layer
Generalised
Fuel controlled
T Temperature of upper layer
Figure 2.8(a). Gain rate curve.
L Energy loss rate loss rate
of layer Including Radiative losses Linear assumption
0
Temperature of upper layer T
reached where the fire becomes ventilation controlled. In the simplest case where a
constant flow o f air into the compartment is assumed, the gain rate then becomes
constant. A relaxation o f this requirement results in a downward curvature o f the
function, in the ventilation controlled regime.
The rate o f energy loss o f the layer, as previously mentioned is given by a combination
o f energy losses from the hot gas flowing out o f the vent and heat being conducted
through the walls o f the room. Both o f these processes are driven by the temperature
difference between the layer and the surroundings. Sketching the form o f loss rate as
a function o f temperature shown in figure 2.8(b), it is zero at since the temperature difference is zero. For simplicity, loss is then assumed to be linear in T. A more
comprehensive form o f loss rate would include radiative losses resulting in an upward
curvature o f the function.
Having arrived at the forms of the gain and loss curves we can now plot them together
(note that we are assuming that the depth o f the smoke layer is fixed). The intersections
o f the two curves will determine the steady state solutions o f equation (1). Figure 2.9(b)
shows three different loss curves L I, L2 and L3 which could, for example, represent
different room sizes, ventilation conditions or types o f wall material/thickness. It can
be seen that depending on the relative positions o f the two curves there can be up to
three types o f intersections denoted by A, 2, B and C, 2. An intersection at point A, or A2 corresponds to a large ventilation controlled fire whilst point Cj or C2 represents a small localised fire. Both states are stable with respect to temperature fluctuations. In
contrast an intersection at point B is unstable since a slight perturbation in temperature
will result in either a fall to point C2 or a rise to point A^.
The gain and loss rate curves shown in figure 2.9(a) are a snapshot at one particular
instant o f time. In general the two curves can be considered to shift relative to one
another as time passes (this might be due, for example, to heat losses through and into
the walls being reduced as the walls heat up or by the energy gain o f the layer being
Gain and Loss Rates
0
T Temperature of upper layer T
a
Figure 2.9(a). Gain rate and three loss rate curves LI, L2 and L3
illustrating possible types of intersections.
L drifts down with time
Gain & Loss R ates
Jum p to A
Tem perature of up per layer
Fold Bifurcation
down with time as shown in figure 2.9(b). We assume that this movement is slow in
comparison with change in the energy balance o f the hot gas layer so that the fire will
be at a steady state (quasi-steady approximation) at any given instant o f time. A fire
represented by intersection C would then move up the gain curve until it eventually
encountered intersection B, resulting in a fold bifurcation [see chapter 3]. This would
lead to a sudden jum p in temperature o f the layer, to the large ventilation controlled fire
represented by state A. We identify this jum p in layer temperature and burning rate o f
the fire as one mechanism fo r flashover. It should also be noted that the jum p
phenomenon will persist provided that the qualitative forms o f the gain and loss curves
are such that a tangency between the two curves is still possible.
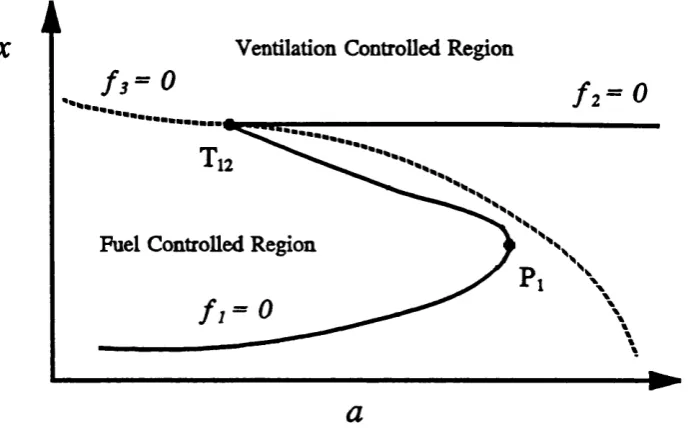
Figure 2.10 shows a schematic outline o f such a fold bifurcation, in the form o f a
bifurcation diagram (see section 3.2). In this example the fire area Ap plays the role of
controlling parameter. A fire with initial area, Ap, begins as a small fire with a
correspondingly low layer temperature, on branch C. As the area o f the fire increases,
the layer temperature ‘walks’ along branch C. Eventually it encounters the unstable
branch B, at critical fire area, Ap, and a fold bifurcation occurs (point P J . This folding
over o f the lower branch results in the layer temperature making a sudden jum p up to
branch A. A fuel to ventilation control transition is also present at point Tj2. Thus a fire on branch A which has its burning area reduced will eventually encounter Tj2 and will undergo an extinction jum p down to branch C. The complete bifurcation diagram with
fold ?i and transition point T,2 put together has the form o f an S shape curve, which is well known in thermal explosion theory. Such hysteretic behaviour has been
demonstrated both computationally and experimentally [Quintiere 1979, Takeda and
Akita 1981, Hasemi, Y and Tokunaga T ., 1983]. Hasemi [1981, 1982] has also
developed models which display similar behaviour, using a simple Arrhenius form
Hot gas layer
temperature Branch A
Flashover jump to branch A \ Branch B
Extinction jump to
branch C
Fold bifurcation Branch C
Fire Area