Natural Hazards and Earth System Sciences (2003) 3: 115–128 c
European Geosciences Union 2003
Natural Hazards
and Earth
System Sciences
The use of NOAA/AVHRR satellite data for monitoring and
assessment of forest fires and floods
C. Domenikiotis1, A. Loukas2, and N. R. Dalezios1
1Laboratory of Agrometeorology, Dept. of Agriculture, University of Thessaly, Fitokou Str, N. Ionia, 38446 Volos, Greece 2Department of Civil Engineering, University of Thessaly, Greece
Received: 11 February 2002 – Revised: 19 June 2002 – Accepted: 18 July 2002
Abstract. The increasing number of extreme natural phe-nomena, which are related to the climate variability and are mainly caused by anthropogenic factors, escalate the fre-quency and severity of natural disasters. Operational mon-itoring of natural hazards and assessment of the affected area impose quick and efficient methods based on large-scale data, readily available to the agencies. The growing number of satellite systems and their capabilities give rise to remote sensing applications to all types of natural disasters, includ-ing forest fires and floods. Remote sensinclud-ing techniques can be used in all three aspects of disaster management viz: fore-casting, monitoring and damage assessment. The purpose of this paper is to highlight the importance of satellite remote sensing for monitoring and near-real time assessment of the affected by forest fires and floods areas. As a tool, two satel-lite indices are presented, namely the Normalized Difference Vegetation Index (NDVI) and the Surface Temperature (ST), extracted by the meteorological satellite NOAA/AVHRR. In the first part of the paper, a review of utilized techniques us-ing NDVI and ST is given. In the second part, the application of various methodologies to three case studies are presented: the forest fire of 21–24 July 1995 in Penteli Mountain near Athens and 16 September 1994 in Pelion Mountain in Thes-saly region, central Greece, and finally the flood of 17–23 October 1994 in Thessaly region, central Greece. For all studies the NDVI has been utilized for hazard assessment. The method of ST has been applied to the flood event in Thessaly, for the estimation of the areal extent of the floods. As emerged from the studies, remote sensing data can be de-cisive for monitoring and damage assessment, caused by for-est fires and floods.
1 Introduction
Natural hazards are internationally recognized as phenomena of special importance. The list of the most commonly occur-Correspondence to: C. Domenikiotis (cdomen@uth.gr)
ring natural hazards includes: asteroid, avalanche, drought, earthquake, flood, hurricane, insect infestation, landslide, volcanism, forest fire, tornado, and tsunami. There is an in-creasing interest of the international community in the study of natural hazards, mainly due to the possible climate inten-sification by human factors. Exposure to hazard can be con-trolled as well as an effort can be undertaken to alleviate the effects of a hazard should one occur. There are five steps, which outline the elements of hazard monitoring and man-agement:
– Increase preparedness and prevention, which involves activities designed to provide permanent protection from hazards such as hazard and land cover mapping and vulnerability assessment;
– Produce early warnings to minimize loss of life and damage;
– Monitor the hazard in real time;
– Assess the damage produced by the hazard;
– Provide relief, which involves assistance and/or inter-vention during or after hazard.
The emphasis of this study is focused on prominent en-vironmental hazards, namely forest fires or wild fires and floods. These hazards contribute significantly to ecosystem degradation and soil erosion. Forest fires constitute a hazard that causes large damages, especially in arid and semi-arid regions. In many cases, this hazard contributes significantly to changes in the local and even global climate, soil erosion and leads to soil loss and desertification. The destruction of vegetation by forest fires can affect the land surface and the hydrologic cycle, by increasing the surface albedo, surface runoff, and decreasing the evapotraspiration (Matson et al., 1987). Moreover, the biomass burning can contribute, with gases, to the greenhouse effect and cause destruction of the ozone layer.
116 C. Domenikiotis et al.: Use of NOAA/AVHRR satellite data sometimes, cultivated fields. More than two thousand
for-est fires are annually recorded in Greece, which correspond to an average total burned area of 500 km2. Although the vast majority of fires are small-scale fires, a small number of them, which is considered large-scale fires, burn extensive ar-eas. In the USA, large-scale forest fires are considered those fires, which burn more than 4 km2(Pyne, 1984). In Greece, large-scale forest fires are considered those fires, which burn more than 1 km2(Kailidis, 1990). These large-scale forest fires represent only a 5.4% of the annual number of fires, but the burned area reaches 72% of the annually burned areas.
Other extreme meteorological phenomena are heavy storms, which result in flooding of major areas. Recently, dramatic flooding has occurred in several regions of the world for example, Mississippi River (USA, 1993), Piemonte (Italy, 1994), Rine and Meuse (Netherlands, Belgium and Germany, 1995), Biescas (Spain, 1996) and Oder (Czech Re-public, Poland, and Germany, 1997). In Greece, heavy rain-storms during fall and winter months have been considered as major hazards causing flooding and subsequent significant damage to the agricultural production as well as to urban ar-eas. The overall view of the phenomenon and mapping of the flooded areas are very important aspects in dealing with emergency situations and the quantitative estimation of the inundated area. The monitoring of the flood can minimize the loss of life and property, and the assessment of the affected areas can provide valuable information to the authorities and insurance companies. New technologies offer possibilities for assessing the hazards potential. Specifically, the possi-ble contribution of remotely sensed data could be focused on relief and, possibly, preparedness or warning (Williams, 1994; Foot, 1994), although in many cases remote sensing can make a valuable contribution to disaster monitoring when frequency of observation is not such a prohibitive limitation. The scope of this paper is to present monitoring and hazard assessment remote sensing techniques for case studies of est fires and floods occurred in Greece. It deals with the for-est fire of 21–24 July 1995 in Penteli Mountain near Athens, and the forest fire of 16 September 1994 in Pelion Moun-tain, Central Greece. The techniques applied for monitor-ing and mappmonitor-ing the affected areas is based on the estimated Normalized Difference Vegetation Index (NDVI) and surface temperature (ST) derived from the National Oceanic and At-mospheric Administration’s Advanced Very High Resolution Radiometer (NOAA/AVHRR) satellite data. The third case study is the flooding event of 17–23 October 1994 in central Thessaly, Central Greece. This work attempts to accentuate the importance of the NDVI and ST in monitoring and delin-eation of burned and flooded areas.
The presentation of the paper has been organized as fol-lows. Firstly, the methods used, in the international lit-erature, to tackle the monitoring and assessment of for-est fires and floods are presented with special reference to the NOAA/AVHRR data. Next, a brief presentation of the US National Oceanic and Atmospheric Administrations (NOAA) satellites and their Advanced Very High Resolution Radiometer (AVHRR) is presented, followed by the
presen-tation of the satellite indices and the techniques used in this study. Finally, the application of the NOAA/AVHRR indices in the three case studies of forest fire and flooding monitoring and assessment precedes the conclusions.
2 Remotely-sensed monitoring and assessment of forest fires and floods with remote sensing
Several types of satellite systems present a wide range of new capabilities, which can be used to assess and monitor the effect of environmental hazards or even to avoid them al-together. A major consideration for development of remote sensing for hazard assessment and disaster reduction is the extent to which operational users can rely on a continued sup-ply of data. Meteorological satellites are used in operational programs of hazards, since they continually provide data. Besides weather forecasting, meteorological satellites have found application in several important hazard applications mainly due to the high frequency of coverage and moder-ate resolution. The meteorological smoder-atellite NOAA/AVHRR can contribute to operational monitoring and assessment of natural hazards (San Miguel-Ayanz et al., 2000; Dalezios, 1995).
Large-scale forest fires expand with a high propagation velocity (2.5 km/h) and usually evolve to canopy fires. In Greece, large-scale fires are closely related and influenced by the prevailing strong winds. The atmospheric environment and local meteorological conditions are therefore very signif-icant for the fire initiation and spread, as well as in fire risk assessment (Spanos et al., 1996). Nevertheless, in complex terrain areas, where meteorological parameters are extremely variable, meteorological conditions derived from neighbor-ing stations are usually not representative of fire conditions. In contrary, satellite sensors provide a spatially continuous set of data from which meteorological parameters can be ex-tracted in high temporal resolution.
Remotely sensed data and techniques have been used to detect active fires and extract the extent of the burned area during the fire (Domenikiotis et al., 2002). The methods usually applied are based on the thermal signal generated by flaming and/or smouldering combustion (Matson et al., 1987; Kennedy et al., 1994; Flasse and Ceccato, 1996; Justice et al., 1996) and the daily fire growth (Chuvieco and Martin, 1994). The use of contextual algorithms (Eva and Flasse, 1996) can improve the detection of active fires.
C. Domenikiotis et al.: Use of NOAA/AVHRR satellite data 117
Table 1. AVHRR characteristics
Channels Wavelength (µm) IFOV (km) 1 0.55–0.9 Visible (VIS) 1.1 2 0.725–1.0 Near Infrared (NIR) 1.1 3 3.55–3.93 Middle Infrared (MIR) 1.1 4 10.3–11.3 Thermal Infrared (TIR) 1.1 5 11.5–12.5 Thermal Infrared (TIR) 1.1
fire (Kasischke et al., 1993; Kasischke and French, 1995; Domenikiotis et al., 2002) or using maximum value com-posites from NDVI (Fern´andez et al., 1997). Algorithms have been developed for monitoring the burned areas com-bining NDVI (Pozo et al., 1997) or the Global Environment Monitoring Index (GEMI) (Barbosa et al., 1999) with multi-temporal brightness temperature differences. Remote sens-ing is a useful tool for providsens-ing information before, dur-ing and after the forest fires and floods. The contribution of remote sensing to the prediction of a sensitive area can be achieved through the estimation of parameters used to the fire risk assessment models.
Space technology with appropriate ground support sys-tems such as disaster warning system, data collection plat-form, emergency terminals, etc., is being widely used to pro-vide valuable information and services towards flood fore-cast, relief and management measures. In spite of limita-tions of cloud coverage and long periods between the satel-lite passages, satelsatel-lites provide crucial information for pre-cipitation forecast, flood monitoring and warning, inundation mapping and damage assessment, and flood plain manage-ment (Jayaraman et al., 1997). The NOAA/AVHRR satellite data have been used for quantitative estimation of precipita-tion and river stages for remote areas along with ground data collection and relay stations (Rao, 1996). Multi-temporal NOAA/AVHRR data are used for dynamic flood monitoring (Zhou et al., 2000; Sheng et al., 2001). These data were used to extract information on the variation of flooding du-ration, extend and depth. Satellite data give information on the flooded area and duration. These data can, then, be used to estimate the flood volume and depth using detailed Digital Elevation Models (DEM) within the framework of a Geo-graphical Information System (GIS) (San Miguel-Ayanz et al., 2000). Furthermore, satellite data were used to drive and calibrate hydrological and hydraulic models in order to as-sess the flood flow features (Bates et al., 1997). Application of a GIS-integrated physically based hydrologic model was used to map the flooded risk zones during the 1993 and 1995 Meuse River and 1997 Oder River flood events with relative success (San Miguel-Ayanz et al., 2000). In these applica-tions, the satellite data were used to assess the land cover, which is a major input to the hydrologic model, and to map the flooded area for model validation.
The mapping and the damage assessment of flood-affected areas is one of the most successful applications of satellite
remote sensing in flood management. Because of the clear difference in the spectral signatures, it is quite possible to map areas under standing water, areas from where the flood water had receded, submerged standing crop areas, etc. Suc-cessful applications of NOAA/AVHRR data for flooded area mapping and damage assessment have been reported in the international literature (Zhou et al., 2000; Sheng et al., 2001). Besides the need for monitoring during a flood event and performing post-flooding damage assessment, the flood pre-vention and the management of flood plain management is a major issue. In this sense, multi-seasonal NOAA/AVHRR mosaicked images of vegetation indices have been used to identify and classify vegetation dynamics in flooded and neighboring non-flooded areas, and thus delineate the flood plain in the Yellow River basin (Hasegawa et al., 1998) and Lake Chad basin (Birkett, 2000). In another application multi-temporal NDVI from Landsat Thematic Mapper data along with other satellite indices were used to model the floodplain inundation area within an integrated GIS and re-mote sensing platform (Townsend and Walsh, 1998). The potential inundation surfaces were derived from regression models that related US Federal Emergency Management Agency (FEMA) flood elevations to river position and loca-tion.
3 The National Oceanic and Atmospheric Administra-tion (NOAA) meteorological satellite
The ground resolution of the remotely sensed data ranges from 1m to more than 1 km. The choice of the appropri-ate resolution depends on the information desired. High-resolution images provide more information of the study area, but result into a large amount of data. On the other hand, meteorological satellites provide low resolution data, but higher temporal resolution, appropriate for monitoring and operational requirements in forest fires and floods.
118 C. Domenikiotis et al.: Use of NOAA/AVHRR satellite data that data for many regions of the Earth are no more than six
hours old, so appropriate for near real time hazard forecast-ing, monitoring and damage assessment.
The NOAA satellite series bear on board a suit of instru-ments able to measure many parameters of the Earth’s sur-face and atmosphere. The primary instrument, carried by the satellites, is the Advanced Very High Resolution Radiome-ter (AVHRR). The AVHRR is a multi-spectral scanner with medium spatial resolution. The swath is 3000×6000 km, which produces overlaps of the same area and the daily cov-erage of the whole earth. The AVHRR sensor characteristics are shown in Table 1. Data from all the NOAA satellites are transmitted to the ground via a broadcast called High Resolu-tion Picture Transmission (HRPT). Two of the most promi-nent parameters for the study of forest fires and floods are the condition of the vegetation and the surface temperature. These parameters are not extracted directly by the brightness values, as recorded by the NOAA/AVHRR sensors. In order to convert the pixel values to useful quantities, application of mathematical functions is required. In remote sensing, the formation of indices is a common practice in order to “high-light” significant ground features. The indices are, usually, application oriented and take advantage of the ground char-acteristics, as they appear in the recorded image. Two of most eminent indices related to environmental studies and, especially, to forest fires and floods are the Normalized Dif-ference Vegetation Index (NDVI) and Surface Temperature (ST).
3.1 The Normalized Difference Vegetation Index (NDVI) The spectral reflectance characteristics of the land cover in-dicate a degree of separation between the feature types. The measure of the spectral response permits the assessment of type of the feature as well its condition. Specifically, chloro-phyll absorbs the radiation at 0.62 to 0.7µm and reflects it in near infrared 0.74 to 1.1µm. By observing directly the plants’ radiometric response, it is possible to record the canopy reactions to environmental stresses and constraints directly and in real time. Thus, a mathematical function of the visible and infrared parts of the electromagnetic spec-trum can be an indictor of the presence and condition of the vegetation. This leads us to the concept of Normalized Dif-ference Vegetation Index (NDVI), which is an indication of the amount of green vegetation.
The NDVI is obtained by combining the Channels 1 and 2, visible and near infrared, respectively. The index is given by the equation
NDVI= Ch2−Ch1
Ch2+CH1
, (1)
whereCh1andCh2are the radiances of the first two chan-nels of NOAA/AVHRR.
Vegetation index changes in time are correlated with the Canopy Leaf Area Index (LAI). In Table 2, a classification of reflecting surfaces based on NDVI and pixel values in the gray scale (0–255) is presented. After a fire or flood,
sig-Table 2. Vegetation classification according to typical NDV1 values
Soil type NDVI Pixel value (0–255 gray scale) Dense vegetation 0.500 210 Intermediate green vegetation 0.140 118 Sparse vegetation 0.090 105
Bare soil 0.025 88
Clouds 0.002 83
Snow and ice −0.046 70 Water surface −0.257 16
nificant reduction in LAI of the forest or field is expected and values corresponding to complete lack of chlorophyll el-ements are sometimes expected. A vegetation index is, there-fore, representative of plants’ photosynthetic efficiency, and it is time varying due to changes in meteorological and envi-ronmental parameters. The NDVI values range from−1 to +1 (pixel values 0–255).
The delineation of burned and flooded areas depends on the type of burned vegetation, the soil type, the time inter-val after the fire or flood and the extent of the affected area (totally or partially burned). After the cease of a fire or the passage of a flood wave, significant reduction of the vege-tation is expected and the values corresponding to complete lack of chlorophyll elements are an indication of the burned of flooded area. For these reasons vegetation indices are an acceptable technique for identifying vegetation changes and thus, for the assessment and mapping of the affected areas. Among other vegetation indices, the NDVI is the least af-fected by the topography and the difference between NDVI values gives the best indication of vegetation change (Lyon et al., 1998). Thus, the NDVI is a quick and efficient way for forest fire and flood monitoring and assessment of affected areas (Dalezios et al., 1998).
3.2 Surface Temperature (ST)
C. Domenikiotis et al.: Use of NOAA/AVHRR satellite data 119
Table 3. Summary of split-window algorithms for the estima-tion of the surface temperature (Ts, T4, T5, σ ε◦KKαι, T0 =
273.15◦K, ε=(ε4+ε5)/(2))
Algorithms References
( )
[4 4 5] 4 0.755(4 5)
5 . 4 5 . 5 33 .
3 − −ε+ ε −ε +
=T T T T
Ts
Price (1984)
( ) 51.57 52.45ε 00
.
3 4 5
4+ − + −
=T T T
Ts Ulivieri et al. (1985)
2 2 274 .
1 AT4 T5 BT4 T5
Ts − + + + = where . 33 . 38 1 98 . 3 26 . 6 , 482 . 0 1 15616 . 0 1 25 4 25 4 εε ε εε εε ε εε − + − + = − − − + = B A
Becker and Li (1990b)
0 4 4 5 0 5 4 0
4 2.45 401
45 .
3 T T T T T
Ts= − − − + −ε + ε ε ε
Prata and Platt (1991)
( − )+Β +
=T4 AT4 T5
Ts where
A=0.349W + 1.320 + (1.385W – 0.204) (1 – ε4) + (1.506W –
10.532) (ε4– ε5)
Β=(1 – ε4) / ε4 T4 [- 0.146W + 0.561 + (0.575W – 1.966) (ε4 –
ε5)](1 – ε5)/ε5Τ5 [- 0.095W + 0.320 + (0.597W – 1.916) (ε4 –
ε5)]
Sobrino et al. (1991)
( ) 0.5265(sec 1)( ) 4.58 657
. 2 0162 .
1 4+ 4− 5+ − 4− 5−
= T T T T T
Ts θ NESDIS (Mayet et al.,1992)
( ) ( ) ( 4) (4 5)
2 5 4 5 4
4+1.06 − +0.46 − +531−ε −53ε −ε
=T T T T T
Ts Sobrino et al. (1993)
(4 5) ( ) (4 5)
4+1.8 − +481−ε −75ε −ε
=T T T
Ts Ulivieri et al. (1994)
( n) SG SV
n
s NDVI T NDVI T
T= * +1− * where
)] /(
)
[( soil veg soil
n NDVI NDVI NDVI NDVI
NDVI = − −
vegetated fully ground TSV=
ground ered un TSG= cov
Gupta et al. (1997)
For the calculation of the surface temperature the knowl-edge of the surface emissivity is required. Surface emissiv-ity is a measure of the inherent efficiency of the surface in converting heat energy into radiant energy above the surface. According to Sobrino et al. (2001) this subject has not been studied extensively. The ST emissivities can be estimated by five different types of methods (Ker´enyi and Putsay, 2000): (a) average-variance statistical relationship of emissivity, (b) space measurements (e.g. TISI algorithms), (c) in-situ or lab-oratory measurements, (d) the use of NDVI data, and (e) the inverse technique. One of the main factors determining the variation of the active surface temperature is the state of the vegetation cover. It can be well characterized by the NDVI (Csisz´ar and Ker´enyi, 1995). The statistical relationship be-tween logarithm of NDVI and the surface emissivity can be given by (Sobrino et al., 1991):
ε8−14=1.0094−0.047∗1n(NDVI), (2) where,ε4=ε8−14−0.03 andε5=ε8−14+0.01.
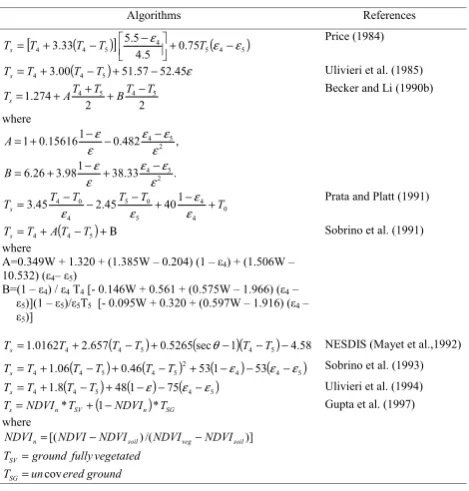
After the emissivity is estimated a surface temperature al-gorithm can be applied. Table 3 gives some of the most com-mon algorithms for the calculation of the ST. These methods are mainly based on the combination of the infrared chan-nels. Among them is the TISI algorithm (Becker and Li, 1990a; Becker and Li, 1990b) based on the thermal infared radiances, and the method, which estimates the emmissivity value from NDVI (Van de Gried and Owe, 1993). These two categories have been validated with in-situ measurements (Ker´enyi and Putsay, 2000). A process for the estimation of sea surface temperature SST is based on an algorithm utilized by the NOAA/AVHRR Receiving and processing system of
BURL (Bradford University Research Limited) (B.U.R.L., 1993). According to this algorithm scaling is set so that 10◦C
equates to pixel value 50 and the increment is 0.1◦per value:
SST(◦C)=10+p−50
10 , (3)
wherep is the pixel value. With this standard tool, the sea surface temperature (SST) from 1◦to 30◦C is estimated.
Study over an extensively wheat growing track during different growing phenological stages (Gupta et al., 1997) and slope of the morning temperature (Csisz´ar and Ker´enyi, 1995) indicated a correlation between the ST and the NDVI. Sobrino and his associates (Sobrino et al., 2001) developed a NDVI based algorithm for the estimation of ST and showed that this method shows promising results. As the ST is strongly correlated to the land cover (as expressed by the NDVI) can play a semantic role to the operational study of forest fires and floods. The ST algorithms can contribute to the forecasting, monitoring and damage assessment of natu-ral hazards. However, more research is required towards this application field.
4 Case studies
Two cases of the monitoring of the forest fire development and the mapping of the burned area are studied and presented in this paper. Firstly, the forest fire in the Penteli Mountain which lasted from 17 to 24 July 1995 and secondly, the forest fire in the Pelion Mountain occurred on 16 September 1994 are presented. Furthermore, the estimation of the flooded area in central Thessaly during the widespread storm event of 17–23 October 1994 using the NDVI and SST index is presented.
4.1 Forest fire of Penteli Mountain, Athens, Greece (21–24 July 1995)
The study area comprises part of the Penteli Mountain, lo-cated northeast of Athens, Greece (Fig. 1, area A). A for-est fire, during 21–24 July 1995, dfor-estroyed a forfor-ested area of about 63 km2. The dataset used for this study is a series of daily NOAA/AVHRR images acquired before, during and after the forest fire and two Landsat TM images acquired be-fore (13 June 1995) and after (27 July 1995) the event. The Landsat TM images were selected because their high reso-lution was regarded adequate for optical delineation of the burned area.
120 C. Domenikiotis et al.: Use of NOAA/AVHRR satellite data
ATHENS
GREECE
Thessaly
A B C
Fig. 1. The study areas for forest fires are located in (a) Penteli, Attiki and (b) mount Pelion, Greece.
(a) (b)
Figure 2. NDVI images formed by NOAA/AVHRR data before (a) and after (b) the forest fire in Penteli Greece.
Fig. 2. NDVI images formed by NOAA/AVHRR data before (a) and after (b) the forest fire in Penteli, Greece.
extent is necessary for the initial assessment of burned areas in near-real time. So, satellite data before and after the initi-ation of this small-scale fire were examined.
The NDVI values were derived from the NOAA/AVHRR images. Figures 2a and 2b show the NDVI images of NOAA/AVHRR. The first image was obtained the day be-fore the initiation of the be-forest fire and the second the day after the extinction of the fire. The bright areas in the first image indicate the presence of vegetation and the gray areas correspond to the suburban area of Athens and the sea. In Fig. 2b the light gray pixels indicate the burned areas.
The accuracy assessment of the NOAA/AVHRR NDVI images requires the use of a reference map defining the burned and non-burned areas. Additionally, a method for
detecting the burned areas by means of NDVI requires the use of multi-temporal images. The methodology followed involves the selection of a colour composite to assist the vi-sual interpretation, discrimination of the burned areas and the accuracy assessment of the retrieved results.
ap-C. Domenikiotis et al.: Use of NOAA/AVHRR satellite data 121
Figure 3. The polygons delineate the burned area derived by optical interpretation and digitization of the colour composite Landsat TM image after the forest fire. The clouds were also digitized along with their shadows. This layer
Fig. 3. The polygons delineate the burned area derived by optical
interpretation and digitization of the colour composite Landsat TM image after the forest fire. The clouds were also digitized along with their shadows. This layer was used as a base map, indicating the burned area.
plied in order to obtain an indication of the accuracy of the results. Koutsias and Karteris (1998) have shown that the colour composite of TM7, TM4 and TM1 displayed in red, green and blue, respectively, allows better visual interpreta-tion of the Landsat TM images. This false colour composite image can enhance the visual discrimination between burned land and other land use/cover categories.
The Geographic Information Systems (GIS) allow the cod-ing, storcod-ing, analyzing and retrieving the geographic data. GIS provides a range of analytical capabilities, which are able to combine spatial and non-spatial attributes. These ca-pabilities of synthesis allow the user to work interactively or not in order to perform the required analysis. In order to de-lineate the burned area, the digitization method is selected, because it allows the recognition of the areas, which are dis-tinctly identified by the user on the colour composite image. The colour composite Landsat TM image is used to create polygon representation of the burned area. In places where the distinction is not clear, the colour composite image be-fore the fire assisted the interpretation by direct visual com-parison of the area in order to identify any possible changes. Figure 3 shows the burned area and clouds derived from the visual interpretation. The resulted area is 63.236 km2, which is regarded as a good approximation to the true value.
The relationship of data file values in two bands of a multi-spectral NOAA/AVHRR NDVI image can be expressed with the scatter plot. In a scatter plot, the values of one band are plotted against those of the other. If the values are equal, then the pixel values will be plotted along the diagonal axis. When both bands have normal distribution then the result is an el-lipse. Any change in the brightness values between the two bands would result into a “grouping” of pixel values away from the diagonal axis.
Creating the scatter plot of the NDVI image before the forest fire against the NDVI image after the fire, the pixels
moved away from the diagonal axis can be detected. In or-der to distinguish the burned area from the unburned area, a threshold selection criterion is established. Figure 4a shows the scatter plot of the NDVI before and after the fire for the Landsat TM data. In this Fig. 4, thex-axis corresponds to the data after the fire and they-axis to the data before the fire. The scatter plot indicates that there are two clusters of pixels. The area A, along thex−yline, corresponds to the pixels whose values have not changed during the days. On the other hand, the area B indicates that pixels with high val-ues, during the pre-fire period, are reduced in the after the fire image. Area B is actually the cluster of pixels, which correspond to the burned area.
Using a two-dimensional threshold these pixels can be iso-lated. Pixel values of NDVI images are recoded to new val-ues. The values of the first layer below the threshold, are as-signed with the value “1”, and the rest with the value “0”. As a result, two binary images are created for the Landsat TM; one for the NDVI image before the forest fire (Fig. 4b), and the second for the NDVI image after the forest fire (Fig. 4c). Each of these themes contains different information about the NDVI values. The goal of this process is to create a layer that shows only the pixels that correspond to the area B, and indicate the changes through time. The extracted map of the burned/unburned areas has to result from the combination of the extracted binary images of the two pairs of binary images for NOAA/AVHRR.
Applying the Boolean logic the attributes of the layers can be combined to provide the common area. The operator used, from Boolean algebra, is the AND. As a result, if the pixels for both maps have the attribute “1” for the burned area then the result will be a pixel with attribute “1”. The other pos-sible combinations imply the value “0”. The final map in-dicates the common areas corresponding to the burned areas assigned with the value “1” and non burned areas assigned with the value “0”. This binary image shows the pixels with high values in the first NDVI image and low in the second. The layer of clouds is subtracted resulting into Fig. 4d. The same procedure is repeated for the two NDVI images derived from the NOAA/AVHRR.
The methods usually developed for mapping the burned areas are based either on the thermal signal or the use of an index or an algorithm utilizing both (thermal and index) in-formation. When a technique is applied for operational pur-poses, the accuracy of the derived map needs to be known, in order to increase the credibility of the extracted results. It is thus appropriate not only to have on hand a quick and efficient method, but also to reach an acceptable degree of accuracy, which can be achieved by this method, thus indi-cating its usefulness as well as of the sensor from which the data are obtained.
122 C. Domenikiotis et al.: Use of NOAA/AVHRR satellite data
B A
(a)
(b)
(c)
(d)
Fig. 4. (a) scatterplot of the NOAA/AVHRR NDVI image after (x-axis) and before (y-axis) the forest fire. The two binary images (b) and
(c) resulted from the threshold of the two NDVI images. The image (d) corresponds to the overlay of (b) and (c) after the clouds have been
removed.
Table 4. Confusion matrix comparing the reference map with the extracted burned area from NOAA/AVHRR data
Burned area Non-burned area number of pixels % agreement Estimated burned area 49947 8139 58086 85.99% Estimated non-burned area 18160 104605 122765 85.21%
Total 68107 112744 180851 85.46%
Fig. 5. Comparison between the burned area, as identified by the
NDVI images, before and after the forest fire, and the reference map, for NOAA/AVHRR data sets.
black polygons correspond to burned areas, which are not identified by the method. The blue small polygons are the ar-eas labeled as burned by the method, but they are actually not burned. The white polygons indicate the non-burned areas and areas covered by clouds. The quantitative estimation of this map is given in Table 4. Domenikiotis and his associates (Domenikiotis et al., 2002) compared the accuracy of both NOAA/AVHRR and Landsat TM data sets and showed that the overall accuracy of both sensors is similar (Table 4 and Table 5), although Landsat TM identifies more accurately de-tails of the burned area.
The monitoring of the forest fire was achieved by
us-ing images derived from the NOAA/AVHRR data. Satel-lite data were examined during the large-scale fire in Penteli Mountain. The estimation of the burning areas was based on the combination of the three infrared channels 3, 4 and 5 of NOAA/AVHRR (Table 1). The process applied for this case study was based on the algorithm utilized by the NOAA/AVHRR Receiving and Processing System of BURL (Bradford University Research Limited) (B.U.R.L., 1993). According to this algorithm, an image is derived from Chan-nels 3, 4 and 5 using Channel 4 to act as the general tempera-ture scaled background, Channel 3 for hot spot detection and Channel 5 is used to detect clouds. A threshold value can be declared to the algorithm (e.g. 49◦C), of the image process-ing system, and an image with hot spots, above the threshold, will be presented. The images in Figs. 6a–d are extracted based on this process. These figures show a series of im-ages taken in the morning of 21 July 1995, the evening of the same day, 22 and 25 July 1995, respectively. The dark pixels within the rectangle show the area where the surface temper-ature is greater than 49◦C for Figs. 6a to c. The threshold of 46◦C was used for the Fig. 6d image since the temperature was dropped after the fire. The temperature images identified the burned area, in Penteli forest. The total burned area was also estimated to be 63 pixels (63 km2).
4.2 Forest fire of Pelion Mountain, Central Greece (16 September 1994)
C. Domenikiotis et al.: Use of NOAA/AVHRR satellite data 123
(a)
(a) NOAA morning image of 21/7/95 with
surface temperature > 49
0
C. The burned
area covers 6 km
2
(b)
(b) NOAA night image of 21/7/95 with
surface temperature > 49
0
C. The burned area
covers 22 km
2
(c)
(c) NOAA image of 22/7/95 with
surface temperature > 49
0
C. The burned
area covers 46 km
2
(d)
(d) NOAA image of 25/7/95 with surface
temperature > 46
0
C. The burned area covers
63 km
2
Fig. 6. (a) NOAA morning image of 21 July 1995 with surface temperature>49◦C. The burned area covers 6 km2. (b) NOAA night image of 21 July 1995 with surface temperature>49◦C. The burned area covers 22 km2. (c) NOAA image of 22 July 1995 with surface temperature
124 C. Domenikiotis et al.: Use of NOAA/AVHRR satellite data
36
(a) (b)
Figure 7: Magnified window of NDVI differences image (a) showing the Katihori area. NDVI Pixel values before and after the fire are indicated. Dotted areas at A3 and A4 boxes (b) represent the villages Katihori and Portaria.
Fig. 7. Magnified window of NDVI differences image (a) showing the Katihori area. NDVI Pixel values before and after the fire are
indicated. Dotted areas at A3 and A4 boxes (b) represent the villages Katihori and Portaria.
Table 5. Confusion matrix comparing the reference map with the extracted burned area from Landsat TM data
Burned area Non-burned area number of pixels % agreement Estimated burned area 47392 1324 48716 97.28% Estimated non-burned area 20715 111420 132135 84.32%
Total 68107 112744 180851 87.82%
September 1994. After the initiation of the forest fire in the morning of that day and until the sunset the fire spread was mainly restricted along the stream and the propagation direc-tion was upslope (Fig. 7b). After the sunset as the mountain breeze was developing the fire intensified and spread across the stream outside the stream banks. During the fire evolu-tion intensificaevolu-tion occurred after the increase of wind speed and vise versa. In total, the fire burned more than 15 000 olive trees, about 0.02 km2of apple trees were ruined and a small number of animals was killed. Power supply network also suffered considerable damages. The total burned area was estimated by ground surveying from the Greek Forestry Department (personal communication) to 4.25 km2.
Data from NOAA12 polar orbiting satellite were used for the calculation of NDVI for two days (14 and 23 September 1994) before and after the forest fire. The satellite trajec-tories for the two days differ by no more than 40 min/◦. A change detection technique, based on NDVI index derived from NOAA/AVHRR satellite data, is applied in the detec-tion and monitoring of the burned area. Hence, a third im-age was produced by subtracting NDVI pixel values of the first image from the respective NDVI pixel values of the second image (e.g. 109–80 in the two most brighter pix-els of Fig. 7a). A 7×8 pixel window of this image is
pre-sented in Fig. 7a in which NDVI differences are displayed in a 16 gray-scale palette. The sea water of the gulf generally showed pixel values of less than 90 in both cases (down left side). In the forest areas on mount Pelion values between 88 and 200 were observed. Within this scale negative dif-ferences (dark areas) represent NDVI increase and positive differences (light areas) NDVI decrease. Gray areas espe-cially in the upper left represent densely forested areas with increasing tendency. Light areas in Fig. 7a are expected to represent fire-affected places.
C. Domenikiotis et al.: Use of NOAA/AVHRR satellite data 125
(a) max NDVI image from the first ten days of Oct. 1994
(b) NDVI image of 26 Oct 1994 showing the flooded area
Fig. 8. Comparison between two NDVI images, before and after the flood in Thessaly, Greece. The first image shows the maximum NDVI
image from the first ten days of October 1994, which will eventually be flooded. The flooded area can be seen, within the triangle, in the second image which is the NDVI image of 26 October 1994.
to their NDVI change. For example, in pixel A3 the change in NDVI value before and after the fire is 102–93 = 9, and the burned area was estimated as 9/29×(1.1×1.1)=0.38 km2. Similarly, the burned area in pixels B1 and C4 was esti-mated equal to 0.42 km2 and 0.88 km2, respectively. The total burned area was estimated to about 4.1 km2, 2.42 km2 for the two totally fire-affected pixels and 1.68 km2for the three partially fire-affected pixels. This figure of the totally burned area agrees well with the estimation made by the Greek Forestry Department (4.25 km2).
Moreover, meteorological data were taken from three au-tomatic stations namely, Volos, Velestino and Zagora in the vicinity of the fire. Using the meteorological data from these stations common indices were calculated for the assessment of the fire risk. The variation of temperature and relative humidity among the data from the three stations were not significant at the initiation of the forest fire (11:00 UT of 16 September 1994). However, the wind speed was quite differ-ent in the three stations. The wind speed in Volos was more favorable for fire initiation than in the other two stations.
The Angstrom’s fire index for Volos Velestino and Zagora meteorological stations was estimated to be 1.4, 1.5 and 2.3, respectively. Based on previous experience, the Angstrom index values suggest very favorable fire conditions for Volos and Velestino and favorable conditions for Zagora. Based on this method the estimated burned area, 3 km2, was consider-ably lower than the actually burned area.
The investigation of meteorological and satellite parame-ters during a forest fire in central Greece highlights the im-portance of local meteorological conditions in the fire risk assessment. Air temperature and relative humidity are impor-tant components of fire risk indices, but in order to improve performance wind speed and slope should be also incorpo-rated. Positive indications were found for the detection and monitoring of burned area through NOAA satellites. NDVI
abrupt changes before and after the fire were observed for the burned areas. The magnitude of such changes depends on the amount of burned area per pixel, the vegetation density and the dominating species.
4.3 Flooding of central Thessaly, Central Greece (17–23 October 1994)
One case study dealing with the assessment of the flooded area is presented in this paper. The flood event of 17–23 October 1994 occurred in central Thessaly, Central Greece is analyzed herein. This flood event occurred in the central area of Thessaly (Fig. 1, area C). This particular area is lo-cated in the confluence of the seven major tributaries of Pin-ios River, namely, Enipeas River, Farsaliotis River, Sofadi-tis River, KalenSofadi-tis River, Pamisos River, Portaikos River and Lithaios River and suffers frequent and severe flooding, espe-cially during widespread storm events. The tributaries drain the western and southern mountainous regions of Thessaly.
126 C. Domenikiotis et al.: Use of NOAA/AVHRR satellite data
Flooded area
26 km
2Fig. 9. Sea Surface Temperature image from the flooded area (26 October 1994) along with the rivers in Thessaly.
The assessment of the areal extent of the flooded area in the region of Thessaly has been accomplished by the use of NOAA/AVHRR NDVI. Firstly, daily NDVI image series was estimated for October 1994. Then, the Maximum Value Composites (MVC) images were produced from the maxi-mum NDVI image series for the first ten days of October 1994. The advantage of using the MVC images is that the emissivity remains nearly constant within ten days, the cloud contamination effects are reduced and the effects caused by the angular viewing of the sensor are reduced (Dech et al., 1998). The MVC image of the first ten days of October 1994 is an indication of the green vegetation as it was before the storm. Figure 8a shows the MVC image for the first ten days of October 1994 in grayscale. The dark areas indicate low vegetation and as the pixel values become brighter, the vege-tation increases. Figure 8b is the NDVI image of 26 October 1994, which was the first day after the storm with clear sky. Based on the same grayscale the flooded area can be delin-eated. The dark gray area within the triangular frame indi-cates the flooded area. The pixel values of the dark area have the lowest values of NDVI, which indicates the presence of water and the destruction of vegetation in the inundated area. The flooded area is estimated to be 26 km2, which, agrees well with the ground surveying, and areal photographs esti-mation.
The flooded area was estimated by using the SST index. The SST was estimated as previously using Eq. (3). Further-more, the SST was empirically determined with known water surfaces (e.g. sea). So, the low pixel values of the SST im-age, due to the presence of water, compared to the surround-ing areas (mainly covered by vegetation) has been proven to
be a good indication of the flooded area. Figure 9 shows the Sea Surface Temperature (SST) image of 26 October 1994. This image was created from images taken the first day after the storm with clear sky (26 October 1994). This inundated area was estimated to be 26 km2, which agrees almost per-fectly to the estimated affected area by ground surveying and areal inspection and the NDVI results.
5 Conclusions
The increase in the natural disasters comes along with the rapid growth in the earth observation satellites. The range of new capabilities provided by the remotely sensed data can significantly contribute to early warning, monitoring and damage assessment and mitigation of affects of disasters.
In this work, the use of satellite remote sensing in the assessment and monitoring of forest fires and floods has been presented. The meteorological satellite system NOAA/AVHRR is explored towards meeting operational monitoring requirements. The emphasis has been placed on two hazards, namely forest fires and floods.
C. Domenikiotis et al.: Use of NOAA/AVHRR satellite data 127 Acknowledgements. The NOAA/AVHRR images were obtained
from the NOAA/AVHRR receiving and processing system at the Laboratory of Agrometeorology, University of Thessaly covering the whole Greece. The Laboratory of Forest Management and Re-mote Sensing, Department of Forestry and Natural Environment, Aristotelian University of Thessaloniki provided the Landsat TM images.
References
Barbosa, P. M., Gr´egoire, J.-M., and Pereira, J. M. C.: An algorithm for extracting burned areas from time series of AVHRR-GAC data applied at a continental scale, Remote. Sens. Environ., 69, 253–263, 1999.
Bates, P. D., Horritt, M. S., Smith, C. N., and Mason, D.: Integrating remote sensing observations of flood hydrology and hydraulic modelling, Hydrol. Process., 11, 1777–1795, 1997.
Becker, F. and Li, Z. L.: Temperature independent spectral in-dices in thermal infrared band, Remote Sens. Environ, 32, 17–33, 1990a.
Becker, F. and Li, Z. L.: Towards a local split window method over land surface. Int. J. Remote Sens., 3, 369–393, 1990b.
Birkett, C. M.: Synergistic remote sensing of Lake Chad: Variabil-ity of basin inundation, Remote Sens. Environ., 72, 218–236, 2000.
B. U. R. L.: NOAA/AVHRR, Receiving and processing system, Re-port BURL V.3., Bradford University Research Ltd., UK, 1993. Chuvieco, E. and Martin, M. P.: A simple method for fire growth
mapping using AVHRR channel 3 data, Int. J. Remote Sens., 15, 3141–3146, 1994.
Csisz´ar, I. and Ker´enyi, J.: The effect of the vegetation index on the daily variation of the active surface temperature, Adv. Space Res., 16, 117–180, 1995.
Dalezios, N. R.: Remote sensing of agricultural hazards, Proceed-ings Space Congress, Bremen, 23–25 May, 30–34, 1995. Dalezios, N. R., Tsidarakis, L. M., and Zarpas, C. D.: Quantitative
characteristics of the flood of October 1994 in Thessaly, In: Inte-grated Treatments for Flood Danger Reduction, Proceedings 2nd National Symposium, Athens, 12–13 January, 183–191, 1995. Dalezios, N. R., Tzortzios, S., Domenikiotis, C., and Sarakatsanos,
S.: The role of NDVI for the assessment of natural environmen-tal hazards, In: Computer technology in agricultural manage-ment and risk prevention, Proceedings 7th ICCTA-International Congress for Computer Technology in Agriculture, Florence, Italy, 15–18 November, 383–390, 1995.
Dech, S. W., Tungalagsaikhan, P., Preusser, C., and Meisner, R. E.: Operational value-adding to AVHRR data over Europe: meth-ods, results, and prospects, Aerosp. Science Techn., 5, 335–346, 1998.
Domenikiotis, C., Dalezios, N. R., Loukas, A., and Karteris, M.: Agreement assessment of NOAA/AVHRR NDVI with Landsat TM NDVI for mapping burned forested areas, Int. J. Remote Sens. 23, 4235–4246, 2002.
Eva, H. D. and Flasse, S.: Contextual and multiple-threshold algo-rithms for regional active fire detection with AVHRR data, Re-mote Sens. Rev., 14, 333–351, 1996.
Fern´andez, A., Illera, P., and Casanova, J. L.: Automatic mapping of surfaces affected by forest fires in Spain using AVHRR NDVI composite data, Remote Sens. Environ., 60, 153–162, 1997. Foot, J. S.: Hazard warning in meteorology: the importance of
re-mote sensing, In: Proceedings of IDNDR Conference on Natural
Hazards and Remote Sensing, London, UK, 8–9 March 1994, 13–16, 1994.
Flasse, S. and Ceccato, P.: A contextual algorithm for AVHRR fire detection, Int. J. Remote Sens., 17, 419–424, 1996.
Gupta, R. K., Prasad, S., and Viswanadham, T. S.: Estimation of surface temperature over agriculture region, Adv. Space Res., 19, 3, 503–506, 1997.
Hasegawa, I., Mitomi, Y., Nakayama, Y., and Takeuchi, S.: Land cover analysis using multi seasonal NOAA AVHRR mosaicked images for hydrological applications, Adv. Space Res., 22, 677– 680, 1998.
Jayaraman, V., Chandrasekhar, M. G., and Rao, U. R.: Managing the natural disasters from space technology inputs, Acta Astro-nautica, 40, 291–325, 1997.
Justice, C. O., Kendall, J. D., Dowty, P. R., and Scholes, R. J.: Satel-lite remote sensing of fires during the SAFARI campaign using NOAA advanced very high resolution radiometer data, J. Geo-phys. Res., 101 (D19), 23 851–23 863, 1996.
Kailidis, D. S.: Forest fires, Giahoudi Giapouli Publications, Thes-saloniki, 1990.
Kasischke, E. S. and French, N. H. F.: Locating and estimating the areal extent of wildland fires in Alaskan boreal forests using multiple-season AVHRR NDVI composite data, Remote Sens. Environ., 51, 263–265, 1995.
Kasischke, E. S., French, N. H. F., Harrell, P., Christensen, N. L., Ustin, S. L., and Barry, D.: Monitoring of wildfires in boreal forests using large area AVHRR NDVI composite image data, Remote Sens. Environ., 45, 61–71, 1993.
Kennedy, P. J., Belward, A. S., and Gr´egoire, J.-M.: An improved approach to fire monitoring in West Africa using AVHRR data, Int. J. Remote Sens, 15, 2235–2255, 1994.
Ker´enyi, J. and Putsay, M.: Investigation of Land Surface Tem-perature Algorithms Using NOAA/AVHRR Images, Adv. Space Res., 26, 7, 1077–1080, 2000.
Koutsias, N. and Karteris, M.: Logistic regression modelling of multitemporal Thematic Mapper data for burned area mapping, Int. J. Remote Sens, 19, 3499–3514, 1998.
Lyon, J. G., Yuan, D., Lunetta, R. S., and Elvidge, C. D.: A change detection experiment using vegetation indices, Photogr. Engin. Remote Sens., 64, 143–150, 1998.
Matson, M., Stephens, G., and Robinson, J. M.: Fire detection using data from NOAA-N satellites, Int. J. Remote Sens, 8, 961–970, 1987.
May, D. A., Stowe, L. L., Hawkins, J. D., and McClain, E. P.: A corre ction for Saharan dust effects on satellite sea surface tem-perature measurements, J. Geophys. Res., 97 (C3), 3611–619, 1992.
Pozo, D., Olmo, F. J., and Alados-Arboledas, L.: Fire detection and growth monitoring using a multitemporal technique on AVHRR mid-infrared and thermal channels, Remote Sens. of Environ., 60, 111–120, 1997.
Prata, A. J. and Platt, C. M. R.: Land surface temperature measure-ments from the AVHRR, In: Proceedings of 5th AVHRR Data Users Conference, 25–28 June, Tromsø, Norway, EUM P09, 433–438, 1991.
Price, J. C.: Land surface temperature measurements from split window channels of the NOAA 7 advance very high resolution radiometer, J. Geophys. Res, 89, 7231–7237, 1984.
Pyne, S. J.: Introduction to wildlife fire, Fire management in the United States, John Wiley and Sons, New York, 1984.
128 C. Domenikiotis et al.: Use of NOAA/AVHRR satellite data
San Miguel-Ayanz, J., Vogt, J., De Roo, A., and Schmuck, G.: Nat-ural hazards monitoring: Forest fires, droughts, and floods-The example of European pilot projects, Surv. Geophys., 21, 291– 305, 2000.
Sheng, Y., Gong, P., and Xiao, Q.: Quantative dynamic flood moni-toring with NOAA AVRR, Int. J. Remote Sens., 22, 1709–1724, 2001.
Sobrino, J. A. and Caselles, V.: A methodology for obtaining the crop temperature for NOAA-AVHRR data, Int. J. Remote Sens., 12, 2461–2476, 1991.
Sobrino, J. A., Caselles, V., and Coll, C.: Theoretical split win-dow algorithms for determining the actual surface temperature, Il Nuovo Cimento, 16, 3, 219–236, 1993.
Sobrino, J. A., Coll, C., and Caselles, V.: Atmospheric correction for land surface temperature using NOAA-11 AVHRR channels 4 and 5, Remote Sens. Environ., 38, 19–34, 1991.
Sobrino, J. A., Raissouni, N., and Li, Z. L.: A comparative study of land surface emissivity retrieval from NOAA Data, Remote Sens. Environ., 75, 256–266, 2001.
Spanos, S. I., Zarpas, C. D., and Dalezios, N. R.: Meteorological and satellite indices for the assessment of forest fires. In: Pro-ceedings of International Symposium on Applied Agrometeorol-ogy and AgroclimatolAgrometeorol-ogy, 24–26 April, Volos, Greece, 583–588, 1996.
Townsend, P. A. and Walsh, S. J.: Modeling floodplain inundation using an integrated GIS with radar and optical remote sensing, Geomorphology, 21, 295–312, 1998.
Williams, J.B.: Direct reception of satellite data for in-country warning, monitoring and mitigation of natural disasters in the developing world: the LARST approach. Hazard warning in me-teorology: the importance of remote sensing. In: Proceedings of IDNDR conference on Natural Hazards and Remote Sensing, London, UK, 8–9 March 1994, 22–25, 1994.
Ulivieri, C. and Cannizzaro, G.: Land surface temperature retrievals from satellite measurements, Acta Astronautica, 12, 997–985, 1985.
Ulivieri, C., Castronuovo, M. M., Francioni, R., and Cardillo, A.: A split window algorithm for estimating land surface temperature from satellites, Adv. Space Res., 14, 3, 59–65, 1994.
Van De Gried, A. A. and Owe, M.: On the relationship between thermal emissivity and the normalized difference vegetation in-dex for natural surfaces, In. J. Remote Sens., 14, 1119–1137, 1993.