© 2017 IJSRST | Volume 3 | Issue 1 | Print ISSN: 2395-6011 | Online ISSN: 2395-602X Themed Section: Science and Technology
Machine Learning Approaches for Diabetes Risk Factor
Detection
Tejal A. Patil, Swati A. Patil
Computer Science and Engineering, GHRIEM Jalgaon, Maharashtra, India
ABSTRACT
Diabetes is a deficiency in the body’s ability to convert glucose (sugar) to energy. Glucose is the main source of fuel for our body. When food is digested it is changed into fats, protein, or carbohydrates. Foods that affect blood sugars are called carbohydrates. The hypertriglyceridemic waist (HW) is strongly associated with type 2 diabetes Phenotype; however, to date, no study has assessed the predictive power of phenotypes based on individual triglyceride and anthropometric measurements. The aims of the study were to assess the association between the HW phenotype and type 2 diabetes in Korean adults and to evaluate the predictive power of dissimilar phenotypes consisting of combinations of individual anthropometric measurements and Triglyceride levels. Study measured fasting plasma glucose and TG levels and performed anthropometric measurements. We employed binary logistic regression (LR) to examine statistically significant differences between normal subjects and those with type 2 diabetes using Hypertriglyceridemic waist and individual anthropometric measurements. For more reliable prediction results, two machine learning algorithms, naive Bayes and LR, were used to evaluate the predictive power of various phenotypes.
Keywords: Data Mining, Antropometric measurements, Phenotype, type 2 Diabetes.
I.
INTRODUCTION
Type 2 diabetes mellitus (T2DM) is a major disease in humans around the world, a trend that is still on the rise [1][2]. Type 2 diabetes mellitus (T2DM) is a leading cause of mortality and contributes to increased risks of heart disease by 2 to 4 times [1]. A major number of research investigations have been dedicated to it, notably by means of genome wide association study (GWAS) and phenome wide association study (PheWAS) in hope of detecting further associations between genotypes and phenotypes [7][8]. To discover diverse
genotype-phenotype association
affiliated with T2DM via phenome wide association study (PheWAS) and genome-wide association study (GWAS), more cases (subjects with Type 2 Diabetes Mellitus(T2DM)) and controls (subjects without Type 2 Diabetes Mellitus(T2DM))are required to be identified from electronic health records (EHR) [1][2][,5][6].enrich the association studies between phenotypes and genotypes. Given limitations in high missing rate and laborious manual intervention, it increasingly challenging for specialist algorithms to scale to the ever increasing volumes of diabetes related EHR data, derived use and evolved GWAS and PheWAS studies. Machine learning and data mining models are all the time more utilized in diabetes related. Research from EHR data (e.g., diabetes-related adverse drug effect, and association between periodontitis and type 2 diabetes
(T2DM) [2][9]. These studies have primarily focused on mining T2D EHR data for clinical purposes, for case, one such study aimed at forecasting clinical risk of diabetes from EHR [9]. The desire and intended usage of the aforementioned work is different from ours, which aims to classify more cases and controls. Also, the abovementioned study still has similar limitations in high missing rate [6]. To the best of knowledge, very few studies have focused on reducing missing rate to diagnose more cases and controls for phenotyping purposes.
The purpose of this work is to expand a semi-automated framework based on machine learning as a pilot study to identifying subjects with and without type 2 diabetes mellitus (T2DM).Our method features two advancements: 1) high recall 2) low false positive rate; (i.e., detecting as many samples of interest as possible). To achieve these goals, we carefully approach feature engineering by constructing features at three levels. We then train multiple popular machine learning models based on constructed features to discover cases and controls.
Our empirical evaluation is based on three years of EHR data from a large distributed EHR network consisting of multiple Chinese medical centers and hospitals in China Shanghai. Our choice of this EHR repository is motivated by the fact that Chinese EHR data are often much worse than western electronic health records (EHR) in terms of meaningful uses and data quality [8]. In addition, medical care in China often have non-standard unique procedures that are not represented in EHR and expert algorithms from elsewhere, rendering standard or western expert algorithms less relevant. Given all factors, the Chinese electronic health records (EHR) repository provides an ideal test-bed for
evaluating the accuracy and robustness of our proposed framework.
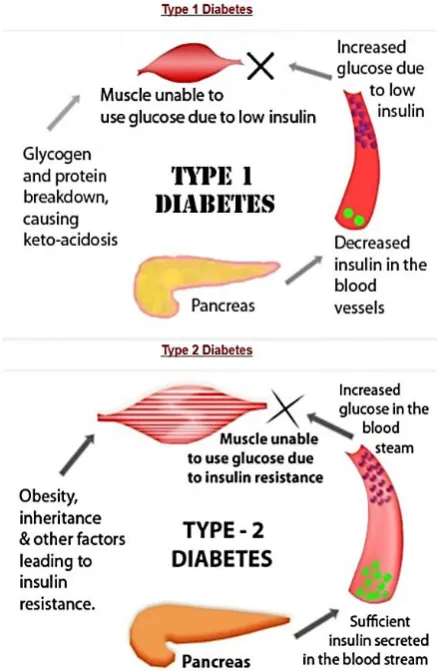
Figure 1. Type1 Diabetes v/s Type 2 Diabete
II.
METHODS AND MATERIAL
Literature Survey
2.1 Waist to height ratio is the best indicator for undiagnosed type 2 diabetes mellitus
≥ 7.0 mmol/l when neither a history of diabetes nor use of hypoglycemic drugs was present. Body weight, height, waist and hip circumferences were measured following standard procedures. Data were analyzed using logistic regression and areas under the receiver operating characteristic curves.
2.2 Identifying obesity indicators which best correlate with type 2 diabetes mellitus.
Obesity has shown to be a prognostic indicator of type 2 diabetes (T2D); still, the power of different obesity indicators in the detection of type 2 diabetes (T2D) remains controversial. This study evaluates the detecting power of the body mass index (BMI), waist circumference (WC), waist to hip ratio (WHR) and waist to height ratio (WHTR) for the presence of type 2 diabetes (T2D) in undiagnosed diabetics among the Chinese population. Individuals were selected from ongoing large-scale population based Beijing Community Pre Diabetes (BCPD) study cohort. The oral glucose tolerance tests (OGTT) are performed to diagnose diabetes. A total of 230 new cases of T2D and 1,868 normal blood glucose subjects were analyzed. ROC curve analyses were used to evaluate the association of different obesity indicators with type 2 diabetes(T2D) and determine the optimal cut-off value points of the best predictor for identifying type 2 diabetes (T2D) in men and women.
2.3 The Best Central Adiposity Index in the Prediction of Cardiovascular Risk Factors
To determine the best index of central obesity those predict cardiovascular risk factors Methods: A cross sectional study involving 918(444 males and 474 females) participants of a community health survey in Sagamu and Remo North Local Government Areas of Ogun State, Nigeria. The body mass index, waist circumference, waist to hip ratio and waist to height ratio (WHR) of the participants are determined by standard protocols. Pearson association between BMI and the three central obesity index was determined. The area under the curve (AUC) on the ROC was used to determine the best measure of central obesity which identified individuals with general hypertension and obesity. Results: WHtR and WC were better than WHR
at detecting the presence of both general obesity and hypertension in both males and females.
2.4 BMI is strongly associated with Waist Circumference and hypertension is strongly associated with type 2 diabetes and dyslipidemia, in northern Chinese adults
To estimate the changes body mass index and waist circumference and their relations with the occurrence of hypertension and type 2 diabetes mellitus (T2DM).
Design 2 consecutive population based cross sectional surveys. Setting A total of 14 districts and seven counties in Shanghai, China. Participants 12 320 randomly selected participants of the survey in 2003– 2004, and 7423 randomly selected participants of the survey in 2009. All participants were residents of Shanghai aged 35–74 years.
2.5 Waist Circumference Rather than Body Mass Index is Better Indicator of Insulin Resistance in Type 2 Diabetes.
mellitus was famous as per the criteria of American Diabetes Association (ADA). Subjects with hypertension, ischemic heart disease, stroke, any acute or constant respiratory disorder and tobacco users were excluded. Subjects were of within the age range of 35-65 years.
2.6 Other risk factors and Hypertension associated with cardiovascular diseases among adults
Objective: to identify the prevalence of hypertension and its connection with cardiovascular risk factors among adults. Method: Population Based, cross sectional, descriptive study conducted with 408 adult persons. Data were collected through a survey and measurements of weight, height and waist circumference. Person’s Chi-square and multiple logistic regressions were used in the data analysis. Results: 23.04% of the individuals reported hypertension with a higher prevalence among women. Probability Ratio indicated that smoking, body mass index (BMI), waist circumference, diabetes mellitus and dyslipidemia were positively associated with hypertension. Conclusion: high personality reported hypertension and its organization with other cardiovascular risk factors such as diabetes, obesity and dyslipidemia show the need for specific nursing intervention and the execution of protocols focused on minimizing complications arising from hypertension, as well as to prevent the emergence of other cardiovascular diseases This Population Based, cross sectional, descriptive study was conducted with adult individuals living in Paiçandu, PR, Brazil. This town has a total area of 170.65 km and an estimated population of 35,942 inhabitants, 19,775 of which are adults aged between 20 and 59 years old.
2.7 Prediction of Fasting Plasma Glucose Status Using Anthropometric Measures for Diagnosing Type 2 Diabetes
It is known that body fat distribution and obesity are significant risk factors for type 2 diabetes. Prediction of type 2 diabetes using a grouping of anthropometric measures remains a controversial subject. This study aims to calculate the fasting plasma glucose status that is used in the analysis of type 2 diabetes by a combination of various measures among Korean adults.[2] A total of 4872 subjects (2956 females and 1916 males)
participated in this study. Based on 38 anthropometric measures, we compared predictions of FPG status using individual against joint measures using two machine learning algorithms. The standards of the area under operating feature curve in the predictions by logistic regression and naive Bayes classifier based on the grouping of measures were 0.742 and 0.738 in females, respectively, and were 0.686 and 0.685 in males, respectively. Our results indicate that prediction of FPG status using a grouping of anthropometric measures was better to individual measures alone in both females andmales.We show that using balanced data of normal and high FPG groups can progress the prediction and reduce the intrinsic bias of the model toward the majority class. Subjects In this study, we analyzed data from 4872 subjects -(2956 females and 1916 males) aged 31–90 years from the Korean Health and Genome Epidemiology study database (KHGES). The KHGES routinely measures weight, height, and circumferences of the regional sites of the body by trained observers according to standardized protocols. Weight is measured to the nearest 0.1 kg using digital scales, height is measured to the nearest 0.1 cm in barefoot and wearing slight clothes only, and circumferences of nine regional sites of the body from forehead to hip are measured to the nearest 0.1 cm in the standing position using a meter tape. BMI is calculated as the weight (kg) divided by the square of the height (m). The circumferences of eight regional sites of the body are measured at the levels of the glabella and occiput (forehead circumference, FC), the thyroid cartilage and cricoid cartilage (neck circumference, NC), the left and right axilla (axillary circumference, AC), the left and right nipples (chest circumference, CC), the left and right seventh and eighth prominence of costochondral junction (rib circumference, RC), the umbilicus (WC), the left and right anterior superior iliac spines (pelvic circumference, PC), and the upper edge of the pubis (hip circumference, HC) [1]. After measuring the circumferences of the eight regional sites, we calculated the ratio between the two sites and obtained a total of 25 ratios.
analyses and categorization experiments for females and Males individually, because gender is a significant effect modifier in the association of anthropometric measures with incident diabetes [5]. Baseline characteristics by measures and gender. National Institute of Health Ethics and the Institutional Review Board of the Korean Health. The study and all the subjects gave written informed consent.
2.8 The association of hypertriglyceridemic waist (HW) phenotype with type 2 diabetes mellitus (T2DM) among individuals with first relative history of diabetes.
Background : Anthropometric measures with biochemical indicators used as screening tools for metabolic abnormalities in adolescents and adults. A only some studies have assessed the relation of Enlarge waist Elevated triglyceride (EWET) diabetes with Phenotype, especially among individuals with first relation history of diabetes. This study aimed to evaluate the association of EWET phenotype with diabetes among individuals with history of diabetes. Anthropometric and biochemical measurements were evaluated in a population based cross sectional study of 332 male and 991 female Isfahani adults aged 35-55 year. The Enlarge waist Elevated triglyceride (EWET) phenotype is defined as serum trigcylglycerol concentrations ≥150 mg/dl and concurrent waist circumference (WC) ≥88 cm in females and ≥102 cm in males.
III.
CONCLUSION
Thus we have studied that as the hypertriglyceridemic waist (HW) is strongly associated with type 2 diabetes Phenotype still, to date, no study has assessed the analytical power of phenotypes based on individual anthropometric measurements and triglyceride levels. The aims of the present study will be to assess the association between the HW phenotype and type 2 diabetes in Korean adults and to calculate approximately the predictive power of different phenotypes consisting of combinations of individual anthropometric measurements and triglyceride levels (TG). Between November 2006 and August 2013, 11938 subjects participated in this demonstration cross sectional study. We measured fasting plasma glucose and triglyceride
levels (TG).and performed anthropometric measurements. We are working binary logistic regression (LR) to examine statistically significant differences between normal subjects and with type 2 diabetes using HW and individual anthropometric measurements. For more consistent prediction results, Naïve Bayes, two machine learning algorithms, and LR, were used to evaluate the predictive power of various phenotypes.
IV.
REFERENCES
[1]. P. T. Katzmarzyk, C. L. Craig, and L. Gauvin, “Adiposity, physical fitness and incident diabetes: The physical activity longitudinal study,” Diabetologia, vol. 50, no. 3, pp. 538–544, Mar. 2007.
[2]. Z. Xu, X. Qi, A. K. Dahl, and W. Xu, “Waist-to-height ratio is the best indicator for undiagnosed type 2 diabetes,” Diabetic Med., vol. 30, no. 6, pp. e201–e207, Jun. 2013. R. N. Feng, C. Zhao, C. Wang, Y. C. Niu, K. Li, F. C. Guo, S. T. Li, C. H. Sun, and Y. Li, “BMI is strongly associated with hypertension, and waist circumference is strongly associated with type 2 diabetes and dyslipidemia, in northern Chinese adults,” J. Epidemiol., vol. 22, no. 4, pp. 317–323, May 2012.
[3]. A. Berber, R. G´omez-Santos, G. Fangh¨anel, and L. S´anchez-Reyes, “Anthropometric indexes in the prediction of type 2 diabetes mellitus, hypertension and dyslipidaemia in a Mexican population,” Int. J. Obes. Relat Metab. Disorders, vol. 25, no. 12, pp. 1794–1799, Dec. 2001.
[4]. B. Balkau, D. Sapinho, A. Petrella, L. Mhamdi, M. Cailleau, D. Arondel, and M. A. Charles, D. E. S. I. R. Study Group, “Prescreening tools for diabetes and obesity-associated dyslipidaemia: Comparing BMI, waist and waist hip ratio. The D.E.S.I.R. Study,” Eur. J. Clin. Nutr., vol. 60, no. 3, pp. 295–304, Mar. 2006.
[5]. I. S. Okosun, K. M. Chandra, S. Choi, J. Christman, G. E. Dever, and T. E. Prewitt, “Hypertension and type 2 diabetes comorbidity in adults in the United States: risk of overall and regional adiposity,” Obes. Res., vol. 9, no. 1, pp. 1–9, Jan. 2001.
diabetes in Jamaica: the role of anthropometry,” Obes. Res., vol. 10, no. 8, pp. 792–798, Aug. 2002.
[7]. N. T. Duc Son le, T. T. Hanh, K. Kusama, D. Kunii, T. Sakai, N. T. Hung, and S. Yamamoto, “Anthropometric characteristics, dietary patterns and risk of type 2 diabetes mellitus in Vietnam,” J. Amer. Coll. Nutr., vol. 24, no. 4, pp. 229–234, Aug. 2005.
[8]. G. T. Ko, J. C. Chan, C. S. Cockram, and J.Woo, “Prediction of hypertension, diabetes, dyslipidaemia or albuminuria using simple anthropometric indexes in Hong Kong Chinese,” Int. J. Obes. Relat. Metab. Disorders, vol. 23, no. 11, pp. 1136–1142, Nov. 1999.