© 2017 IJSRST | Volume 3 | Issue 3 | Print ISSN: 2395-6011 | Online ISSN: 2395-602X Themed Section: Science and Technology
Assessment of Dosimetric Functions of An Equinox 100 Telecobalt Machine
Samuel Nii Adu Tagoe
123, Michael Nyamadi
3, Francis Doughan
3, Evans Sasu
3, Anthony Ashun
31Department of Radiography, School of Biomedical and Allied Health Sciences, College of Health Sciences, University of Ghana, Legon, Accra, Ghana
2Department of Physics, University of Cape Coast, Cape Coast, Ghana
3National Centre for Radiotherapy and Nuclear Medicine, Korle Bu Teaching Hospital, Korle Bu, Accra, Ghana
ABSTRACT
For good treatment outcome in external beam radiotherapy (EBRT), it is imperative to know with great accuracy the amount of radiation dose that will be deposited at any point within the irradiated region of a patient. And because absorbed dose distributions cannot be measured directly in a patient, there is therefore the need to calculate or estimate the dose distributions.The dose calculations are based on dosimetric functions determined or measured in full scatter water phantom, which are used to try to link the doses measured in water to what would be pertain in the patient.Two of these dosimetric functions: percentage depth dose and relative dose factor, had been assessed for an Equinox 100 telecobalt machine and compared with those of "silver" beam data provided by the manufacturer of the teletherapy machine. The measured percentage depth doses were also compared with those of a published beam data. The said dosimetric functions were measured to facilitate the commissioning of a treatment planning system for treatment simulation in external beam radiotherapy. The irradiation geometries used for the measurements were based on recommendations of the vendor of the treatment planning system, which were in tandem with what are generally recommended for the measurements of the dosimetric functions. The measured percentage depth doses compared favourably well with those of the published beam data than those of the "silver" beam data, and were within ± 6.33% (mean of 1.93 ± 1.67%) and ±17.09% (mean of 4.98 ± 4.12%) when compared with percentage depth doses from: the published beam data and the "silver" beam data respectively. The differences in the percentage depth doses from the published beam data relative to those measured for field sizes ranging from: 4 x 4 cm2 to 30 x 30 cm2 for depths in water up to 20 cm were within ± 2% (recommended tolerance for central axis
dosimetry parameter constancy). The differences in the relative dose factor values from the "silver" beam data relative to those measured were within ± 1% (mean of 0.49 ± 0.34%). This reiterates the fact that one needs to be circumspective in the use of published and teletherapy machine manufacturer provided beam data for clinical applications, though these beam data may be used to assess one's measured beam data.
Keywords: "Silver" Beam Data, Published Beam Data, Percentage Depth Dose and Relative Dose Factor
I.
INTRODUCTION
For favourable treatment outcome in external beam radiotherapy (EBRT), it is imperative to know with great accuracy the amount of radiation dose that will be deposited at any point within the irradiated region of a patient. Placing radiation dosimeters within the patient is not practicable. Dosimetric functions determined or measured in a full scatter water phantoms are used to try to link the doses measured in the water to what will pertaining within the patient [1]. Two most crucial dosimetric functions in use are percentage depth dose
percentage ratio of the dose at a required depth in water for a specific field size to that at the depth of maximum dose for the same field size for a particular SSD and beam energy [1,3]. Since it is time consuming to obtained teletherapy machine outputs for all field sizes that may be used clinically, machine output is usually determined for a reference field size and relative dose factors (RDFs) are used to obtain machine output for other field sizes from that of the reference field size [3]. RDF gives an indication how machine output for a particular field size relates to that of the reference field size ( usually, 10 cm x 10 cm ) which is used for beam output calibration. RDF is defined as the ratio of the dose at a reference depth (usually the depth of maximum dose) in water for required field size to that of the reference field measured at the same depth and source to detector distance [3].
These beam data are obtained during the initial commissioning of a teletherapy machine and are treated as the standard data for clinical use and need to be verified periodically by a qualified medical physicist to ensure that the machine parameters have not changed during normal operation [3]. These data are input into the treatment planning system (TPS) based on the manufacturer of the TPS requirements to facility simulation of treatment with the TPS prior to treatment delivery. As manufacturers perfect the manufacturing processes for teletherapy machines, there has been an attempt by vendors to standardize machines to have identical beam characteristics [3]. In some cases, "golden" or "silver" beam data sets are provided which contain most or all of the commissioning beam data required by the TPS. These beam data are acquired by the manufacturer of the teletherapy machine from same or similar model of the teletherapy machine at the manufacturer's facility. The one performing the commissioning has the choice of measuring all the required data, or verifying a carefully selected subset of the data at time of beam commissioning. The preferred option will depend on a number of factors, such as the make and model of the teletherapy machine and TPS, as well as the accuracy required for clinical use [3]. Published beam data may be used to assist in arriving at a decision. One needs to be circumspective with the use of any golden or silver beam data within a clinic, as variations in beam parameters have been noted between beams with the same nominal energies [3]. Also,
conditions prevailing during the time of the commissioning will not be the same as at the manufacturer's facility. Measuring all the required beam data also provide a thorough check of the teletherapy machine, which may unearth problems that may not otherwise be revealed with a mere spot check. However, a golden and or published beam data set may be an excellent source of quality assurance for verifying one’s commissioning results [3]. Beam data measured to determine beam characteristics from a teletherapy machine are usually measured with square field sizes, and through the equivalent square field concept beam data for other field sizes are obtained [3].
Sometimes owing to inadequacies in shielding requirement for a room housing a teletherapy machine (specifically telecobalt machines), the teletherapy machine is fitted with a beam stopper at the opposite end of the treatment head to attenuate the beam as it transmits through the patient. Some of the beam stoppers are not retractable and their orientation hinder the positioning of a motorized water tanks, which are used to measure and acquire most of the beam data required during commissioning process. With reference to this, clinics therefore seek to use alternative means in obtaining the required beam data. Also, lack of appropriate dosimetry equipment to facilitate acquisition of PDD data compel some radiotherapy centre to rely solely on published PDD data for clinical use. This is often the case for telecobalt machines where the beam quality does not change. This is not the case for the relative dose factor (RDF) which is very dependent on collimator design.
This paper seeks to assess measured PDD and RDF data for an Equinox 100 cobalt 60 teletherapy machine and compare them with those of silver beam data provided by the manufacturer of the teletherapy machine. The PDDs are also compared to published PDD data.
II.
METHODS AND MATERIAL
was connected to a UNIDOS electrometer (T10002-20427; PTW Freiburg, Germany), and the electrometer readings corrected for influencing factors (temperature and pressure). The beam data under consideration formed part of beam data acquired for an Equinox 100 cobalt 60 teletherapy machine (Best Theratronics, Canada) to facilitate the commissioning of a Prowess Panther treatment planning system (Prowess Inc., USA) for treatment planning.
The depth dose measurements were done at the beam central axis for depths ranging from: 0 to 30 cm for SSD of 100 cm. The depth doses were normalized to that of the depth of maximum dose, Dmax (at 100 %). The PDDs were measured for field sizes ranging from: 4 x 4 cm2 to 43 x 43 cm2. The RDFs were determined by measuring outputs at the beam central axis for field sizes ranging from: 3 x 3 to 43 x 43 cm2 at depth of Dmax for SSD of 100 cm, and then normalizing to that of the reference field size of 10 x 10 cm2. For all the measurements it was ensured that there is at least 10 cm of water below the ionization chamber to provide the needed backscattered radiation.
The irradiation geometries used for the beam data acquisition were based on recommendations provided by the vendor of the treatment planning system being commissioned, which were in tandem with what are generally recommended for the measurements of the dosimetric functions.
III.
RESULTS AND DISCUSSION
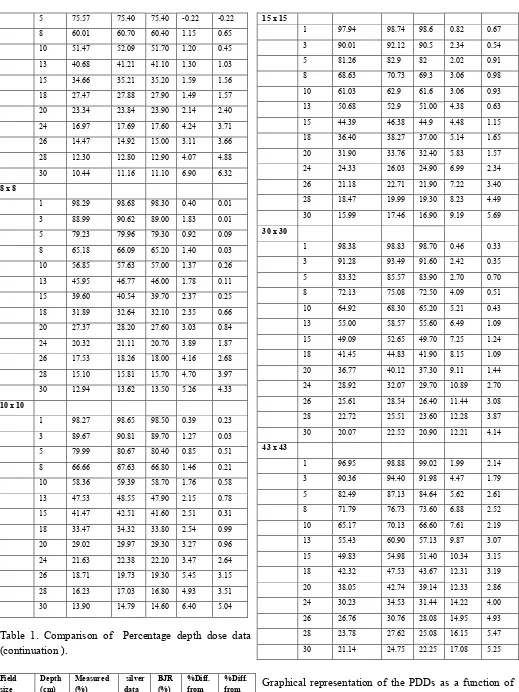
The measured PDD data are listed in table 1 for some selected depths within the phantom and field sizes. Corresponding PDDs obtained from BJR supplementary 25 [2] and that from "silver" beam data provided by the manufacturer teletherapy machine are also listed in table 1. The differences between the measured PDDs and their corresponding PDDs obtained from the published beam data and the "silver" beam data respectively, are expressed as percentage of the measured PDDs, and are also listed in table 1. Comparing PDDs from the "silver" beam data to their measured counterparts resulted in discrepancies ranging from: 0.00% to 17.08% (mean of 4.98%; standard deviation of 4.12%). The PDDs from the "silver" beam data were generally lower in value than their measured counterparts. On the other
hand, comparing PDDs from the published beam data to their measured counterparts resulted in discrepancies ranging from: -0.22% to 6.32% (mean of 1.93%; standard deviation of 1.67%). The PDDs from the published beam data were also lower in value than their measured counterparts, with the exception of those for depths ranging from 1 to 5 cm for field size of 4 x 4 cm2.
The PDDs from the published beam data compared favourable well to the measured PDDs than those of the "silver" beam data provided by the manufacturer of the teletherapy machine. Majority of the discrepancies between the measured PDDs
and those of the
published beam data for field sizes ranging from: 4
x 4 cm
2to 30 x 30 cm
2and for depths ranging from
1 to 20 cm were within ± 2% tolerance stipulated
for central axis dosimetry parameter constancy [4].
The same could not be said about deviations of the
PDDs from the "silver" beam data, which are more
dispersed. This makes it non-productive task by
trying to verify a selected subset of the PDD data
one wish to use. The large differences in PDD
values of the "silver" beam data relative to those
measured may be attributed to detector types used
in the acquisition of the beam data [4]. The "silver"
beam data PDDs were measured with a diode (Si–P)
type detector (PFD3G, Scanditronix/Wellhofer)
with thickness of active volume of 0.06 mm and
diameter of active area 2 mm [5]. Also differences
in source design specifications may contribute to
the discrepancies in the PDD values. Although
collimator design differences may also contribute to
the differences in the PDD values relative to those
measured, the significance should have been felt in
the discrepancies recorded for the RDF values when
compared to those measured, which were within the
± 2% recommended tolerance level set for output
constancy[4].
Table 1. Comparison of Percentage depth dose data
Field size (cm2)
Depth (cm)
Measured (%)
silver data (%)
BJR (%)
%Diff. from silver data
%Diff. from BJR
4 x 4
1 97.96 98.03 97.50 0.07 -0.47
5 75.57 75.40 75.40 -0.22 -0.22
8 60.01 60.70 60.40 1.15 0.65
10 51.47 52.09 51.70 1.20 0.45
13 40.68 41.21 41.10 1.30 1.03
15 34.66 35.21 35.20 1.59 1.56
18 27.47 27.88 27.90 1.49 1.57
20 23.34 23.84 23.90 2.14 2.40
24 16.97 17.69 17.60 4.24 3.71
26 14.47 14.92 15.00 3.11 3.66
28 12.30 12.80 12.90 4.07 4.88
30 10.44 11.16 11.10 6.90 6.32
8 x 8
1 98.29 98.68 98.30 0.40 0.01
3 88.99 90.62 89.00 1.83 0.01
5 79.23 79.96 79.30 0.92 0.09
8 65.18 66.09 65.20 1.40 0.03
10 56.85 57.63 57.00 1.37 0.26
13 45.95 46.77 46.00 1.78 0.11
15 39.60 40.54 39.70 2.37 0.25
18 31.89 32.64 32.10 2.35 0.66
20 27.37 28.20 27.60 3.03 0.84
24 20.32 21.11 20.70 3.89 1.87
26 17.53 18.26 18.00 4.16 2.68
28 15.10 15.81 15.70 4.70 3.97
30 12.94 13.62 13.50 5.26 4.33
10 x 10
1 98.27 98.65 98.50 0.39 0.23
3 89.67 90.81 89.70 1.27 0.03
5 79.99 80.67 80.40 0.85 0.51
8 66.66 67.63 66.80 1.46 0.21
10 58.36 59.39 58.70 1.76 0.58
13 47.53 48.55 47.90 2.15 0.78
15 41.47 42.51 41.60 2.51 0.31
18 33.47 34.32 33.80 2.54 0.99
20 29.02 29.97 29.30 3.27 0.96
24 21.63 22.38 22.20 3.47 2.64
26 18.71 19.73 19.30 5.45 3.15
28 16.23 17.03 16.80 4.93 3.51
30 13.90 14.79 14.60 6.40 5.04
Table 1. Comparison of Percentage depth dose data (continuation ).
Field size (cm2)
Depth (cm)
Measured (%)
silver data (%)
BJR (%)
%Diff. from silver data
%Diff. from BJR
15 x 15
1 97.94 98.74 98.6 0.82 0.67
3 90.01 92.12 90.5 2.34 0.54
5 81.26 82.9 82 2.02 0.91
8 68.63 70.73 69.3 3.06 0.98
10 61.03 62.9 61.6 3.06 0.93
13 50.68 52.9 51.00 4.38 0.63
15 44.39 46.38 44.9 4.48 1.15
18 36.40 38.27 37.00 5.14 1.65
20 31.90 33.76 32.40 5.83 1.57
24 24.33 26.03 24.90 6.99 2.34
26 21.18 22.71 21.90 7.22 3.40
28 18.47 19.99 19.30 8.23 4.49
30 15.99 17.46 16.90 9.19 5.69
30 x 30
1 98.38 98.83 98.70 0.46 0.33
3 91.28 93.49 91.60 2.42 0.35
5 83.32 85.57 83.90 2.70 0.70
8 72.13 75.08 72.50 4.09 0.51
10 64.92 68.30 65.20 5.21 0.43
13 55.00 58.57 55.60 6.49 1.09
15 49.09 52.65 49.70 7.25 1.24
18 41.45 44.83 41.90 8.15 1.09
20 36.77 40.12 37.30 9.11 1.44
24 28.92 32.07 29.70 10.89 2.70
26 25.61 28.54 26.40 11.44 3.08
28 22.72 25.51 23.60 12.28 3.87
30 20.07 22.52 20.90 12.21 4.14
43 x 43
1 96.95 98.88 99.02 1.99 2.14
3 90.36 94.40 91.98 4.47 1.79
5 82.49 87.13 84.64 5.62 2.61
8 71.79 76.73 73.60 6.88 2.52
10 65.17 70.13 66.60 7.61 2.19
13 55.43 60.90 57.13 9.87 3.07
15 49.83 54.98 51.40 10.34 3.15
18 42.32 47.53 43.67 12.31 3.19
20 38.05 42.74 39.14 12.33 2.86
24 30.23 34.53 31.44 14.22 4.00
26 26.76 30.76 28.08 14.95 4.93
28 23.78 27.62 25.08 16.15 5.47
30 21.14 24.75 22.25 17.08 5.25
where the maximum deviations from the measured PDDs were recorded for comparisons with the published beam data and the "silver" beam data respectively. The same axis was used for all the plots. The PDDs for a particular field size followed similar trend. For the specified field sizes, the maximum deviations occurred at a depth of 30 cm.
Figure 1. Variation of percentage depth dose as a function of depth in water for field sizes of 4 x 4 cm2
and 43 x 43 cm2.
The measured RDFs are listed in table 2 together with their counterpart from the "silver" beam data for the various field sizes. Also shown in table 2 are the discrepancies between the measured RDFs and those of the "silver" beam data, which are expressed as percentage of the measured RDFs for the respective field sizes. The percentage deviations between the measured RDFs and those obtained from the "silver" beam data were within ± 1% (mean of 0.49% and standard deviation of 0.34%);
IV.CONCLUSION
This shows that it is not prudent for one to solely rely on published and teletherapy machine manufacturer provided beam data for clinical applications, though these beam data may be used to assess one's measured beam data.
V.
REFERENCES
[1]. E.B. Podgorsak. Radiation oncology physics: A handbook for teachers and students. International Atomic Energy Agency, Vienna. 2005, Pp. 161 - 216.
[2]. British Journal Of Radiology, Central Axis Depth Dose Data for Use in Radiotherapy, Suppl. 25 (1996). Pp. 58 - 59, 153- 157.
[3]. Das I J, Cheng C, Watts R J, Ahnesjö A. et al. Accelerator beam data commissioning equipment and procedures: Report of the TG-106 of the Therapy Physics Committee of the AAPM. Med. Phys. 2008; 35 (9): 4186 - 4211.
[4]. Kutcher G J, Coia L, Gillin M, Hanson W F.et al. Comprehensive QA for radiation oncology: Report of AAPM radiation therapy committee task group 40 Med. Phys. 1994;21 (4): 581- 618. [5]. MDS Nordion Inc. Theratron equinox eternal
beam therapy system: Beam data summary sheet. MDS Nordion Inc., Canada. 2006, Pp. 1 - 4.
PD
D
(c
m
)
depth in water (cm) 4 x 4 cm^2
Measured PDD
PD
D
(%
)
depth in water (cm) 43 x 43 cm^2