prior to the failure by means of excessive deformations. The design of structure should be such that it can sustain in seismic load. This paper emphasis on a analysis of nonlinear and static pushover for the G+5 storey steel frame building with unbraced and braced systems. A variation of the lateral shear force with respect to the lateral deformation of steel frame building is calculated by pushover analysis. Shear capacity of any structure is enhanced with the application of the steel bracing. The G+5 storey industrial steel frame building is designed for crossed X bracing and V bracing and comparison is made between the bare frame and frame with bracing and performance point of structure is carried out through nonlinear static pushover analysis. Analysis is done by using the ETABS -2015 software.
Keywords: Steel building, Bracing system, Pushover analysis
________________________________________________________________________________________________________ I. INTRODUCTION
Earthquake are most life damaging and destructive phenomenon .earthquake are generated due to sudden release of energy in earth’s crust that create the seismic waves which appear at various instance of time with different intensity level. Building collapse or damage due to the earthquake ground motion. It has the ground motion in all directions radiating from epicenter. Whenever an earthquake occurs, the foundation of building encounters supreme frequency displacements affect the inertial force as well as the components. The inertial force which causes not only due to tendency of the building to abide at rest and its prime position, although the ground below the building is dynamic. Lateral stability is extensive quandary of structure extensively in the regions with higher earthquake frequency. The issue of lateral stability predominated and to counteract this bracing system is supreme solution. Inelastic performance is one of the main reasons influencing the choice of bracing systems. The bracing system which has a numerous plastic deformation prior to breakdown has ability to devour massive energy concurrently with the earthquake.
A nonlinear static pushover analysis is incremental analysis which is exploited to analyze the relationship between force and displacement, in preference to capacity curve for various components of structure . For determination of relationship between force and displacement, the pushover analysis should be accomplished as either by controlling the force or displacement. The pushover performed for control in force can be carried out with known gravity load. An accuracy of the results are influenced due to presence of some mathematical problems when pushover is carried out by controlling the force. Normally, the pushover analysis is accomplished as displacement- controlled, where lateral displacement are imposed. Response of structure ahead of the maximum strength can be determined only by the displacement controlled pushover analysis. The forces and deformation calculated at the predominant displacement which can be accomplished to determine the deformation demands as well as inelastic strength and can be analyzed with obtainable capacity.
Fig. 1: Static Approximations in the Pushover Analysis.
Fig. 2: Lateral force VS Displacement curve
1) Capacity: - It represents capability of the structures to resist the seismic demand. 2) Demand: - It shows the earthquake ground motion.
3) Performance: - when capacity spectrum and demand spectrum intersect each other called performance point.
II. STRUCTURAL MODELLING
For the analysis work, the models of G+5 steel frame building are made to know the realistic behavior of building during earthquake with and without bracing. The plan of the building is 30m X 20m.The columns are assumed to be fixed at the ground level. Push over analysis is used.
Plan of building:
Plan of the steel frame building which is used for the study is shown in figure 3
Fig. 3: plan of steel frame structure
Building data to be used
Sr.No Building details
1 Zone V
2 Zone factor 0.36
3 Response reduction factor 5
4 Importance factor 2
5 Height of building 18 m
6 Column section ISWB-600
7 Beam section ISMB450
8 Bracing section 100X100X10 9 Thickness of slab 150 mm
10 F to F height 3 m
11 Grade of steel section Fe345
12 Grade of concrete M20
Fig. 4: Steel frame model without Bracing
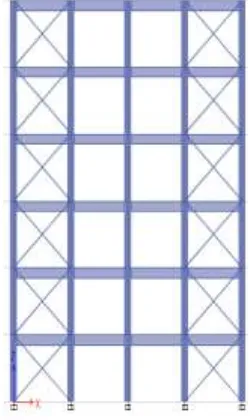
Fig. 6: Steel frame model with X bracing
III. RESULTS
Pushover curve results
Fig. (a): Pushover Curve for G+5 Structure bare frame
Fig. (C): Pushover Curve for G+5 Structure X brace frame Fig. 7: Comparison of pushover curve
Comparison of the various pushover curves which are getting from doing nonlinear static pushover analysis is shown in above figure 7. Pushover curve shows base shear vs. monitored displacement obtained from pushover analysis.
Spectral acceleration VS spectral displacement curve results
(a) Sa vs Sd Curve For G+5 Structure bare frame
(c) Sa vs. Sd Curve For G+5 Structure X brace frame Fig. 8: comparison of performance point
The comparison of performance point for bare frame, V bracing frame and X bracing frame structure is shown in figure 8 above. The capacity and demand spectrum converges at the performance point. Where demand curve is demonstrated in red color and capacity curve is in green color. Performance point represents the universal behavior of the structures.
Bilinear curve results
The target displacements obtained are used in the design of structure. Target displacement for bare frame is 188.9 mm and for structure with X bracing and V bracing 148.1 mm and 154.7 mm respectively. For bare frame the target displacement is within the capacity of structure.
(a) Bilinear Pushover Curve for G+5 Structures for bare frame
(c) Bilinear Pushover Curve for G+5 Structures for X brace frame Fig. 9: Bilinear curve results
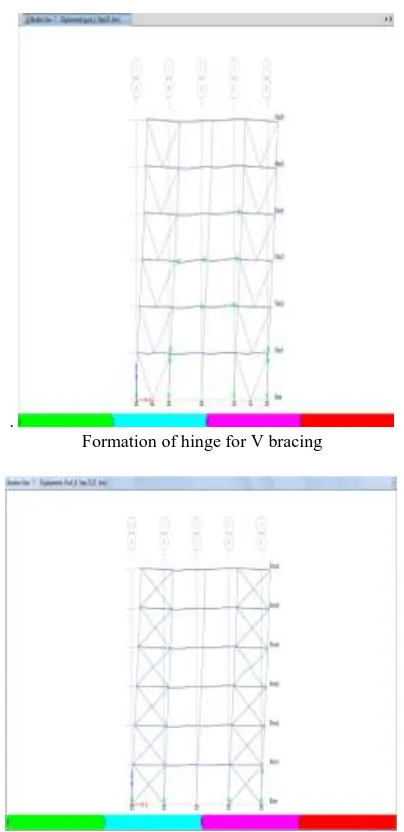
IV. HINGE STATE RESULTS
- The yielding of the structural components shown with point B.
- The nominal strength represented by point C and shows the ultimate state.
- An initial collapse of structural element is shown as point D which shows the counteraction to lateral loading converges after point C.
- The resistance remained in between point D and E permits the element to assist the gravity load. After the point E, gravity loads and the maximal distortion capacity may not be assisted.
.
Formation of hinge for V bracing
Formation of hinge for X bracing
Fig. 10: hinge formation for without and with bracing system
The above figure 10 shows location of plastic hinges of the structures.
Fig. 11: Comparison of maximum base shears
Fig. 12: Comparison of the maximum displacements
Comparison of the maximum displacements get from accomplishing the pushover analysis on every the structures considered is shown in above Fig. 12
Fig.13: Comparison of maximum time periods
Comparison of maximum time periods getting from performing pushover analysis on all the structures considered is shown in above figure 13.
V. CONCLUSION
The use of steel bracing is predominant approach for strengthening or retrofitting the existing structures. Base shear of bare frame is decreased as compared to X and V type of bracing. Displacement of bracing is decreased as compared to bare frame. The bare frame has more hinges have moderate damage to structural element. The hinges which are further than collapse prevention point must be retrofitted or by changing the column sizesThe brace system results in enhanced level of performance not only in terms of displacement of roof but also sustaining capacity base shear. It is clear that the frames with bracings have lesser vulnerability compared to the frames without bracings. Pushover analysis shows the nonlinear behavior of structure which helps in performance based seismic design of structure.
REFERENCES
[1] “Seismic progressive collapse analysis of concentrically braced frames through incremental dynamic analysis” by Farshad Hashemi Rezvani, Majid Mohammadi gh (2012).
[2] “Seismic analysis of steel frame with bracings using pushover analysis” by Mohammed Idrees Khan, Mr. Khalid Nayaz Khan (2014). [3] “seismic analysis of high rise steel frame building with with and without bracing” by K.K.Sangle, K.M.Bajoria, V.Mhalungkar (2012).
[4] “Seismic performance assessment of concentrically braced steel frames” by P. Uriz and S.A. Mahin. . (13th World Conference on Earthquake Engineering Vancouver, B.C., Canada August 1-6, 2004)
[5] “Comparative study of Rc framed structures using spectra based pushover analysis” by Pavan Kumar, Avinash Gornale, Gargi G S, B G Naresh Kumar. [6] IS 800:2007, “General construction in steel –Code of Practice Bureau of Indian standards, New Delhi”.