©
Center for Promoting Education and Research
www.cpernet.org
THE EFFECT OF QUALITY OF SERVICE AND CORPORATE IMAGE ON CUSTOMER LOYALTY THROUGH CUSTOMER SATISFACTION IN INFORMA INNOVATIVE FURNISHINGS
Arie Dharmansyah Student Master of Management Universitas Krisnadwipayana Jakarta PO BOX 774 / Jat CM Jakarta 13077 Indonesia
Email: dharmansyah.arie@gmail.com Indonesia
Ismail Razak Lecturer
Faculty of Economics Universitas Krisnadwipayana Jakarta PO BOX 774 / Jat CM Jakarta 13077 Indonesia
Email: ismailrazak.zain@gmail.com Indonesia
Hary Indratjahjo Lecturer Faculty of Economics Universitas Krisnadwipayana Jakarta PO BOX 774 / Jat CM Jakarta 13077 Indonesia
Email: indrahandrito@gmail.com Indonesia
Abstract
This study aims to examine the effect of service quality and corporate image on customer loyalty through customer satisfaction. The study was conducted on Informa customers in the Metropolitan Mall Bekasi with a total sample of 100 respondents. The samples in this study using techniques are accidental sampling. Data analysis using path analysis.
The results showed that variable quality of service and corporate image influence on simultaneous customer loyalty. Variables affect service quality on partially customer loyalty. Affect the corporate variable image is partially customer loyalty. Variables affect partially customer satisfaction to customer loyalty. The direct effect of service quality on customer loyalty is 0.897. The influence of service quality on customer loyalty through customer satisfaction is 0.324 x 0.917=0.297. The direct effect of corporate image on customer loyalty is 0.0,541. While the influence of corporate image on customer loyalty through customer satisfaction is 0.541 x 0.917 = 0.496. In this case, the direct influence is smaller than indirect influence can interact with the image as an intervening variable.
Keywords: service quality, corporate image, customer satisfaction, customer loyalty
Introduction
©
Center for Promoting Education and Research
www.cpernet.org
of a shopping center with retail outlets which enliven the world of modern furniture retailing include Informa, Chandra Karya, JYSK, Atria, Index, and Ikea.
Intense competition in the retail furniture business, also due to the increasing number of retail furniture business overseas into the domestic market. The entry of retail business from overseas furniture professionally managed domestic furniture retail business demand for professionals as well in order to compete in serving consumers. Competitive realities are furniture shopping centers should work hard to attract consumers. Therefore we need a strategy to win over consumers with continuous attention to customer satisfaction and customer loyalty (Javalgi in Bloemer and Schroder, 2003).
Increased competition and consumer demands on quality service, requires retail businesses to change policies and perspective to the consumer (Julita,2001). The question that must be answered by management is whether oriented to increase sales by attracting new customers or oriented on maintaining existing customers. The thing to understand is oriented to the increase in sales to attract new customers, the company is able to obtain the turnover increased in the moment. However, these new consumers cannot promise to continue to use the company's products. So it is better done by the retail businesses is to maintain existing customers because it can provide long-term benefits are greater for the company.
Retail services are one of the forming of customer satisfaction, where the improvement in the performance of retail services is done by improving the quality of service on the physical aspects, reliability, personal interaction, problem-solving, and company policies (retail). Performance retail services in accordance with customer expectations causing the retailer will have a competitive advantage in the eyes not only to the satisfaction of consumers but also have an impact on customer loyalty (Lu and Seock, 2008). The environment in the shop has a very important role to attract consumers. Store environment with its physical facilities along with the atmosphere in the store, pricing,
Armed with a positive corporate image, dissemination of information by word of mouth can cause people who receive such information will be interested and immediately visited the store. The better the image of the store in the eyes of the consumer, the greater the Impulsive buying is done by consumers and vice versa (Bloemer and
Ruyter, 2008). This is also confirmed by other studies suggest that there is a positive relationship between store
image, customer satisfaction and loyalty (Bloemer and Ruyter, 2008). The phenomenon of the emergence of a variety of furniture retail company in Indonesia in various forms of modern stores. This prompted a large furniture retail company to keep doing research on the behavior of customers.
©
Center for Promoting Education and Research
www.cpernet.org
Based on the observation of researchers and resources from management Informa in the customer service department, obtained information that fluctuations in customer visits from 2016 through 2017 because the number of customer complaints received by Informa, where customer complaints come from different kinds of problems ranging from pricing, promotion, location, product, display of goods, to services and facilities provided. For more details can be seen below.
Table 1. Classification of Customer Complaints Classification Of
Complaints Complaint Type Absolute Relative (%)
Retail services
1. The parking facilities 32 16
2. Payment Services 24 12
3. Physical Environment 19 9
Corporate image
1. Delivery of Goods 28 14
2. Installation of Goods 22 11
3. Products 19 10
4. Display goods 17 8
5. Promotion 16 8
6. Atmospheric shop 13 7
7. Location 11 5
Total 201 100
Customer complaints were classified categories of retail services, among others: the parking facilities provided by the payment service at the checkout Informa assessed by the customer less than satisfactory, as well as the physical store environment. For the retail service categories of complaints to parking facilities most often submitted by visitors. While the complaints in terms of store image consist of: product, product delivery, product installation, display of goods, promotion, store atmosphere, and the location was deemed unsatisfactory for consumers. For the category of store image, the most frequently complained about by the customer is the delivery and installation of the product. Although virtually every company does not expect any consumer complaints within the company, it wants its customers satisfied but still these complaints always come. The complaints came were not able to be regarded as a problem but rather as constructive criticism for the company. Thus, Informa required to pay more attention in order to reduce the complaints received related to retail services and the image of the store.
Literature Review Quality of Service
Understanding the quality of service is modernity with advances in technology will result in a very tight competition to acquire and retain customers. Quality of service becomes a necessity that must be done so that the company can survive and still won the trust of customers. Consumption patterns and lifestyles demanding enterprise customers are able to provide a quality service. The company's success in providing quality service can be determined with the approach of service quality developed by Parasuraman, Berry and Zenthaml (in Lupiyoadi, 2006: 181). One approach to the quality of service that made reference in marketing research is SERVQUAL (Service Quality) developed by Parasuraman, Zeithmal, and Berry (1988). Lupiyoadi and Hamdani (2006) there are five dimensions of service quality, namely:
©
Center for Promoting Education and Research
www.cpernet.org
2). Reliability, according to Parasuraman, Zeithaml, and Berry (1998), reliability is the company's ability to provide services in accordance with what was promised are accurate and reliable. Performance must be in accordance with the expectations of consumers, which means timeliness, the same service to all customers without error, sympathetic attitude, and with high accuracy. Fulfilment in the service will reflect the company's credibility. Compared to the other four dimensions of service quality is the physical form, responsiveness, assurance, and certainty, as well as empathy dimensions of reliability is often perceived to be the most important for customers from a variety of service industries. Because if consumers feel that the reliability of a company's services is in line with expectations,
3). Responsiveness, this dimension is the dimension that is most dynamic. Consumers' expectations almost certainly will change with the speed of responsiveness of service providers. According to Parasuraman, Zeithaml and Barry (1988), responsiveness with respect to the willingness and ability of our employees to help our customers and responded to their request, and let you know when the services will be provided and then provide services quickly. The level of willingness or concern will be the extent to which the company tried to help consumers. The shape can be done with clear delivery of information, actions which can benefit the customer. While Kotler (2001: 616) defines responsiveness as the willingness to help customers and provide services quickly.
4). Guarantee, according to Parasuraman, Zeithaml and Barry (1988), confidence (assurance) is a guarantee to consumers include the ability, courtesy, and trustworthiness which is owned by the staff, free from danger or risk of doubt, the behavior of employees is expected to grow trust and companies are expected to foster a sense of security for customers. While Kotler (2001: 617) defines the confidence (assurance) is the knowledge of the product appropriately, compensation of employees in providing services, skills in providing information, the ability to provide security and the ability to instil consumer confidence in the company.
5). Empathy, according to Parasuraman. Zeithaml, and Berry (1998), empathy that give a sincere attitude and a private individual or given to customers by striving to understand the desires of consumers. Where a company is expected to have the understanding and knowledge of the customer, understanding customers' specific needs, and has the operating time that is convenient for the customer. Consumers of the upper middle group have high expectations that service providers know them personally. Companies must know their names, their specific needs, and if necessary to know your hobbies and other personal characteristics. If not, the company will lose the opportunity to be able to satisfy them from this aspect.
Corporate Image
Understanding the corporate image, according to the corporate image Adona (2006: 107) is an impression or mental impression or a picture of a company in the eyes of the audience that is formed based on their own knowledge and experience. The corporate image intentionally needs to be created so that is positive (Sukatendel in Soemirat, 2003:113). The positive thing that can drive the image of the company through the company's success and history or the history of the company. Thus, the image of a company is a representation of an institution in the hope of encouraging a positive corporate image.
Indicators corporate image.
1.Reputation/image Informa trustworthy and has the responsibility and reputation Informa guaranteed because it has an ISO certificate and many awards.
2.Support services such as logo owned by Informa is very easy to remember and have opening hours according to the customer's wishes.
3.The layout of the store facility/store layout perception that display arranged neatly and display products and decorating products at Informa interesting and inspiring.
Customer Satisfaction
©
Center for Promoting Education and Research
www.cpernet.org
after comparing the performance or results that he felt compared with expectations (Kotler et al, 2001: 52). If the performance of the product is not in accordance with expectations after consumption so consumers will feel dissatisfied that of the learning he will be disappointed. However, if the opposite occurs, namely the performance of the products or services in accordance with expectations, consumers will feel very excited to consume the product or service it back. While Tse and Wilton (1988) in Lupiyoadi (2006:349) satisfaction or dissatisfaction of customers is customer response to the evaluation of nonconformity (disconfirmation) are perceived between prior expectations and actual performance product that is felt after use. Wilkie (1990) defines it as an emotional response to an evaluation of the experience of the consumption of a product or service. Engel, et al (1990) suggest that customer satisfaction is a full evaluation of alternatives selected purchase where at least equal or exceed customer expectations, while dissatisfaction arises when the results (outcomes) did not meet expectations (Tjiptono,2004: 349). Customer satisfaction with a product or service, it is actually something that is hard to come by if a service company or the industry did not really understand what is expected by the consumer. For products or services with the same quality, can provide the level of satisfaction is different for different consumers. Therefore, a company must always pay attention to the quality of the products and services provided to consumers. Customer satisfaction is the customer response to the discrepancy between the level of the previous interest and the actual performance had felt after use (Rangkuti,2002:30). Customer satisfaction is influenced by the perception of service quality, product quality, price and the factors that are personal and that is the situation for a moment.
Indicators of customer satisfaction, from a variety of expert opinions expressed, can be summarized the definition of customer satisfaction is the response of the behavior exhibited by the customer by comparing the perceived performance or results to expectations. If the result is felt below expectations, then the customer will be disappointed, not satisfied even dissatisfied, but otherwise if in line with expectations, customers will be satisfied and if the performance exceeds expectations, the customer will be very satisfied. According to Kotler (2001: 41), there are four indicators that can be used to measure customer satisfaction, namely:
1). The system of complaints and suggestions, a company that provides full opportunity for customers to express their opinions or even complaints, a consumer-oriented company (customer oriented).
2). Customer satisfaction surveys, sometimes companies need to conduct a customer satisfaction survey on the quality of the company's services or products. This survey can be done by distributing questionnaires by employees of the company to its customers. Through the survey, the company can know the weaknesses and strengths of the company's products or services, so that the company can make improvements on things that are considered less by the customer.
3). Ghost shopping, This method implemented by hiring some company (ghost shopper) to act as a customer in the company's competitors, with the purpose of the ghost shopper can determine the quality of service the company's competitors so it can serve as a corrective to the quality of service the company itself.
4). Analysis of lost customers, these methods do companies by calling back customers who had long visit or purchase again in the company because it has been moved to a competitor. In addition, the company may ask causes the migration of customers to a competitor. The creation of customer satisfaction can provide several benefits, including the relationship between businesses and customers so harmonious, provide a good foundation for the repurchase and the creation of customer loyalty and establish a recommendation by word of mouth that is profitable for the company, the company's reputation to be good in the eyes of the customer, and income earned to be increased.
Relations Service Quality, Corporate Image, Satisfaction and Customer Loyalty.
©
Center for Promoting Education and Research
www.cpernet.org
face more alternative products, prices and quality vary so that customers will always seek the most highly regarded value of some products (Kotler, 2001). Low quality will cause dissatisfaction in customers, not just the customers who eat at the restaurant but also have an impact on others. Because of disappointed customers will tell at least to the 15 others. Impact, will cast their potential customers to competitors (Lupiyoadi and Hamdani, 2006). Efforts to improve the system of quality of service will be much more effective for business continuity. According to the research results of the Wharton Business School, this improvement effort will make consumers more loyal to the company (Lupiyoadi and Hamdani,2006). The concept of quality of service, satisfaction, and loyalty are interconnected with one another.
Relations of Corporate Image and Customer Loyalty.
The corporate image of Informa rated by consumers. This is evident from the direct effect of a given quality of service to customer satisfaction has included strong. Quality of service can be used as one way to increase customer satisfaction at Informa. Consumer satisfaction is an evaluation by comparing post-purchase customer expectations with the fact that it receives. To always keep customer satisfaction at Informa then the product must be able to know things the expectations of consumers. Good quality products could increase the reputation of the brand. This is one key to the success of a product which has a brand. A good brand reputation will automatically be in the minds of consumers. It will bring a positive impact on rising long-term profit for Informa. Customer satisfaction will enhance the brand's reputation in a positive way. Consumers who are satisfied will conduct several activities such as recommending the product to their relatives, friends or other audiences. This is the direct impact that can be felt if the customer is satisfied. Improved brand reputation is expected to take place on an ongoing basis, should maintain and improve consumer satisfaction. The image of a good shop can directly increase customer satisfaction, but on the other hand, a good quality product can also increase the brand's reputation after the consumer satisfied. This is a logical consequence when consumers are satisfied because the use of products with good quality will do recommendation.
Relationship Customer Satisfaction and Customer Loyalty
According to Swastha (2009), the definition of customer loyalty is the loyalty of consumers to continue to use the same product from a company. Loyalty describes the expected behavior with respect to products or services. Customer loyalty will be higher if a product is considered able to provide the highest satisfaction so that customers are reluctant to switch to another brand. The characteristics of loyal customers for goods or services according to Griffin (2002) are as follows: (a) make repeat purchases on a regular basis; (B) between the lines to buy products or services; (C) refer to others; (D) shows the attractiveness immunity from similar products of competitors.
Some of the factors that influence consumer loyalty by Dharmamesta (1999) is the quality of products and promotions. Consumers who obtain satisfaction on the product bought tend to re-purchase the same product. One important factor that can make the customer satisfied is quality. It can be used by marketers to develop brand loyalty from consumers. Marketing with less or no attention to the quality of the products offered will bear the risk of not loyal consumers. If marketing is very concerned about the quality, even reinforced by intensive advertising, customer loyalty to the brand offer will be more easily obtained.
Quality and advertising was a key factor in creating long-term brand loyalty. Some research suggests that consumers will become loyal to the brand of high quality if the products are offered at reasonable prices. The product quality is a value of a product or service, where the value of the products or services in accordance with what is expected or exceed what is expected so that the product or service can meet the needs of the wearer (Kotler and Armstrong, 2001).
©
Center for Promoting Education and Research
www.cpernet.org
company and its products to be willing to accept, buy and loyal to the products offered by the company concerned (Tjiptono, 2004). Several types of promotions are often referred to as the promotion mix by Swastha (2009) are (A) advertising; (B) sales promotion; (C) personal selling; and (D) public relations. More simply, Shimp (2000), classifies advertising purposes, namely: (A) informing (giving information); (B) persuasion (persuade / coax); (C) reminding ; (D) adding value and (E) assisting other measures of the company.
In addition, according to Mardalis (2005), there are also other factors that affect customer loyalty, namely customer satisfaction, service quality, and image. Customer satisfaction as feeling like it or not a person to a product after comparing the performance of the product with expectations. Customer satisfaction as a positive response to the evaluation of the experience of using a product or a suit. One important factor that can make customers satisfied is the quality of services. Marketers can improve the quality of services to develop customer loyalty. Products that have a low quality of the customer will bear the risk of being unfaithful. If the quality of attention and reinforced by advertising, customer loyalty will be more easily obtained even can increase consumer loyalty.
Research Methods Research Design
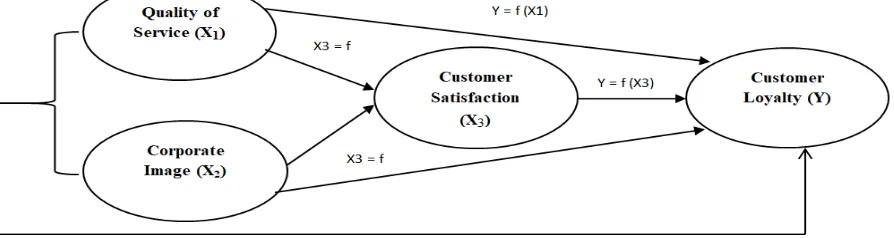
The approach in this study using an explanatory analysis. Each of the variables presented in the hypothesis will be observed by testing the causal relationship of independent variables on the dependent variable. That phenomenon can be designed through the following mathematical functions:
1. Model one, the influence of X1 (quality of service) and X2 (corporate image) to variable Y (customer loyalty) can be formulated with Y= F (X1, X2). Assuming probability predictor variables are the same
(
P#0,000)
/ 0,052. Two models, the effect of X1 (quality of service) to Y (customer loyalty) can be formulated with: Y= F (X1). Assuming probability is not the same predictor variables
(
P#0,000)
/ 0,053. Three models, the partial effect of variable X2 (corporate image) to Y (customer loyalty) can be formulated with:Y= F (X2). Assuming probability is not the same predictor variables
(
P#0,000)
/ 0,054. Four models, the partial effect between X3 (customer satisfaction) to Y (customer loyalty) can be formulated by Y = f (X3). Assuming probability is not the same predictor variables
(
P#0,000)
/ 0,055. Five models, the effect of X1 (quality of service) to Y (customer loyalty) through X3 (customer satisfaction) can be formulated with: X3 = f (X1) Y = f (X3)
6. Six models, the partial effect of variable X2 (corporate image) to Y (customer loyalty) through X3 (customer satisfaction) can be formulated with: X3 = f (X2) Y = f (X3). Assuming probability is not the same predictor variables
(
P#0,000)
/0,05In more simple The test chart design presented in the display an association between variables can be depicted in diagrammatic form of path analysis (path analysis) as follows:
©
Center for Promoting Education and Research
www.cpernet.org
Object of Research
The study was conducted in PT. Home Center Indonesia with innovative furnishing Informa brand, a company engaged in the retail furniture business.
Population and Sample Research
Population and sample a collection of individuals with the qualities and characteristics which have been set. According to Sugiyono (2006: 72) population is a generalization region consisting of objects or subjects that have certain qualities and characteristics defined by the researchers to learn and then draw conclusions. In this study population was all the visitors who visit the Informa. The sample in this study is a non-probability sample, in which an unknown number of the population that is a fraction of visitors who shop at Informa Metropolitan Mall Bekasi. A number of members of the sample or the sample size set 100 in consideration of the theory that suggested a sample size of between 100 and 200 and the absolute minimum of 50 (Hair in Wicaksana, 2007).
The sampling technique, the sampling technique is a research effort to obtain samples that can describe the population. The samples in this study using techniques accidental sampling. Accidental sampling is anyone who happened to meet with researchers (obtained easily) and the next stage is when the respondent was suitable as a data source with a certain consideration questionnaire addressed to the respondents who visited the mall Informa Metropolitan Mall Bekasi. Consideration used in selecting respondents is on the basis that the respondents in this study are the Informa visitors who've visited at least three times.
Research Design
This research included in the category of associative research conducted to determine the causal relationship between two or more variables. In this study will be analyzed the causal relationship between service quality and corporate image on customer satisfaction and customer loyalty Informa. This research was conducted through a survey data collection using a list of questions to customers Informa. Used data analysis is path analysis.
Research Variable
Based on the subject matter and hypothesis, variable variables in this analysis can be identified broadly into two: exogenous and endogenous variables. For exogenous and endogenous variables in this study often known as latent variables, so that the fund would be used the term latent variables da exogenous and endogenous. The exogenous latent variable quality of service (X1) and corporate image (X2), whereas endogenous latent variables namely customer satisfaction (X3) and customer loyalty (Y).
Types And Sources In Data Collection Methods
The type of data in this study is the data subject and data documentation. Data subjects is a type of data used in the research is a respondent opinion who is the subject of research. Data documentaries are the type of data used in this study is in the form of the results of previous research results were published in the research journal and the annual report of PT. Home Center Indonesia (Informa). To obtain a concrete data and objective it must be conducted research on the problems examined, while the steps that researchers take in data collection is data primer, data obtained directly from the research object, In this case, primary data obtained from field research is the method of collection do with research data directly on the object of study in question.
Results and Discussion
1. Effect of Quality of Service and Corporate Image on Customer Loyalty
Linear analysis model can be based on calculations using SPSS program as follows. Table 2. Results of the analysis of the first equation
Coefficientsa
Model Coefficients Unstandardized Standardized
Coefficients
t Sig.
B Std. Error beta
1
(Constant) -3.774 1,737 -2.172 , 032
Quality Service , 411 , 116 , 439 3.553 .001
Corporate Image , 682 , 173 , 487 3.938 , 000
©
Center for Promoting Education and Research
www.cpernet.org
F count can be obtained from the following table:
Table 3. Calculate the F value equations simultaneously ANOVAa
Model Sum of Squares df mean Square F Sig.
1
Regression 2001.617 2 1000.808 239.332 , 000b
Residual 405.623 97 4.182
Total 2407.240 99
a. Dependent Variable: Customer Loyalty
b. Predictors: (Constant), Corporate Image, Quality Service
Based on the above table it is known that the value of F count equal to 239.332 and significance of 0.000 This value is less than 0.05. This means that the variable quality of service and corporate image effect on customer loyalty simultaneously. The magnitude of the effect of the independent variable on the dependent variable can be seen from the following values of r squared.
Table 4. Values r squared regression model first
Based on the above table it is known that the value of r squared of 82.8% means that the variable quality of service and corporate image influence on customer loyalty by 82.8% while the rest influenced by other variables that are not incorporated into the model equations.
2.Analysis of the influence of Quality of Service to Customer Loyalty partially.
The results of the analysis of the effect of service quality on customer loyalty can be partially seen in the following table.
Table 5. Regression Analysis Results Second Equation Coefficientsa
Model Coefficients Unstandardized Standardized Coefficients
t Sig.
B Std. Error beta
1 (Constant) -5.128 1,825 -2.810 , 006
Quality Service , 839 , 042 , 897 20.085 , 000 a. Dependent Variable: Customer Loyalty
Based on the chart above analysis it is known that the coefficient of quality of service by 0.897. T value of 20.805. The significant value of 0.00. The significance value smaller than 0.05. This means that the variable quality of service affects the loyalty of partial services. The magnitude of the effect of service quality on customer loyalty can be seen in the following table.
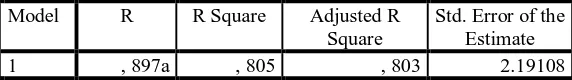
Table 6. Value Quadratic Equations Second r Model Summary
Model R R Square Adjusted R Square
Std. Error of the Estimate
1 , 897a , 805 , 803 2.19108
a. Predictors: (Constant), Quality Service
Model Summary
Model R R Square Adjusted R Square Std. Error of the Estimate
1 , 912a , 831 , 828 2.04492
©
Center for Promoting Education and Research
www.cpernet.org
Based on the above table it can be seen r squared value of 0.805. This means that the influence of the variables of service quality on customer loyalty by 80.5% and the rest influenced by other variables not included in the model equations.
3 Analysis of the influence of Corporate Image on Customer Loyalty partially.
The analysis results of corporate image on customer loyalty can be partially seen in the following table: Table 7. Results of Analysis of the Third Regression Equations
Coefficientsa
Model Coefficients Unstandardized Standardized Coefficients
t Sig.
B Std. Error beta
1 (Constant) -, 597 1,576 -, 379 , 705
Corporate image 1,261 , 062 900 20.411 , 000 a. Dependent Variable: Customer Loyalty
Based on the chart above analysis it is known that the ccorporate image coefficient of 0,900. T value of 20.411. The significant value of 0.00. The significance value smaller than 0.05. This means that the ccorporate image variables affect customer loyalty partially. The magnitude of the influence of corporate image on customer loyalty can be seen in the following table.
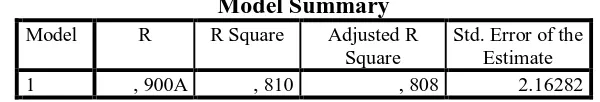
Table 8. Rated R Squares third equation Model Summary
Model R R Square Adjusted R Square
Std. Error of the Estimate
1 , 900A , 810 , 808 2.16282
a. Predictors: (Constant), Corporate Image
Based on the above table it can be seen r squared value of 0.810. This means that the effect of variable corporate image on customer loyalty by 81% and the rest influenced by other variables not included in the model equations.
4 Analysis of the influence of Customer Satisfaction on Customer Loyalty partially
The analysis results of customer satisfaction to customer loyalty partially can be seen in the following table. Table 9. Results of regression equation analysis Fourth
Coefficientsa
Model Coefficients
Unstandardized
Standardized Coefficients
t Sig.
B Std. Error beta
1 (Constant) -4.469 1,587 -2.815 , 006
Customer Satisfaction 1,407 , 062 , 917 22.687 , 000 a. Dependent Variable: Customer Loyalty
Based on the chart above analysis in mind that customer loyalty coefficient of 0.917. T value of 22.687. The significant value of 0.00. The significance value smaller than 0.05. This means that variables affect customer satisfaction to customer loyalty partially. The magnitude of the effect of customer satisfaction on customer loyalty can be seen in the following table.
Table 10. r Value Quadratic Equations Fourth Model Summary
Model R R Square Adjusted R Square
Std. Error of the Estimate
1 , 917a , 840 , 838 1.98215
©
Center for Promoting Education and Research
www.cpernet.org
Based on the above table it can be seen r squared value of 0.917. This means that the effect of variable corporate image on customer loyalty by 91.7% and the rest influenced by other variables not included in the model equations.
5.Analysis of Effect of Quality of Service to Customer Loyalty through Customer Satisfaction variables
Based on the partial path analysis above, it can be described as follows. The analysis is an analysis on line with the structure of this sub-image.
Figure 2. Analysis of the influence lines X1 to Y via X3
The coefficient influence on the service quality to customer satisfaction can be seen in the following table Table 11. Effect of Service Quality on Customer Satisfaction
Coefficientsa
Model Coefficients Unstandardized Standardized Coefficients
t Sig.
B Std. Error beta
1 (Constant) 2,617 , 414 6.318 , 000
Quality Service , 317 , 094 , 324 3.385 .001 a. Dependent Variable: Customer Satisfaction
Based on the picture above can be seen that the influence of service quality on customer loyalty is 0.897. The influence of service quality on customer loyalty through customer satisfaction is 0.324 x 0.917 = 0.297. In this case, the indirect effect is greater than the direct effect so that it can be said that the variables of customer satisfaction as an intervening variable.
6.Analysis of Effect of Corporate Image on Customer Loyalty through Customer Satisfaction variables.
Based on the partial path analysis above, it can be described as follows. The analysis is an analysis on line with the structure of this sub-image.
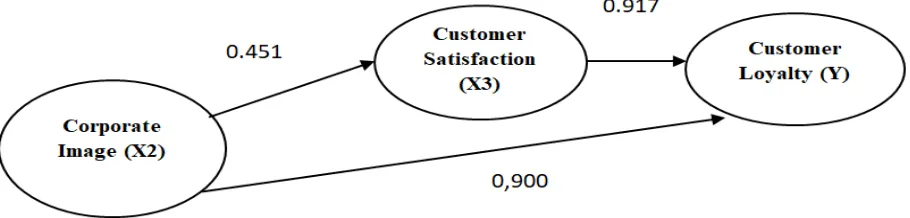
Figure 3. Analysis of the influence lines X2 to Y via X3
©
Center for Promoting Education and Research
www.cpernet.org
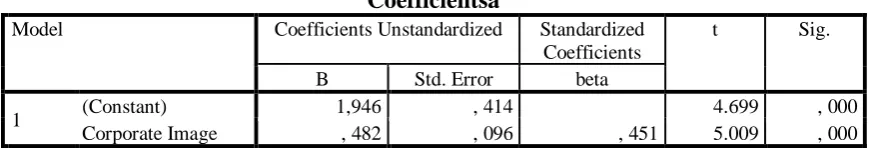
Table 12. Coefficient of influence of Corporate Image on Customer Satisfaction Coefficientsa
Model Coefficients Unstandardized Standardized Coefficients
t Sig.
B Std. Error beta
1 (Constant) 1,946 , 414 4.699 , 000
Corporate Image , 482 , 096 , 451 5.009 , 000 a. Dependent Variable: Customer Satisfaction
Based on the picture above can be seen that the direct influence of corporate image on customer satisfaction is 0.451. While the influence of corporate image on customer loyalty through customer satisfaction is 0.451 x 0.917 = 0.413. In this case, the direct influence smaller than indirect influence so we can say that the variables of customer satisfaction as an intervening variable.
CONCLUSIONS AND SUGGESTION Conclusion
Variable quality of service and corporate image influence on customer loyalty simultaneously. F value calculated at 239.332 and significance of 0.00. This value is less than 0.05. R squared value of 82.8% means that the variable quality of service and corporate image influence on customer loyalty by 82.8% while the rest influenced by other variables that are not incorporated into the model equations.
Variables affect service quality on customer loyalty partially. T value of 20.085. The significant value of 0.00. The significance value smaller than 0.05. R squared value of 0.805. This means that the influence of the variables of service quality on customer loyalty by 80.5% and the rest influenced by other variables not included in the model equations.
Variables affect the corporate image on customer loyalty partially. T value of 20.441. The significant value of 0.00. The significance value smaller than 0.05. R squared value of 0.810. This means that the effect of variable corporate image on customer loyalty by 81% and the rest influenced by other variables not included in the model equations.
Variables affect customer satisfaction to customer loyalty partially. T value of 22.687. The significant value of 0.00. The significance value smaller than 0.05. R squared value of 0.840. This means that the effect of variable corporate image on customer loyalty by 84% and the rest influenced by other variables not included in the model equations.
The direct effect of service quality on customer loyalty is 0.897. The influence of service quality on customer loyalty through customer satisfaction is 0.324 x 0.917 = 0.297. In this case, the indirect effect is greater than the direct effect so that it can be said that the variables of customer satisfaction as an intervening variable.
The direct effect of corporate image on customer loyalty is 0,0,541. While the influence of corporate image on customer loyalty through customer satisfaction is 0.541 x 0.917 = 0.496. In this case, the direct influence smaller than indirect influence so we can say that the variables of the ccorporate image as an intervening variable.
Suggestion
Based on the results of research can be submitted several suggestions, as follows:
1. For the development of science, it should be considered that the results of this research can be developed further, especially in the development of science in general marketing management and customer loyalty in particular with regard to the variables studied.
©
Center for Promoting Education and Research
www.cpernet.org
variables that have not been examined in this study, such as relationship and loyalty and reviewing indicators have not been studied in this research, among others:
a. Handling customer objections, like reservations about the lateness of delivery and installation (form). b. Prices, like the last price paid and the expected future price.
c. Customer satisfaction and customer service (shopping journey).
3. For policy makers
a. Companies need to be considered through continuous improvement, especially with regard to features that give the lowest contribution to the quality of the service, ie responsiveness to faster service to customers when transactions in the cashier, so that satisfaction is achieved.
b. Companies need to be considered through continuous improvement, especially with regard to the layout of the storage facility that provides the lowest contribution to the image of the company, ie through changes to plan an inspiring display at regular intervals, so that customer satisfaction is met.
References
A. Shimp, Terence. (2000). Periklanan Promosi: Aspek Tambahan Komunikasi Pemasaran Terpadu, edisi ke-5. Jakarta: Erlangga.
Adona, Fitri. (2006). Citra dan Kekerasan Simbolik dalam Iklan Perusahaan di Televisi. Padang: Andalas University Press.
Ahmad Mardalis. (2005). Meraih Loyalitas Pelanggan. Jakarta : Balai Pustaka.
Assael, Henry. (2002). Consumers Behavior and Marketing Action. Edisi 3. Kent Publishing Company. Boston Massachusset. AS.
Basu Swastha.(2009). Manajemen Penjualan. Yogyakarta: BPFE.
Bloemer, J.M.M. and Ruyter, de.K . (2008), The impact of attitude strength on the acceptance of green services. Journal of Retailing and Consumer Services, p. 45-52.
Caruana, A. (2002). Service Loyalty The Effects of Service Quality and The Mediating Role of Customer Satisfaction. European Journal of Marketing, 36.
Dharmmesta, Bashu, Swastha. (1999). “Loyalitas Pelanggan: Sebuah Kajian Konseptual Sebagai Panduan Bagi Peneliti”, Jurnal Ekonomi dan Bisnis Indonesia, Vol. 14, No.3.
Engel, James F, et al. (1990) Customer Behavior. Diterjemahkan oleh: F X Budiyanto. Perilaku Konsumen, Jilid II. Binarupa Aksara, Jakarta.
Fandy, Tjiptono. (2004). Manajemen Jasa, Edisi Pertama, Yogyakarta, Andi Offset.
Gilbert, G.R. et.al. (2004), Measuring Customer Satisfaction in The Fast Food Industry: A cross-national Approach. The Journal ofServices Marketing, halaman 18.
Griffin, Jill. (2002). dialih bahasakan oleh Dwi Kartini Yahya. 2002 “Customer Loyalty How to Earn it, How to Keep it, Lexington Books.
Husein, Umar. (2000). Riset Pemasaran Dan Penilaian Konsumen. Jakarta: PT Gramedia Pustaka.
Julita, (2000), Menuju Kepuasan Pelanggan Melalui Penciptaan Kualitas Pelayanan, Jurnal Ilmiah Manajemen dan Bisnis Program Studi Manajemen, Fakultas Ekonomi Universitas Muhammadiyah SumatraUtara. Volume 01 No 01 Oktober 2001.
Kotler, Philip dan Gary Armstrong, (2001), Prinsip-prinsip Pemasaran, Jilid 1, Edisi Kedelapan, Jakarta, Erlangga. Kotler, Philip. (2001). Manajemen Pemasaran: Analisis, Perencanaan, Implementasi dan Kontrol. Jakarta: PT.
©
Center for Promoting Education and Research
www.cpernet.org
Lupiyoadi, Rambat dan A. Hamdani. (2006). Manajemen Pemasaran Jasa. Jakarta: Salemba Empat.
Oliver, Richard L. (1980), ”A Cognitive Model of the Antecedents and Consequences of Satisfaction Decisions,” Journal of Marketing Research, Vol. 17, No. 4, pp. 460-469.
Parasuraman, A., Berry, L.L., and Zeithaml, A.V., (1988), “SERVQUAL: A Multiple Item Scale for Measuring Consumer Perceptions of Service Quality”, Journal of Retailing, Vol. 64, No. 1, Spring, 12-40.
Rangkuti, Freddy (2002), Measuring Customer Satisfaction, Penerbit PT Gramedia Pustaka Utama, Jakarta.
Schroeder, Roger G. (2003). 2nd Edition. Operations Management: Contemporary Concepts and Cases. McGraw-Hill International Edition.
Soemirat, Sholeh dan Elvinaro. (2003). Dasar-Dasar Public Relations, Bandung: PT Remaja Rosdakarya. Sugiyono. (2006). Metode Penelitian Kuantitatif, Kualitatif dan R & D.Bandung:Alfabeta
Tse dan Wilton (1988). Kepuasan Pelanggan, jilid 2. Edisi ketiga. Klaten : PT. Indeks Kelompok Gramedia.
Wicaksono. (2007). Strategi Pembelajaran Matematika Sekolah Alternatif Qarriyah Thayibah Kalibening Salatiga. Surakarta: Skripsi FKIP UMS.
Wilkie, W.L (1990), “Consumer Behavior”, 2nd ed., John Wiley & Sons. New York.
Yan Lu and Seock, Y. (2008). “The Influence of Grey Consumers’ Service Quality Perception on Satisfaction and Store Loyalty Behavior”. International Journal of Retail & Distribution Management. Vol. 36 No. 11, 2008 pp. 901-918. DOI 10.1108/09590550810911674.