ISSN (e): 2250-3021, ISSN (p): 2278-8719
Vol. 04, Issue 09 (September. 2014), ||V1|| PP 33-43
Investigating the Effects of some Geotechnical Properties on
Exploitation of some selected Laterite Deposits in South West,
Nigeria
Olaoye, J.O., Olaleye, B.M. and Saliu, M.A.
Department of Mining Engineering, The Federal University of Technology, Akure, Nigeria
Abstract: - Investigation was carried out on the slope stability of lateritic soil due to effects of some geotechnical properties in selected burrow pits in Akure, Ibadan, Ewekoro and Iperu areas, south western, Nigeria. The geotechnical properties were determined in accordance with American Society for Testing and Materials (ASTM) Standards. The conventional slope stability analysis was based on the linear Mohr – Coulomb failure criterion utilizing the notion of safety factors with respect to shear strength, where their average results of cohesion, angle of friction, bulk density and moisture content from the locations are 82 kPa, 18 degree, 1700 kg/m3, and 22 % respectively. The average specific gravity for locations was 2.73. The degree of permeability was very low except for location 6 in Ibadan area which is medium. The grain size distribution for the locations was classified into SC – SM (silt clayey sand). From compaction test, average moisture content, average wet density and dry density for the locations are 23 %, 1849 kg/m3 and 1512 kg/m3 respectively while the average compaction curve deduced 24 % optimum moisture contents and 1639 kg/m3maximum dry density. The Atterberg limits test results indicate that locations 1 – 5 were recorded as plastic soil while location 6 non-plastic soil. Also, the linear shrinkage degree of expansion for location 1 – 5 indicates critical while location 6 indicates non-critical. Finally, statistical mathematical model equations were developed. The factor of safety for locations 1 – 5 was satisfactory for routine extraction and loading operations while location 6 was unsafe due to loading conditions of the terrain.
Keyword: - Laterite, Geotechnical properties, Slope stability, Factor of safety, and Mathematical model.
I. INTRODUCTION
Originally, utilization of lateritic soil was only discussed in connection with mining of solid mineral deposits such as Iron ore, Aluminium oxide, Bauxite, and Manganese (Maigien, 1966). Later, the civil engineering aspect mostly in connection with road pavements, dams, embankments, buildings became the subject of numerous studies. Considering the vast areas and abundance of lateritic soil in the tropics and the present use of the soil, it is apparent that the diverse engineering potential of this soil is utilized only to a very small extent. Among the numerous questions that must be answered in order to utilize this soil to the full extent of its potentials are mainly directly related to the strength properties.
Lateritic soils are weathered under conditions of high temperatures and humidity with well-defined alternating wet and dry seasons and continually leached by rainwater causing a tendency for deterioration of its strength characteristics. The structural elements in the soils are often a less stable coarse grained aggregation of variable strength which may break down in performance. Furthermore, their varying silt and clay contents often render them moisture sensitive (Maigien, 1966; and Ola, 1978). The aforementioned properties give indication of their limitations in engineering applications or at best are restricted to minor engineering projects.
Lateritic soils are the product of intensive weathering that occurs under tropical and subtropical climatic condition resulting in the accumulation of hydrated iron and aluminium oxides (Gidigasu, 1972). These soils are found in dry flat lands and plains in south west, Nigeria. The susceptibility of a slope to failure is dependent on many factors including cohesion and internal friction of the laterite soil (Yalcin, 2007).
The work is concerned with the seasonal conditions of laterite deposit due to some geotechnical properties as it affects the stability of the slope. The influence of essential laterite deposit geotechnical variables: cohesion, unit weight, friction angle, and bench height on the factor of safety helps to provides information for selection of earth moving machinery and proper planning and design. The results of the investigation will be very useful and serve as a database for artisanal miners and managers of construction industries.
II. STUDY AREA
N and 003° 40'11'' E) and Ewekoro (06° 56' 43'' N and 003° 12' 09'' E); and Oyo State locations coordinates: Odo-Ona Elewe (07° 19' 23'' N and 003° 52' 24'' E) and Toll gate (07° 19' 11'' N and 003° 52' 31'' E). Figure 1 presents Geological Map of Nigeria showing study areas.
Figure 1. Geological Map of Nigeria showing Study Areas (Source: Adapted from Olaleye and Jegede, 2008).
III. MATERIALS AND METHODS
3.1 Sample Collection
Laterite samples were obtained randomly from six different locations at the study areas. These samples were prepared and tested in laboratory for specific gravity, permeability, grain size distribution with hydrometer test, compaction test, triaxial compressive strength, Atterberg limits test, and linear shrinkage.
3.2 Geotechnical Properties of Laterite Soil 3.2.1 Determination of Specific Gravity
The specific gravity of soil was determined using a pycnometer (jar) according to ASTM (2002) D 854-00 and was calculated using Equation 1;
4 1
3 2
1 2
M M M M
M M GS
(1)
Where:M1 is the weight of empty pycnometer (g); M2 is the weight of pycnometer and oven dry soil (g);M3 is the weight of pycnometer filled with water and soil (g); and M4 is the weight of pycnometer filled with water (g).
3.2.2 Determination of Permeability
The permeability (hydraulic conductivity) on laterite soil was determined with the use of falling head test method according to ASTM (2012) D 2434. The falling head test was mainly used for less permeable soils (k < 10-4 cm/s).The permeability was calculated using Equation 2;
Ath
QL
KT
(2) Where:KT is the coefficient of permeability at temperature (T), cm/sec; L is the length of specimen in centimetres;t is the time for discharge in seconds;Q is the volume of discharge in cm3 (assume 1 ml = 1 cm3); A is the cross-sectional area of permeameter(𝐴 =𝜋𝑇
4 𝐷
2,D is the inside diameter of the permeameter); andh is the
The viscosity of the water changes with temperature. As temperature increases viscosity decreases and the permeability increases. The coefficient of permeability was standardized at 20 °C, and the permeability at any temperature T was related to K20 by the ratio using Equation 3;
20 20
T TK
K
(3)Where:ηT and η20 are the viscosities at the temperature T of the test and at 200C, respectively. The volume of soil (V) was computed using Equation 4;
V = LA (4)
Where:
L is the length of specimen in centimetres; andA is the cross-sectional area of permeameter (𝐴 =𝜋𝑇
4 𝐷
2); and D is the inside diameter of the permeameter).
3.2.3 Determination of Grain Size Distribution
This test was performed according to ASTM (2007a) D 422 – 63 standards to determine the percentage of different grain sizes contained within a soil. The quantity passing, percentage retained, and percentage passing was calculated using Equations 5 - 7;
Weight passing = [Total weight (g) – Weight retained (g)] (5)
) ( ) ( % g weight Total g retained Weight
retained (6)
% passing = 100 – % retained (7)
3.2.3.1 Determination of Laterite Sediment
The hydrometer method was used to determine the distribution of the finer particles. The fine soil was taken from the bottom pan of the sieve set, placed into a beaker, and 125 ml of the dispersing agent (sodium hexametaphosphate (40 g/l)) solution was added. Meniscus correction was applied to the actual hydrometer reading. The equivalent particle diameter was calculated using Equation 8;
t
L
K
D
(8) Where: D is the equivalent particle diameter (mm): t is the elapse time (in minutes); K is the specific gravity constant; and L is the effective hydrometer depth (cm).
The corrected hydrometer reading was calculated using Equation 9;
RC = Ra - Zero Correction + CT (9) Where:RC is the corrected hydrometer readings; Ra is the actual corrected hydrometer reading; and
CT is the temperature correction.
The percent finer (P) was calculated using Equation 10;
100
S CW
a
R
P
(10) Where: WS is the weight of the soil sample in grams.The adjusted percent fines calculated using Equation 11;
100
200F
P
P
A
(11) Where:F200 = % finer of No. 200 sieve as a percent.The grain size curve was plotted on a semi-logarithmic sheet3.2.4 Compaction Test
This laboratory procedure employed the tamping compaction method using the type of equipment and methodology developed by Proctor (1933) and tested according to ASTM (2007b) D 698.The amount of initial water to be addedwas computed using Equation 12.
100
8
)
(
m addS
W
(12)Where: Wadd is the water to add (ml); and Sm is the soil mass (grams.)
w
d
1
(13)Where: w is the moisture content in percent divided by 100; and ρ is the wet density in grams per cm3 .
100
1
s d w satG
W
(14) Where:ρd is the dry density of soil grams per cm3;Gs is the specific gravity of the soil being tested (assume 2.70 if not given);Ρw is the density of water in grams per cm3 (approximately 1 g/cm3); andWsat is the moisture content in percentage for complete saturation.3.2.5 Determination of Triaxial Compression Strength
This test method covered determination of the strength and stress-strain relationships of a cylindrical specimen of either undisturbed or remolded cohesive soil in accordance with ASTM (2003a).
The axial strain, ɛ (expressed as a decimal), for a given applied axial load, using Equation 15;
O
H
H
(15)Where:Δ H is change in height of specimen as read from deformation indicator (m); and H0 is the height of test specimen minus any change in length prior to loading (m).
The average cross-sectional area, A, for a given applied axial load was calculated using Equation 16;
1
0A
A
(16)Where:A0 is the initial average cross-sectional area of the specimen (m); andɛ is the axial strain for the given axial load (expressed as a decimal), (%).
The principal stress difference (deviator stress), 𝜎1 – 𝜎3, for a given applied axial load was calculated using Equation 17;
A
P
3 1
(17)Where: P is the measured applied axial load (corrected for uplift and piston friction, if required), (kPa); andA is the corresponding average cross-sectional area (m).
Correction for rubber membrane assuming units are consistent was computed using Equations 18.
D
t
E
m m 13 1
4
(18) Where:Δ (𝜎1 – 𝜎3) is the correction to be subtracted from the measured principal stress difference (kPa); D is the
A
4
diameter of specimen (m);Em is the Young’s modulus for the membrane material;tm is the thickness of the membrane (m); and ɛ1 is the axial strain (%).The Young’s modulus of the membrane material was determined hanging a 10.0 mm wide strip of membrane over a thin rod, placing another rod along the bottom of the hanging membrane, and measuring the force per unit strain obtained by stretching the membrane. The modulus value was computed using Equation 19 assuming units are consistent;
L
A
FL
E
m m
(19)Where:Em is the Young’s modulus for the membrane material;F is the force applied to stretch the membrane;Amis twice the initial thickness of the membrane multiplied by the width of the membrane strip;L is the un-stretched length of the membrane; andΔL is the change in length of the membrane due to application of F.
3.2.6 Determination of Atterberg Limits
These test methods covered the determination of the liquid limit, plastic limit, and the plasticity index of soils as stipulated by ASTM standards.
3.2.6.1 Determination of Liquid Limit
121 . 0
25
W
N
LL
n n(20)
Where:LLn is the one point limit for given trial, %; N is the number of blows causing closure of the groove for given trial; andWn is the water content for given trial, %.
3.2.6.2 Determination of Plastic Limit
The water content of the soil samplecontained in the container was determined in accordance with Test Method ASTM (2003b) D 2216.The average of the two water contents (trial plastic limits) was computed and rounded to the nearest whole number. This value was the plastic limit, PL.
3.2.6.3 Determination of Plasticity Index
The plasticity index (Pl) wascalculated by subtracting plastic limit from liquid limit.
PL
LL
Pl
(21)Where:LL is the liquid limit (whole number); andPL is the plastic limit (whole number).
3.2.7 Determination of Linear Shrinkage
This linear shrinkage of soil samples was determined in according with ASTM (2002) D 854 – 00 standards procedure.The linear shrinkage (LS) was calculated using Equation 22;
100
1
o fL
L
LS
(22) Where:Lf is the final length in mm; and Lo is the original length in mm.3.3 Slope Stability
The factor of safety of the deposit based on circular failure and limit equilibrium analysis was defined using Equation 23;
tan
c
FS
(23)Where: c is the cohesion (kPa); τ is the total shear (kPa); ϕ is the friction angle; and σ is the total shear stress. The dimensionless ratio was determined using Equation 24 guided by steps on circular failure chart. (Wyllie and Mah, 2004)
H
tan
c
FS
(24)Where: FS is the factor of safety; γ is the unit weight (kN/m3); H is the bench height (m);and c is the cohesion (kPa).
The corresponding values on both vertical and horizontal axes were used to determine factor of safety as presented in Equation 25 – 26;
FS ratio ess
Dimensionl tan
(25)and
H FS
c ratio ess Dimensionl
(26)IV. RESULTS AND DISCUSSION
4.1 Specific Gravity
The specific gravity results of the samples from the six locations are presented in Tables 1. Table 1. Specific Gravity Results
Location Specific Gravity (Average) Location 1 2.772
The studied laterite soil samples from the six locations have their average specific gravity ranged from 2.671 to 2.772. The specific gravity was carried out using water pycnometer according to ASTM (2002) D 854-00 standards.
4.2 Analysis of Permeability
The permeability results of the samples from the six locations are presented in Tables 2.
Table 2. Permeability Results
Measurement Loc. 1 Loc. 2 Loc. 3 Loc. 4 Loc. 5 Loc. 6 Temperature (0C) 28 28 28 28 28 28 Constant hydraulic head (h), cm 80 80 80 80 80 80 Discharge time (t), sec 35034 51360 3960 5940 57960 60 Specimen length (L), cm 11.2 11.2 11.2 11.2 11.2 11.2 Discharge volume (Q), cm3 4.41 4.41 4.41 4.41 4.41 35.31 Cross-sectional area (A), cm2 81.75 81.75 81.75 81.75 81.75 81.75 Average permeability, KT (at
working temp.), cm/sec
2.16×10⁸ 1.47×10⁸ 1.91×10⁷ 1.27×10⁷ 1.30×10⁸ 1.008×10³
Average permeability, K20 (at 200C), cm/sec
1.79×10⁸ 1.22×10⁸ 1.59×10⁷ 1.06×10⁷ 1.08×10⁸ 8.38×10⁴
The studied laterite soil samples from the six locations was analysed to determine the ease with which water could flow through the soil. The permeability (or hydraulic conductivity) was carried out using falling head test method due to the laterite soil been less permeable according to ASTM (2012) D 2434 standards. The degree of permeability for locations 1 to 5 was very low while location 6 was medium according to engineering testing procedure proposed by Lambe(1951). Permeability properties became necessary in civil works for the determination of seepage through earth dams or under sheet pile walls, seepage rate from waste storage facilities (landfills, pond, etc.), and rate of settlement of clayey soil deposit (borrow pit).
4.3 Analysis of Grain Size and Laterite Sediment
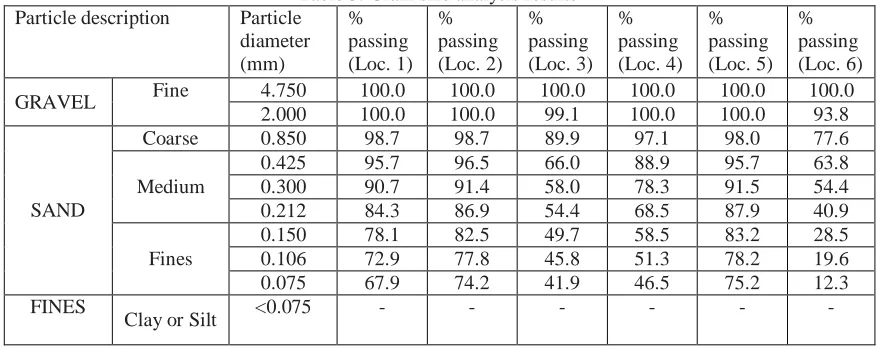
The grain size analysis results of the samples from the six locations are presented in Tables 3. Table 3. Grain size analysis results
Particle description Particle diameter (mm)
% passing (Loc. 1)
% passing (Loc. 2)
% passing (Loc. 3)
% passing (Loc. 4)
% passing (Loc. 5)
% passing (Loc. 6)
GRAVEL Fine 4.750 100.0 100.0 100.0 100.0 100.0 100.0 2.000 100.0 100.0 99.1 100.0 100.0 93.8
SAND
Coarse 0.850 98.7 98.7 89.9 97.1 98.0 77.6
Medium
0.425 95.7 96.5 66.0 88.9 95.7 63.8 0.300 90.7 91.4 58.0 78.3 91.5 54.4 0.212 84.3 86.9 54.4 68.5 87.9 40.9
Fines
0.150 78.1 82.5 49.7 58.5 83.2 28.5 0.106 72.9 77.8 45.8 51.3 78.2 19.6 0.075 67.9 74.2 41.9 46.5 75.2 12.3 FINES
Clay or Silt <0.075 - - - -
The test was performed to determine the percentage of different grain sizes contained within the laterite soil while hydrometer method was used to determine the distribution of the finer particles according to ASTM (2007a) D 422 - 63 standards. The percentage of silt in the laterite samples is low while location 6 has no silt and clay content. Itwas concluded that the laterite soil class for the six locations was SC-SM (silt clayey sand) according to unified classification of soil sample. The distribution of different grain sizes affects the engineering properties of laterite soil.
4.4 Analysis of Compaction Test
Table 4. Compaction Test Results
Measurement Loc.1 Loc. 2 Loc. 3 Loc. 4 Loc. 5 Loc. 6 Dry density, kg/m3 1361 1432 1457 1554 1393 1871 Wet Density, kg/m3 1736 1796 1816 1890 1764 2091 Moisture content, % 27.52 25.32 24.52 21.52 26.52 11.58 Optimum moisture content, % 28.3 26.1 25.3 22.3 27.3 12.3 Maximum dry density, % 1476 1553 1581 1686 1511 2030
The extreme importance of geotechnical stabilizing soil performance was analysis of field control tests to assure that compacted fills met the prescribed design specifications according to ASTM (2007b) D 698 standards.The swelling potential of an expansive laterite soil depends on the soil’s initial condition, it was necessary to test the soil samples at different water contents (Germaine and Germaine, 2009). The optimum water content which is the water content that results in the greatest density for a specified comparative effort was investigated as shown in Figure 2.
Figure 2: Dry Density against Moisture Content (Loc.1 to 6)
It was observed that the compacting laterite soil at water contents lower than (dry of) the optimum water content typically results in flocculated soil structure (random particle orientations) that is weak soil, less ductile, more pervious, soft, less susceptible to shrinkage, and susceptible to swelling than the characteristics of the soil compacted wet of the optimum content to the same density.
4.5 Analysis ofUndrainedTriaxial Compression Test
The quick undrainedtriaxial test results carried out on disturbed laterite soil type were presented in Table 5.
Table 5. Quick UndrainedTriaxial Test Results
Measurement Loc. 1 Loc. 2 Loc. 3 Loc. 4 Loc. 5 Loc. 6 Cohesion, kPa 96 82.1 80.3 86.1 95.3 52.3 Angle of friction, deg. 17.5 20.2 17.3 19.4 20.1 14.6 Bulk density, kg/m3 1587.8 1549.7 1826.8 1691.7 1515.0 2031.2 Moisture content, % 25.1 26.2 18.2 22.1 27.2 12.3
laterite soil samples was a result of low water absorption during soaking processes thereby reduced the void ratio. The void between laterite soil particles was filled with little moisture and increased the particle bonds. Consequently, the soil was in a firm condition and results in high values of shear parameters. The corresponding water content obtained was lower than the derived optimum water content. Therefore, values of the shear strength parameters increase with the decrease in water content.
4.6 Analysis ofAtterberg Limits Test
The results of Atterberg limits test for locations arepresented in Table 6.This method was used to evaluate the weathering characteristics of laterite soil materials. When subjected to repeated wetting and drying cycles, the liquid limits of these materials tend to increase. The amount of increase is considered to be a measure of laterite’s susceptibility to weathering. Also, engineering behaviour such as compressibility, hydraulic conductivity (permeability), compatibility, shrink-swell, and shear strength affects the laterite soil properties.
Table 6.Atterberg Limits Test Results
Measurement Loc. 1 Loc. 2 Loc. 3 Loc. 4 Loc. 5 Loc. 6 Liquid limit, % 45.4 44.0 38.0 42.7 47.4 22.3 Plastic limit, % 21.4 21.1 19.7 21.7 21.0 Non-plastic Moisture content, % 14.9 14.2 12.2 14.3 16.2 9.6 Plasticity index, % 24.05 22.95 18.3 21.05 26.45 - Consistency index, % 1.27 1.3 1.41 1.35 1.18 - Flow index, % 6.59 6.59 6.59 6.59 6.59 6.31 Swell index, % 0.33 0.32 0.32 0.33 0.34 0.43 Liquidity index, % -0.27 -0.3 -0.41 -0.35 -0.18 -
The liquid limit values for locations 1 – 5 was classified as medium (35 – 50 %) potential swell while location 6 classified under low (15 – 28 %) potential swell. Also, the plasticity index values for location 1 – 5 was classified as medium (15 – 50 %) plastic laterite soil while location 6 after successive trials the liquid limit and moisture content were able to be determined but the plastic limit was unable to be determined. The laterite soil for location 6 was recorded as a non-plastic soil sample (sandy). The variation in swell potential was carried out according to classification proposed by Holtz and Gibbs (1956).
4.7 Analysis of Linear Shrinkage
The results of linear shrinkage for six locations are presented in Table 7. The shrinkage limit was used to evaluate the shrinkage potential, crack development potential, and swell potential of earthwork involving cohesive laterite soils.
Table 7. Linear Shrinkage Result
Measurement Loc. 1 Loc. 2 Loc. 3 Loc. 4 Loc. 5 Loc. 6 Original Length, L0 (mm) 140 140 140 140 140 140 Final Length, Lf (mm) 126 126 128 127 126 138 Linear shrinkage limit 10.0 10.0 8.6 9.3 10.0 1.4 Shrinkage limit 8.7 8.7 9.6 9.1 8.7 14.4 Degree of expansion Critical Critical Critical Critical Critical Non – critical
The average linear shrinkage value ranged from 1.4 to 10 while their average shrinkage limit ranged from 8.7 to 14.4 for the six locations. The degree of expansion for location 1, 2, 3, 4, 5 wasclassifiedas critical (greater than 15 %) while location 6 classified as non-critical (within 10 – 15 %) according to classification proposed byHoltz and Gibbs (1956). The linear shrinkage of laterite soil has been proved to be a better indicator of the swell potential than the plasticity index (Mckeen, 1976). The reason is as a result of volume change mechanism.
4.8 Correlation Model (Slope Stability –Circular Failure)
4.8.1 Analysis of the Relationship between Factor of Safety and Bench Height
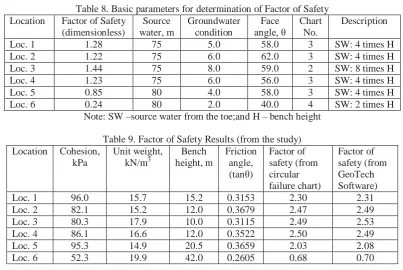
Table 8. Basic parameters for determination of Factor of Safety Location Factor of Safety
(dimensionless)
Source water, m
Groundwater condition
Face
angle, θ Chart No.
Description
Loc. 1 1.28 75 5.0 58.0 3 SW: 4 times H Loc. 2 1.22 75 6.0 62.0 3 SW: 4 times H Loc. 3 1.44 75 8.0 59.0 2 SW: 8 times H Loc. 4 1.23 75 6.0 56.0 3 SW: 4 times H Loc. 5 0.85 80 4.0 58.0 3 SW: 4 times H Loc. 6 0.24 80 2.0 40.0 4 SW: 2 times H
Note: SW –source water from the toe;and H – bench height
Table 9. Factor of Safety Results (from the study) Location Cohesion,
kPa
Unit weight, kN/m3
Bench height, m
Friction angle, (tanθ)
Factor of safety (from circular failure chart)
Factor of safety (from GeoTech Software) Loc. 1 96.0 15.7 15.2 0.3153 2.30 2.31 Loc. 2 82.1 15.2 12.0 0.3679 2.47 2.49 Loc. 3 80.3 17.9 10.0 0.3115 2.49 2.53 Loc. 4 86.1 16.6 12.0 0.3522 2.50 2.49 Loc. 5 95.3 14.9 20.5 0.3659 2.03 2.08 Loc. 6 52.3 19.9 42.0 0.2605 0.68 0.70
From Table 9, the relationship between factor of safety and bench height was investigated. The relationship of factor of safety and bench height was shown in Figure 3.The correlation model for the factor of safety decreases with increase in bench height as expressed using Equation 27.
FS = -0.058 BH + 3.170 (27)
Where: FS is the factor of safety -dependent variable; and BH is the bench height (m) –predictor.
From Figure 3, the line of best-fit shown in the graph represents approximately the average value of the factor of safety in relation to bench height.
Figure 3. The relationship between Factor of Safety and Bench Height
A negative linear trend line for the relationship curve with corresponding equation gave a value of correlation coefficient R = 0.988 (98 %). The correlation coefficient value obtained exhibit a large correlation which is positive.
4.9 Regression Model (Slope Stability –Circular Failure)
Figure 4. Factor of Safety (FS) against Regression Standardized Predicted Value
From Figure 4, the line of best-fit shown in the graph represents approximately the average value of the factor of safety in relation to geotechnical parameters. The correlation model for factor of safety of the laterite deposit increases with increase in regression standardized predicted value (cohesion, angle of friction, unit weight, and bench height) as expressed in Equation 28;
FS = 2.485+ 0.003c + 0.001UW – 0.053BH + 1.028FA (28) Where:FS is the factor of safety -dependent variable; predictor variables includes c is the cohesion (kN/m3); UW is the unit weight (kN/m3); BH is the bench height (m); and FA is the friction angle.
A linear trend line for the relationship curve with corresponding equation 28 gave a value of multiple correlation coefficient R2 = 0.999 (99 %). The multiple correlation coefficient value obtained exhibit a large correlation which is positive.
V. CONCLUSIONS
Investigation of slope stability of laterite soils of borrow-pit is important in tropical geological environments. There are possibilities of slope failures within borrow-pit. Thus, research on the properties of the laterite soils is undeniably important to solve both the economic and social problems associated with the exploitation of the soil. The studies conducted on the stability of lateritic soil (borrow-pit) in seasonal weather conditions brought to focus the need to perform an effective stress analysis and compare results with standards. From the results of circular failure, the factor of safety for locations 1 – 5 was satisfactory for routine extraction and loading operations while location 6 was deduced to be unsafe due to loading condition of the terrain. The factor of safety relationship with bench height indicates that the higher the bench height, the higher the possibility of slope failure of the lateritic soil (borrow pit). In addition, the estimation scheme developed to predict the value of factor of safety will assist in the determination of a workable bench height for the extraction and loading operations. Finally, proper standard test should be carried out regularly on laterite soil used for construction purpose. Also, safety is essential in areas where possible slope failure is eminent such operations like extraction and loading should be carried out with minimum bench height.
REFERENCES
[1] ASTM (2002).D 854-00 - Standard Test Methods for Specific Gravity of Soil Solids by Water Pycnometer. ASTM International, West Conshohocken, PA, pp. 2
[2] ASTM (2003a).D 2850-30- Standard Test Method for Unconsolidated – UndrainedTriaxial Compression Test on Cohesive Soils. ASTM International, West Conshohocken, United State, pp. 1-7.
[3] ASTM (2003b).D 2216 - Test Method for Laboratory Determination of Water (Moisture) Content of Soil and Rock by Mass. ASTM International, West Conshohocken, United State, Vol. 04.02 - 09, pp. 1-14. [4] ASTM (2007a).D 422-63 - Standard Test Methods for Particle – Size Analysis of Soils. ASTM
International, West Conshohocken, PA, pp. 1-8.
[6] ASTM (2012).D 2434 - Standard Test Methods for Permeability of Granular Soils (Constant Head), ASTM International, West Conshohocken, PA, pp. 1- 15.
[7] Germaine, J.T. and Germaine, A.V. (2009).Geotechnical Laboratory Measurements for Engineers. John Wiley & Sons Inc.: Hoboken, NJ. ISBN 978-0-470-15093-1, pp. 1 – 85.
[8] Gidigasu, M.D. (1972).Mode of Formation and Geotechnical Characteristics of Laterite Materials in Ghana in Relation to Soil Forming Factors. Eng. Geol., Vol. 4: pp. 79-91.
[9] Holtz, W.G. and Gibbs, H. J. (1956). Engineering Properties of Expansive Clays: Transactions American Society for Civil Engineering, 121, pp. 641 – 677
[10] Lambe, T. William, (1951). Soil Testing for Engineers.The Massachusetts Institute of Technology, John Wiley and Sons Inc.,New York, pp. 1-165.
[11] Maigien, R. (1966).Review of Research on Laterites. Natural Resources Research IV, United Nations Educational Scientific and Cultural Organization, Paris, France. Vol. 4, pp. 1-70
[12] McKeen, R.G., (1976).Design and Construction of Airport Pavements on Expansive Soils. Report No. FAA-RD-76-66, Final Report, Washington D.C.: U.S. Department of Transportation, Federal Aviation Administration Systems Research & Development Service, pp.1-25.
[13] Ola, S.A. (1978).Geotechnical Properties and Behaviours of Some Stabilized Nigerian Lateritic Soils.Tropical Soils of Nigeria in Engineering Practice. Ola, S.A. (ed.). A.A. Balkena, Rotterdam, Netherlands, pp. 61-84.
[14] Olaleye, B. M. and Jegede, G. (2008).Application of Capping Materials in the Determination of Uniaxial Compressive Strength of Rocks. Mineral Wealth Journal, Greece, No 143, pp. 21-30.
[15] Proctor, Ralph, Roscoe, (1933).Proctor Fundamental Principles of Soil Compaction, Engineering News-Record, a Series of Four Essays on 31st August, 7, 21and 28 September. pp. 1-45.
[16] Wyllie, D.C. and Mah, C.W. (2004). Rock Slope Engineering: Civil and Mining, 4th edition,Spon Press, New York. pp. 176-199.