Stereo Matching Using Iterative Dynamic
Programming Based on Color Segmentation of
Images
Fuzhi WangKey Laboratory of Manufacturing and Automation of Xihua University, Chengdu, China [email protected]
Changlin Song and Qiang Du
School of Mechanical Engineer & Automation of Xihua University, Chengdu, China [email protected], [email protected]
Abstract—The traditional dynamic programming stereo matching algorithms usually adopt the disparity assumption based on the intensity change of images; With the development of stereo matching technique, the disparity assumption based on image color segmentation is proved to meet better the need of true scenes. The paper introduces the disparity assumption into the stereo matching using dynamic programming, proposes a new global energy function, which not only resolves the problem of traditional dynamic programming stereo matching algorthm that the energy function is short of intensity and disparity constraints between scan lines but also can be computed more exactly because the adopted dissimillarity function propsed by Birchfield is extended from 2-connect neighborhood to 8-connect neighborhood. The energy function can converge fast because of the proposed pruning algorithm based on color segmentation. The experiments show that the proposed method produces competitive results with the 2-dimensional energy function minimized algorithm but has the much lower computing cost than them.
Index Terms—stereo matching, dynamic programming, color segmentation, energy function, visual disparity.
I. INTRODUCTION
Stereo matching, which is to find the corresponding relationship between the pixels of two or more images taken from different viewpoints, is one of the most basic and important problems in computer vision and widely used in fields such as robot vision, autonomous vehicle navigation, visual inspection and tracking, etc.
According to whether using global reasoning or not, the stereo matching algorithm is usually divided into two types [1]: local optimal stereo matching based on WTA and global optimal stereo matching based on minimization of energy function. Dynamic planning stereo matching belongs to global optimal stereo matching algorithm, its matching process is easy to introduce sequence constraint of disparity. However, for traditional dynamic programming stereo matching, the visual disparity is determined only according to the two corresponding polar lines; therefore the dynamic planning
stereo matching is called the one-dimensional energy algorithm and the matching error at a certain point is easy to spread down; In addition, the disparities between adjacent scan lines in traditional dynamic planning stereo matching algorithm are short of constraints. To solve these problems, Bobick A F proposed a dynamic programming algorithm based on GCP (Ground Control Point) [2], but the number and correctness of GCP will affect the matching performance; Leung S. C. proposed an algorithm called IDP to strengthen disparity continuity constraint between scanning lines [3]; Zhang H. F. furthermore combined the GCP with the IDP algorithm [4]; Jae C. K. proposed a two-pass dynamic programming technique combined with GCPs for a dense stereo matching [5]; The common feature of these methods is that they all adopt such a disparity assumption that the image intensity variation corresponds to disparity change. However, the assumption is workable only to a certain extent, therefore, the performance of the traditional dynamic planning stereo matching is still not ideal even relative to the best local stereo matching algorithm.
Besides matching accuracy, matching efficiency is another important question. Image segmentation is an efficient method to improve simultaneously matching efficiency and matching efficiency. For example, Cheng L. proposed a region-tree based stereo matching algorithm using dynamic planning [6]. Recently, a number of color segmentation based stereo matching algorithms confirmed the following assumptions: disparities of pixels within same color region changes continuously, discontinuous changes of disparity appear only on color segmentation region boundaries. It can be said that almost all the best stereo matching experiment results are obtained by segmentation-based global optimal algorithm such as Graph-cut, BP, etc [7-10]. However, such 2-dimensional global optimal algorithm’s calculating cost is very huge, this limits its practical applications.
8-neighborhood, on these two points a new global energy function is proposed, which can be minimized iteratively to obtain high-quality disparity map. Because the iterative process is implemented by the forward pruning algorithm based on segmentation, the iterative process converges quickly. Therefore, the proposed method has good performance on both matching efficicency and matching accuracy.
II. COLOR SEGMENTATION OF IMAGE
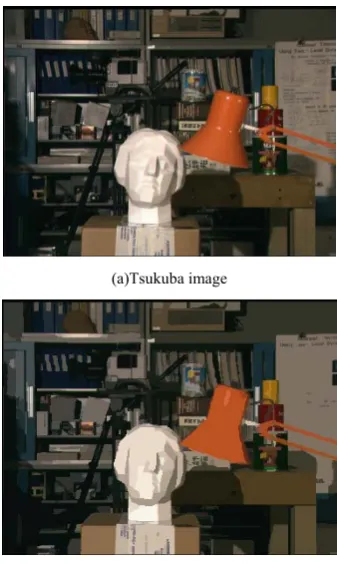
Applying color segmentation to stereo matching is because that there is a correspondence relation between the disparity change and the color change of stereo image, this assumption has been proved to basically meet the needs of the real scenes. In stereo-matching, Mean-shift based color segmentation algorithm has been widely used, this algorithm selects Epanechnikov kernel function to make a non-parameter estimation of the probability density distribution of the color mode by iteratively calculating the mean shift vector distribution to implements. This segmentation method requires little prior knowledge and has a high robustness and a high segmentation speed [12]. Figure 1 shows the results of color segmentation for Tsukuba image based on Mean-shit algorithm.
(a)Tsukuba image
(b) the color segmentation of Tsukuba image
Figure 1 color segmentation of Tsukuba image based on mean-shift
Ⅲ.ITERATIVE DYNAMIC PLANNING STEREO MATCHING
BASED ON COLOR SEGMENTAION
Stereo correspondence is an inherently ambiguous problem. One reasonable and commonly made solution is to assume that visual scene is piecewise smoothting. The methods of obtaining piecewise smooth disparity map
can be divided into two types: global optimal method and local optimal method. In global optimal stereo matching, the constraints on the disparity map are formulated into an objective function E(d) which is then minimized over all image pixels. A typical objective function has the following form:
E d( )=Edata( )d +Esmooth( )d (1)
Where,
E
data( )
d
is called data item, used to measure the similarity degree between the pixels on corresponding polar lines of left image and right image ;E
smooth( )
d
is called smoothing item, used to obtain the piecewise smoothing disparity map. The paper introduces the disparity assumption based on segmentation into the dynamic planning stereo matching and makes a new construction of data item and smoothing item.A. Data Item
Data item measures how well the disparity function agrees with the input image pair and can be defined as follows:
data
1
( ) p (( , ), )
N
i m m
i
E d c x u d N K
=
=
∑
− (2)Where,
c x u d x y
( , , ( , ))
k k represents the dissimilaritymeasurement of pixel
( , )
x u
i on left image withdisparity
d
;N
prepresents the number of all pixels on the u row of left image;N
mrepresents the number ofmatching region ( same disparity area),
K
m representsthe matching reward value, which can be interpreted as the maximum allowed of the dissimilarity between the corresponding points.
B. Smoothing item
Smoothing term encodes the smoothing assumptions of disparity made by the algorithm. The smoothing assumption states that disparity varies smoothly almost everywhere except at depth boundaries. Smoothing term is defined as :
(
)
(
) (
)
(
)
smooth( ) ( , ( 1, ))
, , 1
h k k
k
v k k
k
E d e d x u d x u
e d x u d x u
−
= − +
− −
∑
∑
(3)In above formula, the first term represents the disparity smoothness on polar lines, the second represents the disparity smoothness between polar lines. Where,
e
haccording to the Pots model is defined as:
( ) 0 0
0 h
h h
occ h h
d e d
K
λ
dΔ =
⎧
Δ =⎨ + Δ ≠
⎩ (4)
(
)
0
v0, 1
v v vd
e
d
else
λ
Δ = ±
⎧
Δ
=
⎨
⎩
(5)Where,
K
occ represents the punishment constant ofocclusion.
Δ
d
h,
Δ
d
vrepresents the disparity differencebetween the adjacent pixels in the horizontal and vertical directions. According to the relationship between the intensity changes and the disparity changes [11], it can be inferred that: on the left polar line (scanning line), occlusion area must be located on the left side of the boundary of the color segmentation region, and on the right scanning line, occlusion area is located on the right side of the boundary of segmentation region. The paper adopts the matching method from left to right. Provided
j
y
as the arbitrary pixel of right image,
y
j−1 is the pixel left toy
j andy
j+1 is the pixel right toy
j , thecorresponding pixel in the left image is
x
i=
y
j+
δ
,δ
is the disparity variable. Now in the case of
Δ
d
h,Δ
d
vtaking non-zero value , we discusses the determination method of the
e e
h,
v i.e.λ λ
h,
v :1) In the case that left image is continuous and right image is occlusive, the pixel left to occlusive region of the right image is considered. If the pixel point is the change point of color,
e
h(
Δ
d
h)
is rewarded by letting0
h
λ
=
elsee
h(
Δ
d
h)
is punished by lettingλ
h=
T
1 ,which makes the changes of color are consistent with the changes of disparity.
2) In the case that right image is continuous and the left image is occlusive, the pixel right to occlusive region of the left image is considered. If the pixel is change point of color,
e
h(
Δ
d
h)
is rewarded by lettingλ
h=
0
else(
)
h h
e
Δ
d
is punished by makingλ
h=
T
1, which makes the changes of color are consistent with the changes of disparity. Parameterλ
h can be determined according tothe same as follows:
1 1 1
1 1
1 1
( , ) ( , ) & ( , ) ( , ) 0 (( , ) ( , ) & ( , ) ( , ))
|| (( , ) ( , ) & ( , ) ( , )) h
i i i i
i i i i
i i i i
T if x u seg x u x u seg x u
if x u seg x u x u seg x u
x u seg x u x u seg x u
λ − + − + − + = ∈ ∈ ⎧ ⎪ ∉ ∈ ⎨ ⎪ ∈ ∉ ⎩ (6)
The parameter
λ
vcan be determined according to thesame reason:
2
0 ( , ) ( , 1) & ( , ) ( , 1)
( , ) ( , 1)
v
i i i i
i i
if x u seg x u x u seg x u
T if x u seg x u
λ = ∈ − ∈ + ⎧ ⎨ ∉ − ⎩ (7)
From the definitions of parameters
λ λ
h,
v it can be seenthat because of using color segmentation instead of the conventional intensity change to indicate the variation of the disparity, a more accurate judgment of disparity change can be obtained.
Equ.1, Equ.2 and Equ.3 provide an iterative structure of dynamic planning stereo matching. If the
E d
( )
doesn’t converge using dynamic planning, it can be minimized iteratively.IV. TWO IMPORTANT QUESTIONS OF ITERATIVE
DYNAMIC PLANNING STEREO MATCHING
A. 8-neighborhood Dissimilarity Measure Function Insensitive to Sample
Due to sampling, dissimilarity between pixels can not been measured simply by the intensity differences of pixels because the intensity differences becomes very large where grayscales change sharply and the disparity is not an integral number of pixels. The Ref.11 has proposed a dissimilarity measurement method which uses linear interpolation of the intensities of adjacent pixels to get the intensity function to calculate the dissimilarity; this method is proved to be not sensitive to the sampling.
Let
I I
l,
rrespectively denote the grayscale function of the left and right corresponding polar lines,x y
i,
iare thetwo pixel points to be calculated dissimilarity, and
I
ˆ
ris linear interpolation function of the sampling points on polar lines of right image, Ref.11 first definition:
l r 1 1 l r
2 2
ˆ ( , , , ) min ( ) ( )
i i
i i i
y y y
c x y I I I x I y
− ≤ ≤ +
= − (8)
Dissimilarity between pixels
x y
i,
i can be obtained bythe following formula:
{
l r r l}
( , ) min ( , , , ), ( , , , )i i i i i i
c x y = c x y I I c y x I I
(9) From Equ.8 and Equ.9 it can be seen that Ref.11 defined dissimilarity at the left and right neighborhoods of pixel so that the upper and lower adjacent polar lines lost constraint of intensity. Because of this, the paper makes the definitions as follows:
l r
2
l r
1 , 1
2 2
( , , , ) ˆ
min ( , ) ( , )
lr i i
i i i i
x y
c x y I I
I x y I x x y y
δ δ δ δ − ≤ ≤ = − + + (10) r l 2 1 , 1
2 2
( , , , ) ˆ
min ( , ) ( , )
rl i i
r i i l i i
x y c y x I I
I x y I x x y y
δ δ δ δ
− ≤ ≤
=
Where,
I I
ˆ ˆ
l,
r are linear piecewise continuous fitting function, the maxima or the minimal point of linear piecewise continuous function must be the breakpoints of function, thus:
{
}
{
}
max
, 1,0,1
min
, 1,0,1 1
max ( , ) ( , )
2 1
min ( , ) ( , )
2
r r r
x y
r x y r r
I I x y I x x y y
I I x y I x x y y
δ δ δ δ
δ
δ
δ
δ
=−
=−
= + + +
= + + +
(12)
Then,
c
lr( , , , )
x y I I
i i l r can be computed as follows:{
l r max min}
l l
( , , , )
max 0, ( , ) ( , ), ( , ) ( , )
i i
r r
c x y I I
I x y I x y I x y I x y
=
− −
(13)
For
c y x I I
( , , , )
i i r l , it can be treated in the same way.Thus, the measure of the dissimilarity between the two pixels of the left and right images can be defined as follows:
{
l r r l}
( , ) min ( , , , ), ( , , , )
i i i i i ic x y
=
c x y I I
c y x I I
(14)Dissimilarity measurement obtained by the Equ.13 still maintains the sampling-insensitive advantage because it still uses the linear interpolation method. At the same time, the new measurement function is computed over 8-connected neighborhood, this strengthens intensity constraint between polar lines, the dissimilarity calculation and energy function can be computed accurately.
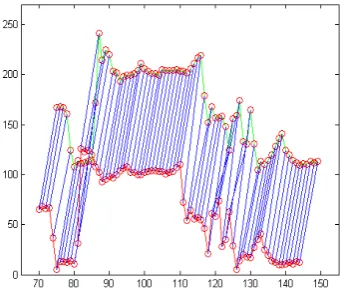
Figure 2 shows the experimental results. We can see that the 8-neiborhood Birchfield function has the better performance of measuring the dissimilarity between pixels.
(a) Pixel corresponding between the left and right images
(b) The dissimilarity measurement by 2 neiborhood Birchfield function
(c) The dissimilarity measurement by 8-neiborhood Birchfield function Figure 2 The dissimilarity measurement between pixels
B. Fast Implementation of Iiterative Dynamic Programming Stereo Matching Based on Color Segmentation
The dynamic planning has the disadvantage of “curse of dimensionality”, how to make the energy function converge fast has become a key issue. G. Van Meerbergen proposed a hierarchical symmetric stereo algorithm [13]; Olga Veksler proposed a fast algorithm based on tree structure decomposition [14]. The Ref.11 proposed a pruning algorithm, but the algorithm adopts disparity assumption based on intensity change, therefore, although this algorithm has a high matching efficiency, the matching accuracy is not ideal.
In order to obtain ideal matching accuracy and matching speed, the paper proposed the forward pruning algorithm based on color segmentation, i.e Figure 3. In this algorithm,
ϕ δ
[ , ]
y
is the cost of the best match sequence (so far) ending at match(
y
+
δ
, )
y
;m
yrepresents the minimum matching cost of certain column
of the
x
−
y
searching grid.m x
x[ ]
represents theof disparity of image. At the rows: 4, 9 and 13, the disparity constraint between the scanning lines is introduced and the dissimilarity is measured on the 8-connected neighborhood, the two methods make the energy function more exact. When the energy function is minimized iteratively, an accurate disparity map can be obtained.
Seen from the Figure.3, the proposed algorithm is established on the fact that there are not the disparity changes within the same segmentation region ( called sub-segmentation). Therefore, it is better to select over-segmentation.
{
}
(
)
( ) ( )
(
)
01 for 0 to 2
02 min 0, , 1, , , ,
03 for 0 to
04 update_path , , , 1
05 if , then
06 1
07 for 1to
08 1 seg
09 update_path , , ,
10 if , m
p
y p p p
p
p p p p p p y
p p
x p p p p p x p p
y n
m y y y
y y y m y y
if y y
y y
y y
ϕ ϕ ϕ
δ
δ δ
ϕ δ
δ δ
δ δ
δ δ
ϕ δ δ
← −
⎡ ⎤ ⎡ ⎤ ⎡ ⎤
← ⎣ ⎦ ⎣ ⎦ ⎣Δ ⎦
← Δ
+
⎡ ⎤≤
⎣ ⎦
← +
← + Δ
+ − ∉ +
⎡ ⎤≤ ⎡ + ⎤
⎣ ⎦ ⎣ ⎦
"
(
)
( )
(
)
and 1 seg
11 for 0 to 1
12 1
13 update_path , , ,
p y p
p p p
p p
y y
y y
y y
δ δ
δ δ
δ δ
+ ∉
← −
← + − +
Figure 3 pruning algorithm based on image segmentation
Ⅴ. EXPERIMENT RESULTS AND ANALYSIS
The experiments are done with the stereo images from Middlebury University. Some parameters are introduced into the energy function, these parameters are set as follows: the matching award
K
m=
15
,K
occ=
50
,1
T
=80,T
2=
7
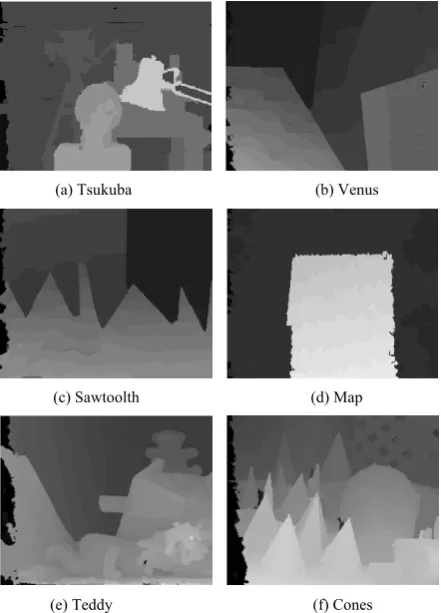
.The experimental results are shown in Figure 4. It can be seen from Figure 4 that the proposed method can protect better the edges of the image because the disparity change is judged by color segmentation; it also can be seen that the proposed algorithm overcomes basically the foreground expansion drawback of usual dynamic programming stereo matching algorithms such as Ref.11.
Table 1 shows the quantitative comparison results of the proposed algorithm’s performance indicators with other algorithms’. The three performance indicators are respectively the nnoc, all, disc proposed in the Ref.1. Where, DP represents the experiment results of the classic dynamic programming stereo matching [1]. Adaptweight represents the experiment results of one of the best stereo matching algorithm based on area matching [15]. AdaptingBP represents the experiment results of one of the best stereo matching algorithm based on the two-dimensional energy function [16].
Computational efficiency comparison of various matching algorithm has currently no literature to refer to,
we can only make a rough comparison. Such two-dimension energy function algorithms as Graph-cut, BP need a few minutes to complete matching for the standard stereo images [10]. Even optimized by the image segmentation technique, these algorithms still need tens of seconds machine. However, the proposed algorithm takes only 4.723s to completes stereo matching for Tsukuba image pair on the computer with configuration: CPU 2.67G.
(a) Tsukuba (b) Venus
(c) Sawtoolth (d) Map
(e) Teddy (f) Cones Figure 4 The experimental results of the proposed iterative dynamic
planning stereo matching TABLE 1
COMPARISON RESULTS OF THE PROPOSED ALGORITHM WITH OTHER ALGORITHMS
Algorithm Proposed method DP
Adaptive- Weight
Adaptive-BP
Tsukuba
nnoc 1.17 4.12 1.38 1.11 all 1.50 5.04 1.85 1.37 disc 5.43 12.0 6.90 5.79
Venus
nnoc 0.64 10.0 0.71 0.10 all 0.88 11.0 1.19 0.21 disc 5.23 21.0 6.13 1.44
Teddy
nnoc 6.87 14.0 7.88 4.22 all 9.76 21.6 73.3 7.06 disc 16.8 20.6 18.6 11.8
Cones
ACKNOWLEDGMENT
This research was supported in part by Chunhui project of The Ministry of Education of China (NO. 12202528), important project of Xihua University (NO. Z1120223) and the Open Research Fund of Key Laboratory of Manufacturing and Automation (NO.SZJJ2011-019) , Xinhua University.
REFERENCES
[1] D. Scharstein, and R. Szeliski, “A taxonomy and evaluation of dense two-frame stereo correspondence algorithms,” Int. J. Comput. Vision, vol. 47, no. 1-3, pp.
7-42, 2002.
[2] A. F. Bobick, and S. Sintille, “Large occlusion stereo,” Int.
J. Comput. Vision (S0920-5691), vol. 33, no. 3, pp.
181-200, 1999.
[3] S. C. Leung, B. Appleton, and C. Sun, “Fast stereo matching by iterated dynamic programming and quadtree subregioning,” in Proc. Conf. British Mach.Vision, London:
British Mach. Vision Assoc. Press, 2004, pp. 97-106. [4] H. F. Zhang, and C. X. Zhao, “Ground control point based
stereo matching via iterative dynamic programming,”
Chinese J. Sci. Instrum., vol. 29, no. 8, pp.1665-1669,
2008.
[5] C. K. Jae, M. L. Kyoung, and T. C. Byoung, etc., “A dense stereo matching using two-pass dynamic programming with generalized ground control points,” in Proc. Comput.
Vision. Pattern Recogn., New York: IEEE Comput. Soc.,
2005, pp. 1075-1082.
[6] C. Lei, J. Seizer, and Y. H. Yang, “Region-tree based stereo using dynamic programming optimization,” in Proc.
IEEE Conf. Comput. Vision Pattern, New York: IEEE
Comput. Soc., 2006, pp. 378-385.
[7] H. Li, and G. Chen, “Segment-based sereo matching using graph cuts,” in IEEE Comput. Soc. Conf. Comput. Vision
Pattern Recogn., Washington: IEEE Press, 2004, pp. 74-81.
[8] H. Tao, H. S. Sawhney, “Global matching criterion and color segmentation based stereo,” Proc. IEEE Workshop
Appl. Comput. Vision, Palm Springs: IEEE Press, 2000, pp.
246-253.
[9] M. Bleyer, and M. Gelauta, “Graph_cut_based stereo matching using image segmentation with symmetrical treatment of occlusions,” Signal Process.: Image, vol. 22,
no. 2, pp. 127-143, 2007.
[10]J. Sun, N. N. Zheng, and H. Y. Shum, “Stereo matching using belief propagation,” IEEE Trans. Pattern Anal. Mach.
Intell., vol. 25, no. 7, pp. 787-800, 2003.
[11]S. Birchfield, and C. Tomasi, “Depth discontinuities by pixel to pixel stereo,” in Proc. Int. Conf. Comput. Vision,
USA: IEEE Press, 1998, pp. 1073-1080.
[12]D. Comanicin and P. Meer, “Mean shift: a robust approach toward feature space analysis,” IEEE Trans. Pattern Anal.
Mach. Intell., vol. 24, no. 5, pp. 603-619, 2002.
[13]G. Van Meerbergen, M. Vergauwen and M. Pollefeys, etc. “A hierarchical symmetric stereo algorithm using dynamic programming,” Int. J. Comput. Vision, vol. 47, no. 1, pp.
275-285, 2002.
[14] O. V. Eksler, “Stereo correspondence by dynamic programming on a tree,” in Proc. of the IEEE Conference
on Computer Vision and Pattern Recognition, New York:
IEEE Comput. Soc., 2005, pp.384-390.
[15]K. J. Yoon, and I. S. Kweon, “Adaptive support-weight approach for correspondence search,” Pattern Anal. Mach.
Intell., vol. 28, no. 4, pp. 650-656, 2006.
[16]A. Klaus, M. Sormann and K. Karner, “Segment-based stereo matching using belief propagation and a self-adapting dissimilarity measure,” in Int. Conf. Pattern
Recogn., pp. 15-18, 2006.
Fuzhi Wang, received a Ph.D. degree from UESTC in 2010, now works in School of Machanical Engineer & Automation of XiHua University. His research Interests mainly concentrate on the automation technology based on machine vision.
Changlin Song, received a Ph.D from SWJTU in 2004, now works in School of Machanical Engineer & Automation of XiHua University.