VOLUME 3, ISSUE 4, Apr.-2017
152 | P a g e
A REVIEW PAPER ON DESIGN, FABRICATION & TRIAL ON MULTI
CYLINDER PETROL ENGINE TEST RIG
PROF. AMAR DOKHE
Assistant Professor, Department of Mechanical Engineering, Datta Meghe College of Engineering, Airoli, Navi Mumbai- 410209. India.
MOHIT CHAUDHARI
B.E. Student Department of Mechanical Engineering, DattaMeghe College of Engineering, Airoli, Navi Mumbai- 410209. India.
SANKET KADAM
B.E. Student Department of Mechanical Engineering, DattaMeghe College of Engineering, Airoli, Navi Mumbai- 410209. India.
ABSTRACT
The basic task of the development engineer is to reduce the cost and improve power output and reliability of the engine. Trying to achieve these goals there is various design concepts to find the effects on engine performance of a particular design concept to resorts to testing. Thus, in general, developments of engine will have to conduct a wide variety of engine tests. Engine performance is an indication of the degree of success with which it is doing its assigned job. These performance characteristics can be verified by using a different Testing Methods. In this research to designed & fabricated multi cylinder petrol engine test rig for demonstration purpose as well as an experimental setup to carry out various performance characteristics trials on the same. The aim of this project is to study the performance characteristics of a four stroke four cylinder spark ignition petrol engine. Here set of demonstrated break power, break specific fuel consumption, Break thermal efficiency, mechanical efficiency and heat balance at various load conditions. Generally the Morse Test and Heat Balance can be performed on the multi-cylinder engine by running the engine at required speed and different parameters can be measured by using different measurement systems. KEYWORDS: multi cylinder petrol engine, performance characteristics, efficiency.
1.INTRODUCTION:
The design and development of test setup and experimental data collection and analysis are equally important for any experimental research. For the success of test rig development depends on proper planning, design and selection of right kind of equipment and measuring instruments and skill in fabrication and the precession and accuracy of the observations during trial. All the above mentioned
parameters are discussed in this paper. Four stroke four cylinder water cooled, Maruti Esteem engine is selected for the present study. This engine is converted into a Test Rig by attaching
Retrofits. Rope brake dynamometer is used for Measurement of brake power. A belt is wound on the brake drum and loaded by a power screw on one side. Spring balance shows tensions in rope side. Air consumption is measured trough orifice meter air tank. One end of a U tube manometer is connected to air tank while other is free to atmosphere. The difference in water levels in two sides indicates the pressure gradient acrossthe orifice. The rate of air consumption and volumetric efficiency can be calculated from this pressure gradient. Fuel consumption is measured with a three way cock and simple burette marked on its length. Calorimeter is a heat exchange with counter flow of water. The various inlet and outlet temperatures of water, exhaust gas are measured with thermocouples and digital display. The flow rate of water passing through calorimeter is measured with Rota-meter.
2.LITERATURESURVEY:
J.D.V. at el [1] in this paper the study of petrol engine using compressed Biogas as a fuel is carried out and the following results are obtained Fuel consumption on petrol mode is less than compressed biogas. BSFC of compressed biogas is higher. Brake thermal efficiency on petrol mode will be higher compared to compressed biogas.
VOLUME 3, ISSUE 4, Apr.-2017
153 | P a g e cashew nut oil, cottonseed oil and its blends in various
proportions by volume and then following results are obtained on multi cylinder Hindustan 4 stroke diesel engineBSFC is less for the blend 20 over the entire range of load compared to diesel fuel.Mechanical efficiency B20 blend was considered higher over entire load range Volumetric efficiency for B40 blend was consider higher over entire load range.B20 blend is preferred to use because of low specific fuel consumption, power utilized is more, and low exhaust gas temperature.
Apart from this various performance tests have been carried out on different engines with different fuels [3-12].
3.EXPERIMENTALDESIGN&PROCEDURE: Experimental set up usually consists of: 1) Selection of Engine & design of base frame. 2) Design and Construction of Dynamometer. 3) The Layout and Actual Construction of
Foundation for the Project.
4) Designing and Construction of Sensor Panel and Attachment of the same to the Engine.
5) Design, Selection and Assembly of Heat Exchanger to the engine.
6) Carrying out Testing on the Test Rig.
3.1SELECTION OFENGINE & DESIGN OF BASE FRAME: 3.1.1. SELECTION OF ENGINE:
The engine is very smooth. The car is powered by a transverse alloy blocks head E MPFI (Electronic Multi Point Fuel Injection) petrol engine which drives the front wheels. The VXI has a 1298cc unit with 4 valves per cylinder whose output is 85bhp and 10.6 Kgm (at 6000rpm).The diesel has a 1527 cc Peugeot engine putting out 57bhp and 9.7 Kgm (at 5500rpm).Performance is very good.
(Figure. 1 Maruti Esteem 4 cylinder petrol engine) 3.1.2. Engine Frame
To make engine stand still and to support it properly the design and construction of frame is done.
The design of the frame should be such that it should absorb all the vibrations of the engine and also it should be sturdy and robust to sustain the load coming on it.
A rectangular frame of length 4 feet * 2 feet of "C" channel.
( Figure. 2 Basic Structure )
(Figure.3. Supporting structure)
(Figure.4. Installation of Engine)
3.1.3. RADIATOR FRAME
To safeguard working engine components from seizing due to overheating, some arrangement of keeping it under safe operating temperature will have to be made and system employed for this is cooling system
Types of cooling system: A) Air cooling system B) Water cooling system
For attaching the radiator following attachment is done M.S square bar 1 feet long
M.S plate of 2 feet
a flat M.S plate of 16 inch long Engine Type 4 stroke
Displacement 1298 (cc)
Power 85@6000 (PS@rpm)
Torque 110@4500 (Nm@rpm)
Bore 74 (mm)
Stroke 75.5 (mm)
VOLUME 3, ISSUE 4, Apr.-2017
154 | P a g e ( Figure. 2 Radiator Frame)
3.2DESIGN AND CONSTRUCTION OF DYNAMOMETER:
3.2.1. SHAFT DESIGN CALCULATIONS:
Medium carbon steel, case hardening with 0.4% carbon. Speed (N) = 5600 RPM
Torque (T) = 100 N-mm
Bending Stress (σb) = 66 Mpa Pulley Weight (w) = 34.52 N
Maximum tension in the belt, T1+ T2 = 147.15 N Resultant force of pulley Resultant (R) =112.83 N Combined twisting & bending moment=46.69 Mpa
(Figure6. SFD and BMD for shaft ) Twisting moment Te = 11285.144
Equivalent bending moment Me = 11284.074 Te =
π
16× τmax × d
3 d = 10.71 mm
This diameter is not suitable for our engine torque and loads which is act upon it. So we have selected a standard size of shaft 20 mm diameters according to design data book.
( Figure 7. Shaft ) 3.2.2. PULLEY DESIGN
Pulley material = Cast Iron
Speed of the pulley (N) = 5600 rpm
Tensile strength for cast iron (σt) = 480 N/mm2
Belt width (b) = 40 mm
Diameter of Hub of Pulley D = 55 mm Length of Hub (L) L = 32 mm
( Figure 8. Dynamometer )
3.2.3.DESIGN OF FRAME : FOR MAIN FRAME:
Sr. No. Part Name Dimensions (MM)
Quantity (Nos)
1 ‘C’ Channel 750 2
2 ‘C’ Channel 550 1
FOR BEARING BLOCK HUB:
SR.
NO. PART NAME
DIMENSIONS (MM)
QUANTITY (NOS)
1 Hollow square
channel 120×40×40 2
2 Flat Plate
(upper) 250×40×4 1
3 Flat Plate
(lower) 550×50×10 1
VOLUME 3, ISSUE 4, Apr.-2017
155 | P a g e ( Figure 10. Final Assembly 2D of dynamometer frame)
( Figure 11. Final Assembly 3d modelof dynamometer frame )
3.3. THE LAYOUT AND ACTUAL CONSTRUCTION OF FOUNDATION FOR THE PROJECT:
Foundations supporting machines such as reciprocating engines, radar tower, punch presses, turbines, large electric motors and generators etc. are subjected to vibration caused by unbalanced machine forces as well as static weight of machine
Measurement:
Excavation 2.0 x 1.0 x 1.25 = 2.50cum Soling 2.0 x 1.0 x 0.3 = 0.5 cum
P.C.C (1:2:4) MS2.0 x 1.0 x 0.152 = 0.3 cum Concrete M201.70 x 0.7 x 0.95 = 1.131 cum
Reinforcement
Bars (length wise) (2.15 x 4) x 3 = 25.8 m Bars (width wise) (1.85 x 9) x 5 = 83.5 m Bars vertical (0.95 x 4) x 3 = 11.4 m
120.3m x 0.395 = 47.5 kg Foundation bolts M16 & 250 mm long 8 nos.
3.4. DESIGNING AND CONSTRUCTION OF SENSOR PANELAND ATTACHMENT OF THE SAME TO THE ENGINE:
BAKELITE BOARD
(Figure 14. Preplanned arrangement of all equipment and name plate before Mfg )
Engine setup Multi cylinder
Foundation Block size LxW mm 2000 x 900 Depth (black soil/rocky soil) mm 750 - 800
( Figure12.Arrangements for
VOLUME 3, ISSUE 4, Apr.-2017
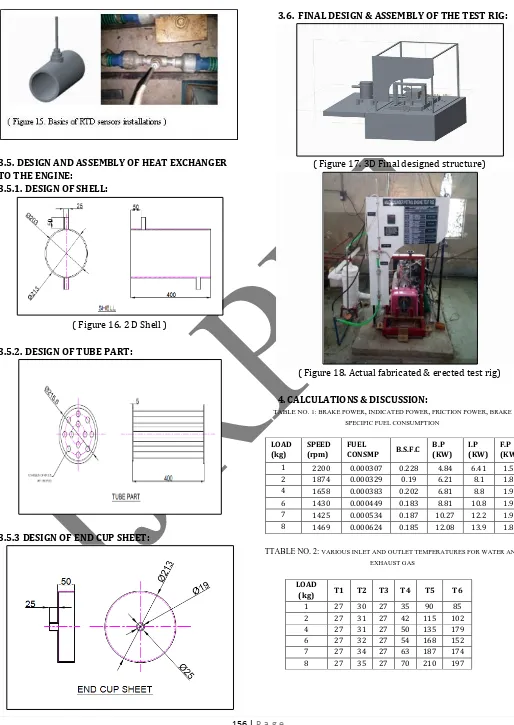
156 | P a g e 3.5. DESIGN AND ASSEMBLY OF HEAT EXCHANGER
TO THE ENGINE:
3.5.1. DESIGN OF SHELL:
( Figure 16. 2 D Shell )
3.5.2. DESIGN OF TUBE PART:
3.5.3 DESIGN OF END CUP SHEET:
3.6. FINAL DESIGN & ASSEMBLY OF THE TEST RIG:
( Figure 17. 3D Final designed structure)
( Figure 18. Actual fabricated & erected test rig)
4.CALCULATIONS&DISCUSSION:
TABLE NO. 1: BRAKE POWER, INDICATED POWER, FRICTION POWER, BRAKE SPECIFIC FUEL CONSUMPTION
TTABLE NO. 2: VARIOUS INLET AND OUTLET TEMPERATURES FOR WATER AND EXHAUST GAS
LOAD (kg)
SPEED (rpm)
FUEL
CONSMP B.S.F.C B.P (KW)
I.P (KW)
F.P (KW)
1 2200 0.000307 0.228 4.84 6.41 1.57
2 1874 0.000329 0.19 6.21 8.1 1.89
4 1658 0.000383 0.202 6.81 8.8 1.99
6 1430 0.000449 0.183 8.81 10.8 1.99
7 1425 0.000534 0.187 10.27 12.2 1.93
8 1469 0.000624 0.185 12.08 13.9 1.82
LOAD
(kg) T1 T2 T3 T4 T5 T6
1 27 30 27 35 90 85
2 27 31 27 42 115 102
4 27 31 27 50 135 179
6 27 32 27 54 168 152
7 27 34 27 63 187 174
VOLUME 3, ISSUE 4, Apr.-2017
157 | P a g e TABLE NO 3:CALCULATION OF HEAT BALANCE SHEET
Graph No.1: Heat Balance Sheet.
TABLE NO 4: various efficiencies at different loads
LOAD
(kg) ɳbth ɳith ɳmech
1 37.53 49.71 75.39
2 44.94 58.62 76.66
4 42.34 54.7 77.38
6 46.71 57.27 81.57
7 45.79 54.39 84.18
8 46.09 52.22 86.9
THE DIFFERENT GRAPHS ARE BEEN PLOTTED :
Graph No.2: Brake power Vs. Specific fuel consumption
DESCRIPTION: In the above graph Brake power is taken in x-axis and fuel consumption should be taken in y-axis. The fuel consumption has been compared with petrol fuel at various loads and it is shown in figure. It is observed that the Brake power was considering Higher over entire load range.
Graph No.3: Brake power Vs. Brake Specific fuel consumption
DESCRIPTION :In the above graph Brake power is taken in x-axis and BSFC should be taken in y-axis. The BSFC of the Petrol has been compared at various loads and it is shown in figure. It is observed that the Brake power for petrol was considering lower over entire load range.
Graph No 4: B.P.Vs. Exhaust gas Temperature
DESCRIPTION :The variation of exhaust gas temperature with Brake power conditions is shown in Figure. It is observed that the exhaust gas temperature increases with load because more fuel is burnt to meet the power requirement.
Graph No 5: Brake power Vs. Brake thermal efficiency
DESCRIPTION: In the above graph Brake Thermal efficiency has been compared at various loads and it is 42%
26% 4%
28%
Heat Balance Sheet for
6kg
QB.P. QC.W. QE.G QU
0 0.0002 0.0004 0.0006 0.0008
0 5 10 15
FU EL CON SUM PTI ON B.P.
B.P. Vs fuel consumption
B.P. Vs fuel consumption 0 0.05 0.1 0.15 0.2 0.25
0 5 10 15
B
.S
.F
.C.
B.P.
B.P. Vs B.S.F.C.
B.P.Vs B.S.F.C. 0 100 200 300
0 5 10 15
EX H A US T TE M PE R A TU R E B.P.
B.P. Vs EXHAUST
TEMPERATURE
B.P. Vs EXHAUST TEMPERATURE 0 500 10 20
ɳ
b
th
B.P.
B.P. Vs ɳbth
B.P. Vs ɳbth
LOAD
(kg) QS QB.P. QC.W. QE.G QU
1 46418.4 17454.92 7531.2 962.08 20470.2
2 49744.8 20374.69 11296.8 1486.56 16586.75
4 57909.6 24519.4 15062.4 1988.12 16339.68
6 67888.8 31745.38 18828 2798.14 14517.28
7 80740.8 36992.12 26359.2 3278.01 14111.46
VOLUME 3, ISSUE 4, Apr.-2017
158 | P a g e shown in figure. It is observed that the Brake Thermal
efficiency was considering higher over entire load range.
Graph No 6: Brake power Vs. Mechanical efficiency
DESCRIPTION: In the above graph Brake power is taken in x-axis and Mechanical Efficiency should be taken in y-axis. The Mechanical efficiency of the blends has been compared with diesel fuel at various loads and it is depicted in figure. It is observed that the Mechanical Efficiency was considering Higher over entire load range.
5.FUTURESCOPE:
In the common test rig, each & every input parameter have to be changed manually and to find out the required output parameter, we have to measure by connecting the test equipment’s manually and to carry out the calculations manually. In future this manual test rig can be computerized using software’s which would be operator friendly
Modifications can be made such that it will result as a test bed and not as test rig which means any engine can be tested on the same setup.
Fuel consumption can be measure by volume difference or by weight difference. Radiator can be eliminated with direct connections. Flow meter is required for calculating mass and flow of exhaust gas.
CONCLUSION:
The complete design of each component has been discussed in detail and the same details are used for fabrication. The trail is carried on the engine and various performance parameters such as specific fuel consumption, Break thermal efficiency, mechanical efficiency and heat balance at various load conditions.
1. As brake power increases fuel consumption also increases
2. Brake specific fuel consumption decreases with increase in brake power
3. Exhaust temperature increases as brake power increases
4. As brake power increases both brake thermal efficiency and mechanical efficiency increases
Our project might be have some its own limitations but an effort has been made to the fullest to make it successful.
REFERENCES
1) Jayesh D.Vaghmashi1 Mr.D.R.Shah2 Mr.D.C.Gosai3
- An Experimental Study of Petrol Engine Using
Compressed Biogas as aFuel - IJSRD Vol. 2, Issue
04, 2014 ISSN (online): 2321-0613
2) N. BalajiGanesh1,Dr. B Chandra Mohan Reddy2
-Performance Analysis of Multi-Cylinder C.I. Engine
by using Various Alternate Fules- Ijergs Volume 2,
Issue 4, June-July, 2014 ISSN 2091-2730
3) SavitaPatil 1, Rupesh Kumar Malviya2, Kuber Dwivedi3 -Investigation on Performance Characteristics of Petrol EngineUsing Alternate Fuel - IOSR e-ISSN: 2278-1684,p-ISSN: 2320-334XIssue 4 Ver. V (Jul- Aug. 2014),
4) AinaTFolayan,”influence of engine parameter on performance characteristics of spark ignition
engine”, Pelagia research (200 8) pp1915-1922.
5) Ganeshan.V “Internal Combustion Engines”,7 Tata Mc.Graw Hill Publishing, New Delhi, 2002.
6) A Text Book on “Internal Combustion Engines” by Domkundwar
7) E.porpatham , A. Ramesh ,B. Nagalingam (2011)
Effect of compression ratio on the performance and combustion of a biogas fuelled spark igintion
enigne journal homepage
:www.elsevier.com/locate/fuel
8) Hey wood John.B, “Internal Combustion Enginees
Fundamental”, Mc. Graw Hill Book Company, New
Delhi, 1988.
9) Carl S. Hansen, Conly Hansen, Greg Sullivan,
“Using Biogas as a Fuel for Trucks and Tractors
“,paper number: 074145,ASABE Meeting at Minnesota during 17 - 20 June 2007
10)C.C.M. Luijten, E. Kerkhof, “Jatropha oil and biogas in a dual fuel CI engine for rural electrification
“,Energy Conversion and Management 52 (2011) 1426–1438
11)R. Chandra, V.K. Vijay , P.M.V. Subbarao , T.K. Khura, “ Performance evaluation of a constant speed IC engine on CNG, methane enriched biogas
and biogas “,Applied Energy xxx (2011)
12)A. S. Gautam, R .Garrick. J. H. Lee, C. M. Demico, P. E. Hannum and L. A.Villasmil, “A Comparison of the Emission from Gasoline vs Compressed Natural Gas for an Electronic Fuel Injected Two Cylinder,
Four-Stroke Engine” SAE Technical Paper
2012-32-0016, 2012. 70
75 80 85 90
0 10 20
ɳ
m
e
ch
B.P.