Baghdad Science Journal
Vol.16(3)2019
DOI: http://dx.doi.org/10.21123/bsj.2019.16.3.0588
Studies on Surface Morphology and Electrical Conductivity of PS Thin Films in
Presence of Divalent Complexes
Wasan A. Al-Taa'y
1Hanan Ibraheem
2Emad Yousif
2*
Haikel Jelassi
3Received 1/3/2018, Accepted 12/3/2019, Published 1/9/2019
This work is licensed under a Creative Commons Attribution 4.0 International License.
Abstract:
Optical properties and surface morphology of pure and doped Polystyrene films with different divalent metals of Zn, Cu and Sn and one concentration percentage have been studied. Measurements of UV-Vis spectrophotometer and AFM spectroscopy were determined. The absorbance, transmittance and reflectance spectrums were used to study different optical parameters such as absorption coefficient, refractive index, extinction coefficient and energy gap in the wavelengths rang 200-800nm. These parameters have increased in the presence of the metals. The change in the calculated values of energy gaps with doping metals content has been investigated in terms of PS matrix structural modification. The value of optical energy gap was found decreasing from 4.5eV of pure PS to reach 4.45, 4.38 and 4.32eV for Zn, Cu and Sn respectively. Measurement by AFM spectroscopy was done for two and three dimensional topographic images. From figures, the data of roughness average were 7.29, 7.31, 3.37 and 6.73nm for samples (Blank, Zn, Cu and Sn) respectively.
Key words: Energy gap, Metal complexes, Morphology, Optical properties, Polystyrene.
Introduction:
The electronic components majority in microelectronic circuits is passive and raise above 80% of the surface area for printed wired. The overall performance of the heterogeneous system was affect by the dispersion of an electrically conductive phase within an insulating polymer matrix. It was reported that if the scattered metallic particle is in suitable quantity, semiconductive or a conductive composite is generated. Good properties of these systems make them technologically important and competitive to other alternate materials which lead to their cost-effectiveness. Conductive polymer composites are major for applications referring to electromagnetic interference (EMI) shielding, radio frequency interference (RFI) shielding, and electrostatic dissipation of charges (ESD). Composites can be realized as materials that contain two or more physically and chemically various phases separated via a distinct interface (1,2).
1 Department of Physics, College of Science, Al-Nahrain
University, Baghdad, Iraq.
2 Department of Chemistry, College of Science,
Al-Nahrain University, Baghdad, Iraq.
3 Laboratory "Energy and Matter for Nuclear Sciences
Development"(LR16CNSTN02), National Centre for Nuclear Sciences and Technologies, Sidi Thabet Technopark 2020 Ariana, Tunisia.
*
A certain group polymer distinguished via the monomer unit molecular weight to investigate the reactions in the polymers solid state of few modules have been proposed. One such modal treats a polymer as a total of just rigid tubes caught to each other in nearly parallel bundles of forces emerge from particle-particle potential. The polymers structure has been regarding to inner pressure and the same study has been expanded to polystyrene solutions. The Gruneissen parameter, bulk modules and specific heat are good properties of polystyrene have also been reported. Polystyrene is amorphous polymer with bulky side groups. General properties of PS are rigid, hard and transparent at room temperature and glass like thermoplastic material which can be soften and distort under heat. It is soluble in aromatic hydrocarbon solvents, cyclohexane and chlorinated hydrocarbons (3).
Thin films Optical attributive gives indication about some significant physical properties, such as band structure, band gap energy and role of defects. The envelop method has been advanced for transmittance measurements to determine the extinction coefficient, absorption coefficient and refractive index (1).
reflectance of industrial polymeric films. Many studies have been conducted in this direction used polystyrene to develop these characteristics (4-7). The main aim of this work is to successfully prepare polymer and investigate the optical properties of pure and doped polystyrene films with different metals.
Materials and Methods:
Synthesis of Complexes4-amino-5-(pyridyl)-4H-1,2,4- triazole-3-thiol complex additive was synthesized based on literature (Scheme 1 and Table 1) by Haddad et al.
(8).
Scheme 1. The suggest structure of
complexes (where M
2+= Cu, Zn and Sn).
Table 1. The names of ligand (L) and its complexes (M-L2).
Code Name
L 4-amino-5-(pyridin-4-yl)-4H -1,2,4-triazole-3-thiol
ZnL2 bis [4-amino-5-(pyridin-4-yl)-4H-1,2,4-triazole-3-thiol] zinc(II). Cl2 CuL2 bis[4-amino-5-(pyridin-4-yl)-4H
-1,2,4-triazole-3-thiol] copper(II) .Cl2 SnL2 bis[4-amino-5-(pyridin-4-yl)-4H
-1,2,4-triazole-3-thiol] tin(II) . Cl2
By computerized UV-visible spectrophotometer (shimadzu UV-1601 PC), the absorbance and optical transmittance were registered in wavelength range (200-800) nm. In order to observe the effect of doping on the parameters under realization, optical transmittance and absorbance were calculate, in which absorption A, transmission T, absorption coefficient α, refractive index n, extinction coefficient k, and energy gap Eg. Atomic
force microscopy (AFM) images were listed using a Veeco instrument (Veeco Instruments Inc., Plainview, New York, NY, USA).
PS Films Preparation
The PVC films (Thickness = (0.6±0.1|) nm) were intended at room temperature using casting technique. Additives b, c and d were added to PS at 0.5% concentration by weight in chloroform. Chloroform was taken away at room temperature by evaporation for 24 hrs. The PS films thickness (40 µm) was constant
using a Digital Vernier Caliper
2610A micrometer (Vogel GmbH, Kevelaer,
Germany).
Result and Discussion:
Figures 1 and 2 show the UV–VIS absorbance and transmittance spectra in the region (200-800)nm for pure PS and PS containing metals. It is obvious from figure 1, that in the visible region all films have very low transparent, then absorbance is rapidly reduce with rising wavelength. This attitude may refer to perfection and stoichiometry of the films (8). The absorption increased with different metals of (Zn, Cu and Sn) (b, c and d) respectively after doping films, the incident light is absorbed by free electrons. Consequently, absorbance is increased by the adding of these metals. These results are in agreement with Caixia Kan et al., in 2010 (9).
Figure 1. Absorption spectra of (a-d) PS samples. a= PS blank, b= PS+ ZnL2, c=PS+CuL2, d= PS+
SnL2
Figure 2. The transmittance spectra of PS films (a-d).
The coefficient of absorption α calculated by using relation (1) (13, 14) :
( 1 ...)
Where A = the absorption; t = the thickness of film. Figure 3 present the coefficient absorption as a wavelength function, increasing in the wavelength for all films (a-d) a decreasing behavior for the absorption coefficient has taken place. In contrast, the coefficient of absorption increases with alteration of doping metals, this increasing may due to the difference in concentration of carrier or to the presence of more transmissions from higher vibration scale of the ground state to higher sublevels of the first excited singlet state (15).
Figure 3. Alteration in the coefficient of absorption as a wavelength function.
The index of refractive (n) for the films are determined from the reflectance (R). Figure 4 shows the variation of refractive index versus wavelength for all films before and after doping. It is evident from this figure that the refractive index shows
regular variation with the wavelength (200-270) nm for all samples and hence highly occurs refractive index in the beyond wavelength. After doping impurity materials for samples (b, c and d) of (Zn, Cu and Sn) respectively, the refractive index was increased. Increasing in refractive index is helpful of the polymers in photonics and optics attributed to their power to decrease the reflection losses at interfaces (16).
Figure 4. Alteration of n as a wavelength function.
Figure 5 shows the credence of the extinction coefficient K on the range of wavelength (200-800) nm for pure and doped films. It is clear that K for films demonstrates quite increase in the region of wavelengths (200-270) nm because the losses in incident wave energy. On the other hand, it shows a lowering in the extinction coefficient in the wavelengths (270-800) nm. This attitude could be assigned to the growing coating transmittance magnitude for this coating region for films (17). Extinction coefficient increased highly for PS films after the doping of impurities because the increasing in coefficient of absorption where K
depending on the absorption coefficient as shown in the relation 2 (17, 18).
𝑘 =α λ4 𝜋 ……….(2) 5
30 55 80 105
200 400 600 800
a b c d
T
ra
n
smi
tta
n
ce
Wavelength (nm)
t
A
303
.
2
Figure 5. Alteration of K as a wavelength function.
According to the theory of inter-band absorption, the Tauc's relation used to calculate the optical band of the films as display in equation (3):
(αhυ)𝑝= A(hυ– Eg) ………….(3)
Where: A= constant; h= Planck's constant; υ= the frequency of photon; Eg = the optical band gap;
p = an index which could accept various account award to the electronic transition.
The empirical data fitted the theoretical Eq (3) for different values of p and the best fit was obtained for p=2, this behavior direct that the transitions are allowed direct transitions. The direct allowed band gap was calculated by plotting (αhν)2
as photon energy function E for films (a, b, c, d) are shown in Figures (6 to 9) respectively, the diagram is a straight line and the Eg value is gained by
extrapolating the linear part of the diagram to intercept the axis of photon energy (19). It is found that Eg reduces from (4.5) of pure sample to (4.45,
4.38 and 4.32) eV for samples (b, c and d) respectively. Showing the values of direct allowed gap is mentioned in Table (2). By considering the differences in mobility gap of the doped polymer, one can comprehend the lowering in Eg of PS films
after adding different metals and stable concentration (20).
Table 2. The optical energy gap of pure and doped PSfilms.
Name PS/metals Eg (eV)
a PS blank 4.5
b PS+ZnL2 4.45
c PS+CuL2 4.38
d PS+SnL2 4.32
Figure 6. Alteration of the (αhν)2 quantity as a photon energy function for PS blank film.
Figure 7. Alteration of the (αhν)2 quantity as a photon energy function for PS+ZnL2 film.
Figure 9. Alteration of the (αhν)2 quantity as a photon energy function for PS+SnL2film.
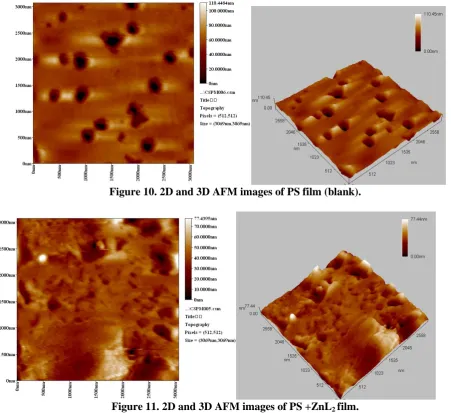
Atomic force microscope AFM, a kind of scanning force microscopy, was progressing for mapping two and three-dimensional topographical differences in atomic surfaces with high resolution. The usage of this device on polymeric films
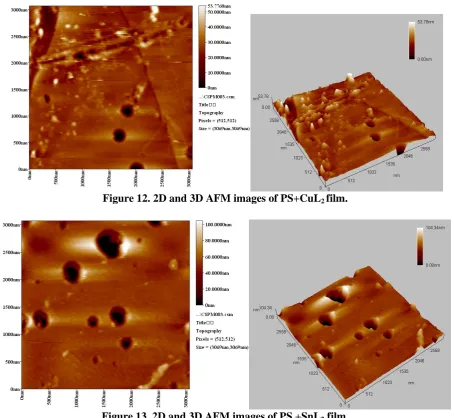
surfaces is particularly appropriate polymer general loss of crystallinity due to large difference in the surface topography. The surface functionalization techniques like corona treatment, grafting and plasma processing increasing the roughness of surface greatly therefore exactly measured by AFM. AFM is good instrument to gauge the factor of roughness, two and three dimensional topographical images and pores size of the sample (21-23). This study used 2D and 3D topographical images of all prepared films over the scanned area 5.0 µm x 5.0 µm (24,25). The AFM analysis of all samples is presented in figures (10-13) for two and three dimensional images. From these figures the data of roughness average is (7.29, 7.31, 3.37 and 6.73)nm for samples (Blank, Zn, Cu and Sn) respectively, this result clear PS+CuL2 surface when is smooth,
but PS Blank, PS+ ZnL2 and PS + SnL2 surfaces
are rough.
Figure 10. 2D and 3D AFM images of PS film (blank).
Figure 12. 2D and 3D AFM images of PS+CuL2 film.
Figure 13. 2D and 3D AFM images of PS +SnL2 film.
Conclusion:
The results of this study signalize that metals can effectively dope PS and grow its optical properties. The existence of metals leads to increase absorption and decrease transmission with different type of metals and for one concentration. The absorption coefficient, refractive index, extinction coefficient were increased with additive metals concentration. The energy gap values exhibit depending on type of used metal which decreased from 4.5eV of pure PS to (4.45, 4.38 and 4.32) eV for (Zn, Cu and Sn) respectively. Measurement using the AFM spectroscopy was illuminated for two and three dimensional topographic images. From results of figures the data of roughness average was removed and fixed to be 7.29, 7.31, 3.37 and 6.73nm for samples (Blank, Zn, Cu and Sn) respectively. These results a clear PS+CuL2
surface which is smooth but PS Blank, PS+ZnL2
and PS+SnL2 surfaces are rough.
Conflicts of Interest: None.
Reference:
1. Aziz B, Hussein S, Hussein AM., Saeed SR. Optical Characteristics of Polystyrene Based Solid Polymer Composites. Int. J. Metals. 2013; 2013:6.
2. Kadhim RG. Study of Some Optical Properties of Polystyrene - Copper Nanocomposite Films. World Sci. News. 2016; 30:14-25.
3. Alwan TJ. Refractive Index Dispersion and Optical Properties of Dye Doped Polystyrene Films. Malaysian Polym. J. 2010; 5:204-213,
4. Tahir DA. Optical properties of polymer composite PS-PC thin films. Journal of Kirkuk University – Scientific Studies. 2010; 5:39-103.
5. Beckera MR, Stefanib V, Correiac RRB, Bubeckd C, Jahjad M, Fortea MMC. Waveguide optical properties of polystyrene doped with p-nitroaniline derivatives. Opt. Mat. 2010; 32:1526–1531.
6. Habibi B, Golbedaghi, R, Keymanesh, M.R. UV-degredation effect on optical and surface properties of polystyrene –TiO2nanocomposite films. J. iranian chem. society. 2011;8:s161-s168.
8. Haddad R, Yousif E, Ahmed A. Synthesis and characterization of transition metal complexes of 4-Amino-5-pyridyl-4H-1,2,4-triazole-3-thiol. Spr. Plus. 2013; 2: 510-516.
9. Kan C, Wang C, Zhu J, Li H. Formation of gold and silver nanostructure within polyvinylpyrollidone (PVP) Gel. J. of solid state chem. 2016; 183:858- 865.
10.Al-Taa'y WA, Abdulnabi MT, Yousif E. The effect of NICL2 on the optical properties of poly vinyl alcohol films. Yanbu j. eng. sci. 2014; ISSN 1658-5321. 11.Oboudi SF, Abdulnabi MT, Al-Taa'y WA, Yusop
RM, Derawi D, Yousif E. Dispersion characterization of conductive polymer. Int. J. Elctrochem. Sci. 2015;10: 1555-1562.
12.Al-Taa'y WA, Abdulnabi MT, Yusop, RM, Yousif E, Abdullah, BM, Salimon J, Salih N, Zubairi SI. Effect of nano ZnO on the optical properties of poly(vinyl chloride) films. Adv. in material sci. eng. 2014;Article id 697809, 6 pages.
13.Han X, Liu R, Chen W, Xu Z. Properties of nanocrystalline zinc oxide thin films prepared by thermal decomposition of electrodeposited zinc peroxide. Thin Solid Films. 2008 ;516:4025- 4029. 14.Yousif E, Al-Taa'y WA, Noaman R, Esmael B,
Abdalameer J, Abbas Q, Ahmed A.2016. Effect of nano TiO2 on the optical properties of PVC contains triazole moieties. Yanbu j. eng. sci. 2016; ISSN 1658-5321.
15.Ahmed RM. Optical study on poly(methyl methacrylate)/poly(vinyl acetate) blends. Int. J. photoenergy . 2009;Article ID 150389:7 pages. 16.Obreja P, Kusko M, Cristea D, Purica M, Comanescu
F. Doped polymers controllable indexe-preparation, processing and applications, Proceedings of the
symposium on photonics Technologies for 7th Framework program. Wroclaw. 2006; 12-14:392-395. 17.Al-Taa'y WA, Abdulnabi MT, Al-Rawi TK. The MR affect on optical properties for poly (Vinyl alcohol) films. Baghdad sci. j. 2011;8:543-550.
18.Al-Ramadin Y. Optical properties of poly(vinyl alcohol)/poly(ethylene oxide) blend, optical materials. 2000; 14:287-290.
19.Prabahar S, Balasubramanian V, Suryanarayanan N, Muthukumarasamy N. Optical properties of copper indium diselenide thin films. Chalcogenide letters. 2010; 7:49-58.
20.Zahr EH, Hafez AI. Physics-chemical stability of PVA films doped with Mn+2 ions against weathering conditions. The Arab. J. sci. eng. 2009; 34:13-26. 21.Ismael M, Hmood AB, Shaaln N, Al-Taa'y WA,
Hassan A, Ali M, Ahmed A, Yousif E. Study on Optical properties of PVC-2,5di(2-pyrrole hydrazone) 1,3,4-thiadiazole complexes. Research j. pharma., Biolog. Chem. Sci. 2016; 7:2347-2355.
22.Ahmed DS, El-Hiti GA, Hameed AS, Yousif E, Ahmed A. New Tetra-Schiff Bases as Efficient Photostabilizers for Poly(vinyl chloride). Molecules. 2017; 22:1506.
23.Ahmed DS, El-Hiti GA, Yousif E, Hameed AS. Polyphosphates as Inhibitors for Poly(vinylChloride) Photodegradation. Molecules. 2017; 22:1849.
24.Yousif E, Ahmed DS, Ahmed AA, Hameed AS, Muhamed SH, Yusop RM, Redwan A, Mohammed SA. The effect of high UV radiation exposure environment on the novel PVC polymers. Env. Sci.Pollution Research. 2019.
25.Shaalan N, Laftah N, Muslih R, Yousif E. Photostability Study of Some Modified Poly(vinyl chloride) Containing Pendant Schiff’s Bases. Baghdad Sci. J. 2016;13: 188-195.