ISSN: 2146-4138 www.econjournals.com
Modelling the Dependence Structure of MUR/USD and MUR/INR
Exchange Rates using Copula
Vandna Jowaheer
University of Mauritius, Faculty of Science, Reduit, Mauritius. Email: [email protected]
Nafeessah Z. B. Ameerudden University of Mauritius, Reduit, Mauritius. Email:[email protected]
ABSTRACT: American Dollar (USD) and Indian Rupee (INR) play an important role in Mauritian economy. It is important to model the pattern of dependence in their co-movement with respect to Mauritian Rupee (MUR), as this may indicate the export-import behavior in Mauritius. However, it is known that distributions of exchange rates are usually non-normal and the use of linear correlation as a dependence measure is inappropriate. Moreover it is quite difficult to obtain the joint distribution of such random variables in order to specify the complete covariance matrix to measure their dependence structure. In this paper, we first identify the marginal distributions of the exchange rates of MUR against USD and INR and then select the best fitting copula model for the bivariate series. It is concluded that both the series are asymmetric and fat-tailed following hyperbolic distribution. Their dependence structure is appropriately modeled by t copula.
Keywords: Bivariate copula; Dependence structure; Exchange rates; Hyperbolic Distribution JEL Classifications: C2; F
1. Introduction
Mauritius has several Indian and American trade transactions and treaties. Therefore, in Mauritian economy, both the Indian Rupee (INR) and the American Dollar (USD) play significant roles in connection with Mauritian Rupee (MUR). Since, INR and USD are interrelated due to global trade, the exchange rates MUR/USD and MUR/INR are expected to be interdependent. It is of interest to model this dependence in order to explore the joint movement of MUR against USD and INR. This would help to understand the import and export business pattern in Mauritius.
dependence structure. This assumption is not realistic (Patton (2006), Dias and Embrechts (2009)) and mainly used because construction of exact joint density functions is not easy.
Copula approach has been able to bypass the need of complete covariance matrix to be derived from joint density function in order to explain the dependence structure. It provides a copula function that can link any type of marginal distributions to the joint distribution and analyses the marginal distributions separately from the dependence structure. The basic concept of copulas was given by Sklar (1959). Detailed explanation on copulas can be found in Patton (2009). Copula methodology is widely used in financial risk management [Aas (2004), Demarta and Mcneil (2005), Cherubini et al (2004). Bivariate copulas have been used to model the dependence of exchange rate of a currency against two currencies. These include USD, GBP, EUR, YEN, FRANC, PLN, CZK, Latin American currencies and many more. However, no models exist for the exchange rate of MUR against USD and INR in the literature. In section 2, brief description of copula models is provided. In section 3, we identify the best fitting distributions to MUR/USD and MUR/INR exchange rates. In section 4, we obtain the copula model which can best describe the dependence structure between the two exchange rates. The paper concludes in section 5.
2. Copula Models
Let G x y( , )be the bivariate cumulative distribution function and
F
X( )
x
,F y
Y( )
be the marginalcumulative distribution functions of random variables X and Yrespectively. Then copula C is a function such that
( , )
(
X( ),
Y( ))
( , )
G x y
C F x F y
C u v
.The lower limit of copula function is given by
C u v
( , )
max(
u v
1; 0)
indicating the totalnegative dependence and the upper limit is given by
C u v
( , )
min( , )
u v
indicating total positive dependence. Two widely used families of copulas are: Elliptical copulas including Gaussian copula and t copula.
Archimedean copulas including Clayton copula, Frank copula and Gumbel copula among others.
Elliptical copulas are suitable for modeling the dependence structure in symmetric data. Gaussian copula cannot model the tail dependence whereas t copula can model it. Clayton copula exhibits left-tailed asymmetry and Gumbel copula exhibits right-left-tailed asymmetry. Frank copula is the only symmetric Archimedean copula.
The Gaussian copula is defined as:
(1) where is the joint distribution function of a bi-dimensional standard normal vector with the linear Pearson correlation coefficient ρ. Thus,
being the parameter of the Gaussian copula. (2)
The t copula is defined as
(3)
The parameters of the copula are the correlation coefficient ρ and the degree of freedom .
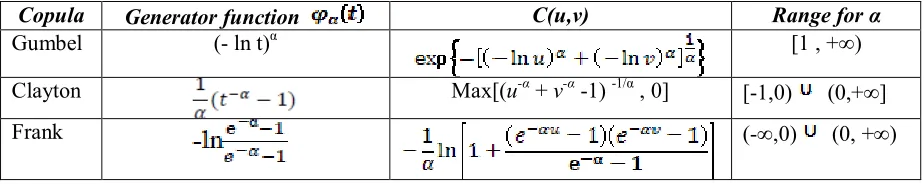
An Archimedean copula is given by
The function φ is called a generator of the copula with dependence parameter α. The table below gives generator function, the copula density and the range of the parameter α for the well known copulas.
Copula Generator function C(u,v) Range for α
Gumbel (- ln t)α [1 , +∞)
Clayton Max[(u-α + v-α -1) -1/α , 0] [-1,0) (0,+∞]
Frank (-∞,0) (0, +∞)
3. Marginal Distributions for MUR/USD and MUR/INR Exchange Rates
In this section, we identify the best fitting probability distribution for each of the weekly exchange rate series MUR/USD and MUR/INR. Geometric returns for both the series from 7th Nov 1993 to 28th Feb 2011 are obtained so as to make the series consistent and remove seasonality. Let
1
1
/
ln
/
t
t
MUR USD
rx
MUR USD
and
2
1
/
ln
/
t
t
MUR INR
rx
MUR INR
be the weekly geometric returns. The
summary statistics computed from 903 observations from each series are provided in Table 1.
Table 1. Summary statistics of
rx
1 andrx
2Statistic
rx
1rx
2Standard deviation 0.0071 0.0086
Skewness -0.6160 -0.6234
Kurtosis 5.6008 8.5582
ADF critical value -9.0022 -9.6248
p-value for ADF test 0.01 0.01
Summary statistics suggest that both series are negatively skewed and leptokurtic with very low variance. Augmented Dickey Fuller test result shows that both series are stationary. It is obvious that marginal distributions can’t be Gaussian. Six well-known distributions are fitted to both the series and on the basis of Akaike Information Criterion (AIC) values provided in Table 2, it is concluded that hyperbolic distribution provides the best fit to both series and normal is the worst. Figure 1 also confirms the good fit of hyperbolic distribution to these series. Hyperbolic distribution is in fact able to account for the heavy tails as well as the skewness in the data.
Table 2. Fitting of distributions to geometric returns of exchange rates Fit to
rx
1 Fit torx
2Distribution -AIC -AIC
Hyperbolic 6599.150 6284.186
Cauchy 6459.221 6196.627
Normal 6350.085 6013.985
Beta 4 6357.282 6018.842
Extreme Value Maximum 5767.962 5280.636
Figure 1. Hyperbolic fit to marginal series
Hyberbolic fit for weekly MUR/USD exchange returns
data D e n s it y
-0.04 -0.02 0.00 0.02
0 2 0 4 0 6 0 8 0 1 0
0 Asymm hyp
Gaussian
Hyberbolic fit for weekly MUR/INR exchange returns
data D e n s it y
-0.06 -0.04 -0.02 0.00 0.02 0.04
0 2 0 4 0 6 0 8 0 Asymm hyp Gaussian
4. Fitting the Copula Models to Bivariate Exchange Rates
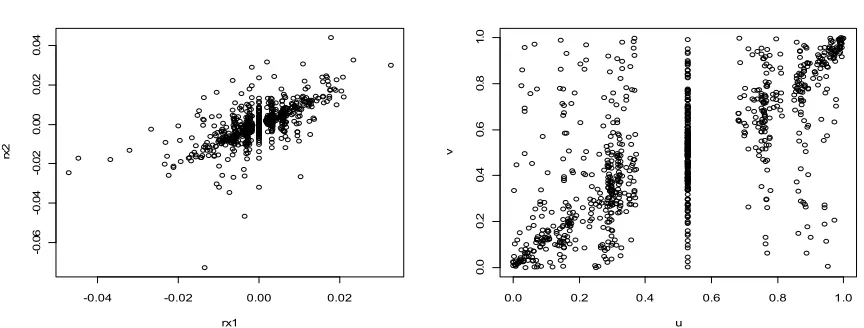
In this section, we fit the Elliptical and Archimedean copulas discussed in section 2, to model the dependence structure between MUR/USD and MUR/INR. R software is used for fitting the copulas. Specifically, from the fitted hyperbolic marginals, we first generate pseudo samples in the unit interval of [0,1]. The scatter plots of the real data and the pseudo data are shown in Figure 2. Using an approach similar to Dias et Embrechts (2009), we then simulate each copula for the bivariate exchange rate data and obtain maximum likelihood estimates of the corresponding copula parameters and information criterion values (AIC, SIC and HQIC).
Figure 2. Scatter Plots
Plot of actual returns Plot of Pseudo Samples
-0.04 -0.02 0.00 0.02
-0 .0 6 -0 .0 4 -0 .0 2 0 .0 0 0 .0 2 0 .0 4 rx1 rx 2
0.0 0.2 0.4 0.6 0.8 1.0
0 .0 0 .2 0 .4 0 .6 0 .8 1 .0 u v
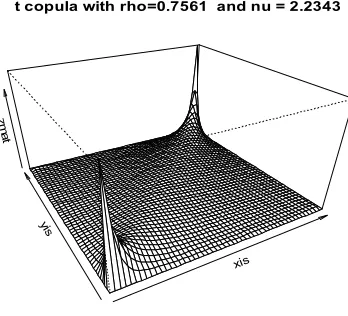
These values together with the values of dependence parameters are presented in Table 3. On the basis of information criteria, t copula gives the best fit followed by Gumbel, Frank, Gaussian and Clayton. t copula as shown in Figure 3, is capable of modeling the tail dependence.
Table 3. Copula Fit Results
Figure 3. t copula fit
xis
yis zm
a t
t copula with rho=0.7561 and nu = 2.2343
5. Conclusion
The dependence between the exchange rates of USD and INR with respect to MUR is modeled using copula approach. The two exchange rate series are marginally asymmetric as well as leptokurtic. The information criteria justify the fit of hyperbolic distribution to each series. Elliptical copulas and the Archimedean copulas: Frank, Clayton and Gumbel are then fitted to the pseudo bivariate series generated from hyperbolic distribution. On the basis of three information criteria based on log likelihoods, it is concluded that t copula is the best choice to explain the dependence between the MUR/USD and MUR/INR series.
References
Aas, K. (2004) Modelling the dependence structure of financial assets: A survey of four copulas.Technical report, Norwegian Computing Centre. Available at:
http://www.nr.no/files/samba/bbf/SAMBA2204.pdf
Ausloos, M and Ivanova, K. (2001) Correlation between reconstructed EUR exchange rates versus CHF, DKK, GBP, JPY and USD, International Journal of Modern Physics C,12(2), 169-195. Booth, P and Glassman, D (1987) The statistical distribution of exchange rates: Empirical evidence
and economic implications. Journal of International Economics, 22(3-4), 297–319.
Brunnrmeier, M.K., Nagel, S. and Pedersen, L.H. (2009) Carry trades and currency crashes, Macroeconomic Annual, 3(1), 313-348.
Cherubini, U., Luciano, E., and Vecchiato, W. (2004) Copula Methods in Finance, Wiley, Chichester. Chinn, M and Frankel, J. (1994) Patterns in exchange rates for 25 currencies, Journal of Money,
Credit and banking. 26(4), 759-770.
Coppes, R.C. (1995) Are exchange rate changes normally distributed?, Economic letters, 47(2), 117-121.
Tail index Copula
Estimated
parameters -AIC -SIC -HQIC
Spearman's
Rho Lower Upper
Gaussian 0.702 605 601 604 0.675 0 0
t 0.756, 2.234 820 810 816 0.740 0.547 0.597
Clayton 1.347 458 448 454 0.567 0.598 0
Frank 6.962 654 644 650 0.761 0 0
Dias, A. and Embrechts, P. (2009) Testing for structural changes in exchange rates-Dependence beyond linear correlation, The European Journal of Finance, 15(7), 619-637.
Demarta, S., & McNeil, A.J. (2005) The t copula and related copulas. International Statistical Review,
73(1), 111-130.
McFarland, J., Pettit, R. and Sung, S. (1982) The distribution of foreign exchange price changes: Trading day effects and risk measurement. Journal of Finance, 37(3), 693-715.
Patton, A.J. (2006) Modelling asymmetric exchange rate dependence, International Economic review, 47(2), 527-566.
Patton, A.J. (2009) Copula-based Models for financial Time series in handbook of financial Time series, ed. By T. Anderson, R. Davis, J.P Kreira.
Sklar, A. (1959). Fonctions de reparition an dimensions et leur marges. Publications de l’Institut de Statistique de L’Universite de Paris, 8, 299-231.