8. Conclusions
The salient features of the results obtained and their summary are illustrated along with
the important conclusions drawn in the present thesis program.
The CDM activities are carried out in a fixed bed quartz micro-reactor operated in
a down flow mode at temperatures of 500-900 C and ambient pressures.
The CDM process is influenced by parameters like amount of active metal, nature
of support material, reaction temperature, catalyst calcination temperature, mode
of reduction, precipitation pH and Ni precursor.
The catalytic activity is also influenced by the amount of second metal component
i.e. Cu, which could enhance methane decomposition activity of the active Ni
component at higher temperatures.
20 wt% Ni loading is found to be optimum loading over HY zeolite, that posses
higher activity than other zeolite systems.
Ni-Al2O3-SiO2 (4:0.5:1.5) catalyst is reduced with N2H4 showed superior activity
over all the Ni-based systems at 550 C reaction temperature.
It is observed that the addition of Cu to Ni supported systems enhances methane
decomposition activity when it is added in an appropriate amount. It is also
observed that the Ni-Cu-Al2O3 (60:25:15) catalyst pose higher hydrogen yields
over other Ni-Cu-Al2O3 compositions.
Decomposition results revealed that the quantity of Cu presence in Ni-Cu-SiO2
catalysts have significantly influenced methane decomposition activity of Ni. The
catalyst Ni-Cu-SiO2 (60:25:15) calcined at 450 C for 5 h showed high carbon
Chapter VIII. Conclusions
Over all, the hydrogen (or) carbon yields are increasing with the systems in the
order of 20 wt% Ni/HY < Ni-Al2O3-SiO2 (4:0.5:1.5) < Ni-Cu-Al2O3 (60:25:15) <
Ni-Cu-SiO2 (60:25:15) combinate systems.
The Ni metal surface areas are calculated from O2 pulse chemisorption that
behaves linear relationship with H2 yields.
The XRD patterns of oven dried Ni-Cu-Al2O3 and few Ni-Al2O3-SiO2 samples
reveal the formation of hydrotalcite like catalyst precursors. However, the HT-like
structure is collapsed with the thermal treatment at 450 C for 5 h in static air.
XRD spectra of all the fresh samples revealed Ni containing phase is only NiO
irrespective of the method of preparation, however, the crystallinity is varied with
the preparation method and the amount of Ni. In addition to NiO phase, CuO
phase is also observed in few fresh Ni-Cu based samples, where Cu, is present at
high loadings.
All the XRD patterns of deactivated samples have revealed the appearance of
metallic Ni phase and is dominated by graphitic carbon phase.
TPR profiles of impregnated Ni based catalysts showed single reduction center
i.e. Ni2+ Ni0 (~ 450 C), in contrast to two reduction centers observed for
co-precipitated Ni based catalysts. Also a less intense low temperature peak is
observed in between 250-300 C and is attributed to the reduction of Ni2+ species
that are not interacted with the support. The second reduction peak is more intense
at high temperature peak in the region of 450-700 C with a Tmax of 580 C and is
ascribed to the reduction of NiO interacted with the support material presumably
Chapter VIII. Conclusions
The TPR profiles of Ni-Cu based catalysts showed three reduction centers, the
low temperature reduction peak (240-260 C) is due to phase transfer of Cu2+ to
Cu0, whereas the moderate temperature reduction peak (425-520 C) belongs to
reduction of Ni2+ and is interacted with Cu. The high temperature reduction peak
(600-620 C) is due to the presence of Ni2+ interacted with Al2O3, SiO2 supports.
Furthermore, the Tmax of moderate temperature reduction peak is shifted towards
low temperature with increase in Cu content. The shift in Tmax is due to the added
Cu that produces spillover hydrogen, which considerably accelerates the
nucleation of the Ni metal in these reduction conditions, and enhances the
reducibility of Ni. This suggests the role of Cu, which enhances the reducibility of
dispersed Ni2+ species resulting in the shift of Tmax towards low temperatures.
XPS results suggests the presence of Ni2+ in all the catalysts, however a shift in
the binding energy towards higher side with increase in the amount of Al3+ or Si4+
amounts are observed.
The relative surface compositions obtained by XPS analysis has indicated that
Ni-Cu-Al2O3 (60:25:15) sample is enriched with Ni when compared to other
Ni-Cu-Al2O3 catalysts, that could be one of the reason to pose higher activity.
The XPS analysis of Ni-Cu-SiO2 has indicated the main line of Ni 2p at BE of
855 eV that implies a change in the chemical state of NiO NiSiO3.
SEM and TEM images of deactivated catalysts are revealed that the deposited
carbon is filamentous in nature and the Ni has occupied at the tip of the filaments.
However, the size and length of the filaments are varied with the catalyst
Chapter VIII. Conclusions
Raman spectra reveals the deposited carbon is filamentous in nature and can be
distinguished the presence of ordered (G-band) and defective (D-band) structures
of carbon. The high CDM activity over Ni-Cu-Al2O3 (60:25:15) catalyst could be
possibly due to deposition of high amount of ordered carbon when compared to
other Ni-Cu-Al2O3 catalysts.
Methane decomposition results in the decrease of surface area, pore volume,
micro-pore volume and increase of average pore diameter revealing that
adsorption and decomposition of methane occurs mainly in the micropore of
activated carbons.
The activation energies over activated carbons for methane decomposition are in
the range of 170-175 kJ/mol.
The carbon catalyst COC showed highest initial methane conversion rate of
1.27 mmols/min.g, and a sustainability factor of 0.40 with a carbon yield of
890 mg/g-cat at 900 ºC.
The salient features of all the results obtained in the present thesis work are summarized
Chapter VIII. Conclusions
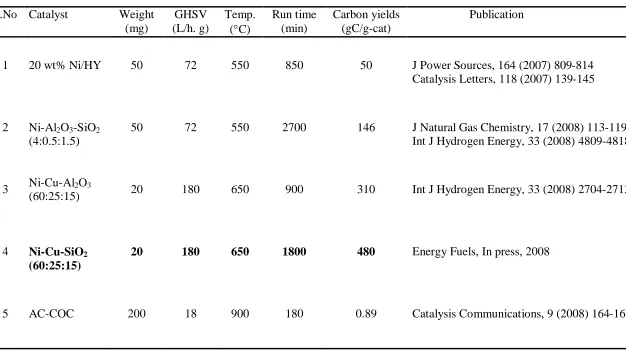
Table 8.1: Results at a glance on “Study and development of methane decomposition catalysts for COX-free hydrogen.”
S.No Catalyst Weight (mg)
GHSV (L/h. g)
Temp. (C)
Run time (min)
Carbon yields (gC/g-cat)
Publication
1 20 wt% Ni/HY 50 72 550 850 50 J Power Sources, 164 (2007) 809-814 Catalysis Letters, 118 (2007) 139-145
2 Ni-Al2O3-SiO2 (4:0.5:1.5)
50 72 550 2700 146 J Natural Gas Chemistry, 17 (2008) 113-119 Int J Hydrogen Energy, 33 (2008) 4809-4818
3 Ni-Cu-Al2O3
(60:25:15) 20 180 650 900 310 Int J Hydrogen Energy, 33 (2008) 2704-2713
4 Ni-Cu-SiO2
(60:25:15)
20 180 650 1800 480 Energy Fuels, In press, 2008
5 AC-COC 200 18 900 180 0.89 Catalysis Communications, 9 (2008) 164-169